Fish species distribution in seagrass habitats of chesapeake bay are structured by abiotic and biotic factors
Bạn đang xem bản rút gọn của tài liệu. Xem và tải ngay bản đầy đủ của tài liệu tại đây (547.86 KB, 12 trang )
BioOne sees sustainable scholarly publishing as an inherently collaborative enterprise connecting authors, nonprofit publishers, academic institutions, research
libraries, and research funders in the common goal of maximizing access to critical research.
Fish Species Distribution in Seagrass Habitats of Chesapeake Bay are Structured
by Abiotic and Biotic Factors
Author(s): Jason J. SchafflerJacques van MontfransCynthia M. JonesRobert J. Orth
Source: Marine and Coastal Fisheries: Dynamics, Management, and Ecosystem Science, 5():114-124.
2013.
Published By: American Fisheries Society
URL: />BioOne (www.bioone.org) is a nonprofit, online aggregation of core research in the biological, ecological, and
environmental sciences. BioOne provides a sustainable online platform for over 170 journals and books published
by nonprofit societies, associations, museums, institutions, and presses.
Your use of this PDF, the BioOne Web site, and all posted and associated content indicates your acceptance of
BioOne’s Terms of Use, available at www.bioone.org/page/terms_of_use.
Usage of BioOne content is strictly limited to personal, educational, and non-commercial use. Commercial inquiries
or rights and permissions requests should be directed to the individual publisher as copyright holder.
Marine and Coastal Fisheries: Dynamics, Management, and Ecosystem Science 5:114–124, 2013
C
American Fisheries Society 2013
ISSN: 1942-5120 online
DOI: 10.1080/19425120.2013.804013
ARTICLE
Fish Species Distribution in Seagrass Habitats of Chesapeake
Bay are Structured by Abiotic and Biotic Factors
Jason J. Schaffler*
Center for Quantitative Fisheries Ecology, Old Dominion University, 800 West 46th Street, Norfolk,
Virginia 23529, USA
Jacques van Montfrans
Virginia Institute of Marine Science, College of William and Mary, Post Office Box 1346,
Gloucester Point, Virginia 23062, USA
Cynthia M. Jones
Center for Quantitative Fisheries Ecology, Old Dominion University, 800 West 46th Street, Norfolk,
Virginia 23529, USA
Robert J. Orth
Virginia Institute of Marine Science, College of William and Mary, Post Office Box 1346,
Gloucester Point, Virginia 23062, USA
Abstract
Seagrass habitats have long been known to serve as nursery habitats for juvenile fish by providing refuges from
predation and areas of high forage abundance. However, comparatively less is known about other factors structuring
fish communities that make extensive use of seagrass as nursery habitat. We examined both physical and biological
factors that may structure the juvenile seagrass-associated fish communities across a synoptic-scale multiyear study
in lower Chesapeake Bay. Across 3 years of sampling, we collected 21,153 fish from 31 species. Silver Perch Bairdiella
chrysoura made up over 86% of all individuals collected. Nine additional species made up at least 1% of the fish
community in the bay but were at very different abundances than historical estimates of the fish community from
the early 1980s. Eight species, including Silver Perch, showed a relationship with measured gradients of temperature
or salinity and Spot Leiostomus xanthurus showed a negative relationship with the presence of macroalgae. Climate
change, particularly increased precipitation and runoff from frequent and intense events, has the potential to alter
fish–habitat relationships in seagrass beds and other habitats and may have already altered the fish community
composition. Comparisons of fish species to historical data from the 1970s, our data, and recent contemporary data
in the late 2000s suggests this has occurred.
Structurally complex habitats, such as seagrasses, provide
nurseries that enhance the survival of coastal marine fishes and
invertebrates during their early life (Thayer et al. 1984; Bell and
Pollard 1989; Gillanders 2006). Investigations of fish commu-
nities associated with seagrass beds along the western Atlantic
Subject editor: Kenneth Rose, Louisiana State University, Baton Rouge
*Corresponding author: jschaffl@odu.edu
Received September 4, 2012; accepted May 5, 2013
Ocean (Adams 1976; Wyda et al. 2002; Heck and Orth 2006)
and other parts of the world (Bell and Pollard 1989; Tolan et al.
1997; Baden and Bostr
¨
om 2001) document the attributes that
seagrasses provide as nursery habitats (Heck et al. 2003). These
include refuges from predation, breeding areas, enhanced prey
114
FISH SPECIES DISTRIBUTION IN SEAGRASS HABITATS 115
availability, and improved water quality, thereby demonstrating
their importance as productive and stabilizing components of
the marine environment (Orth et al. 2006).
However, seagrass habitats have been experiencing world-
wide declines via escalating threats from anthropogenic influ-
ences including direct and indirect effects of chemical pollu-
tants (i.e., nutrient enrichment, contamination) and increasing
sedimentation (Ralph et al. 2006; Waycott et al. 2009). Global
warming may also alter seagrass species composition by elimi-
nating or displacing species intolerant of warming temperatures
or through extreme climatic events (Duarte et al. 2006; Waycott
et al. 2009; Diez et al. 2012). These threats endanger not only
the seagrasses, but also the associated fish species that rely on
these habitats.
Numerous investigations have quantified fish associations
and changes in assemblages within seagrass habitats. The most
often cited factors affecting fish assemblages include feeding
behavior (Grenouillet and Pont 2001; Nagelkerken et al. 2006)
and physical gradients (Grenouillet and Pont 2001; Grubbs and
Musick 2007). Many investigations were conducted over broad
spatial areas but were temporally constrained (Bloomfield and
Gillanders 2005; Franca et al. 2009; Pereira et al. 2010; Gray
et al. 2011), whereas others have been temporally robust but spa-
tially limited (Fodrie et al. 2010; Sheppard et al. 2011). A study
that compared fish communities sampled in 1970 (Livingston
1982, 1985) to fish assemblages in 2006–2007 demonstrated a
poleward shift of 13 species indicative of range expansion due
to global temperature change (Fodrie et al. 2010). Manipulative
experiments in mesocosms have confirmed that species such as
Pinfish Lagodon rhomboides and Atlantic Croaker Micropogo-
nias undulatus choose seagrass habitats based on abiotic factors
(dissolved oxygen) coupled with biotic (food availability, preda-
tion risk) influences (Froeschke and Stunz 2012). These studies
document the reduced juvenile fish survival and altered species
composition in seagrass habitats that favor warmwater species
assemblages due to impacts of anthropogenic stressors and cli-
mate warming.
Concern exists in Chesapeake Bay, the world’s second largest
estuary, over the decline of seagrass beds since the 1960s, caused
principally by light attenuation due to elevated anthropogenic
inputs of sediments and nutrients (Orth and Moore 1983; Kemp
et al. 2005; Orth et al. 2010). The effects this decline may have
had on associated fish fauna, particularly those of commercial or
recreational importance, remain poorly documented. Most stud-
ies of Chesapeake Bay habitats have focused on single species
(Dorval et al. 2005b, 2007; Grubbs and Musick 2007), on a
few species (Woodland and Secor 2011), or on lower trophic
levels (Kimmel et al. 2006). Although there are valuable studies
of commercially important juvenile fish–habitat relationships
in Chesapeake Bay, e.g. Atlantic menhaden (Love et al. 2006),
few (Orth and Heck 1980; Heck and Thoman 1981; Sobocinski
et al. 2013) have examined assemblages associated with sea-
grass beds. Those that have sampled fish on seagrass beds have
posed single-species hypotheses (Dorval et al. 2005b, 2007;
Smith et al. 2008) related to growth processes rather than teas-
ing apart the potential factors affecting multispecies juvenile-
fish assemblages in these habitats or have examined community
structure on a limited geographic scale (Orth and Heck 1980;
Heck and Thoman 1981). Fishes in Chesapeake Bay use seagrass
beds seasonally with the greatest densities of young-of-the-year
fish occurring in submerged aquatic vegetation (SAV) from late
spring through fall (Orth and Heck 1980; Chesapeake Executive
Council 1990). Overall, studies on fish distributions in seagrass
habitats throughout the bay are limited and no synoptic inves-
tigations exist on fish associations within SAV beds on a broad
geographic scale over several years.
From this multiyear study (1997–1999), we provided a broad-
scale, synoptic evaluation of seagrass-associated fish communi-
ties in all major SAV habitats throughout the lower Chesapeake
Bay. We examined the effects of physical (salinity, temperature),
biological (presence of macroalgae), geographical (zone), and
temporal (year) factors on fish abundance within these seagrass
beds and tested the null hypothesis of a random fish distribution
throughout lower Chesapeake Bay. We also compared the fish
community from our collections to historical (Orth and Heck
1980; Weinstein and Brooks 1983) and contemporary (Sobocin-
ski et al. 2013) collections to make inferences about community
structure over time.
STUDY SITES
All sites we sampled were characterized by mixed beds of
eelgrass Zostera marina and widgeongrass Ruppia maritima
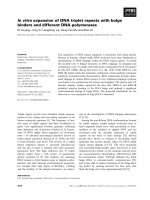
(Orth and Moore 1988). Fish species were sampled in the
polyhaline–mesohaline lower portion of Chesapeake Bay SAV
beds at random locations (Figure 1) nested within three dis-
tinct zones (Dorval et al. 2005a, 2005b, 2007; Hannigan et al.
2010). Zone 1 included Tangier and Smith Island in the midpor-
tion of the bay (including Bloodsworth Island in 1999); Zone 2
comprised the eastern shore from Crisfield, Maryland, to Cape
Charles, Virginia; and Zone 3 encompassed the western shore
with its northern boundary at either the Rappahannock River
(1997) or Great Wicomico River (1998 and 1999) and southern
boundary at Back River. Across these zones there were no dif-
ferences in seagrass bed density, size, or species composition
(Orth et al. 1996, 1997, 1998). These zones are spatially sepa-
rated by large, deep expanses of the estuary (i.e., river mouths)
that likely prevent cross-zone fish movements (e.g., Dorval et al.
2005b), thereby maintaining the integrity of fish communities on
small spatial scales during nonmigratory periods (i.e., summer
months).
METHODS
Diurnal, bay-wide fish community sampling was conducted
once in 1997 (September) and twice in 1998 and 1999 (August
and September). Each synoptic survey took place over 4–5 d
during periods of expected high juvenile fish abundance (Orth
and Heck 1980). A 4.9-m-wide otter trawl with a 12.7-mm
116 SCHAFFLER ET AL.
FIGURE 1. Map of lower Chesapeake Bay with zones and a typical array of sampling stations (August 1999) indicated.
FISH SPECIES DISTRIBUTION IN SEAGRASS HABITATS 117
stretch-mesh net and a 6.4-mm stretch-mesh cod end liner
was towed at a standardized speed of 1,200 rpm (approxi-
mately 4.8 K/h), resulting in a similar area swept at each
station. An average water depth of 0.6 m at mean low wa-
ter was required for trawling effectively during various tidal
stages. Trawls were conducted ± 2 h of high tide to minimize
tidal-related impacts to fish community structure. Fishes were
processed onboard immediately after collection, counted as
numbers per individual species and returned to the water to min-
imize the impact on community structure. Salinity and tempera-
ture were quantified with a refractometer and stem thermometer,
respectively, for most stations. In some cases, if a station was
within 500 m of another station (13% of all stations), we as-
sumed that physical characteristics were similar and the salinity
and temperature measurements from the nearby station were
used. In very few cases (<1% of all stations), temperature and
salinity were not directly quantified for a station or a nearby
station. For these locations, contemporaneous physical data
from the nearest Chesapeake Bay Program monitoring stations
(www.chesapeakebay.net/data
waterquality.aspx) were used.
Seagrass beds were sampled in proportion to their areal cov-
erage determined from the previous year based on annual SAV
distribution and abundance mapping efforts (Orth et al. 1996,
1997, 1998). At least 21 sampling locations were randomly as-
signed within each zone for each year in beds designated as
having a cover density of 70–100%, determined from the map-
ping efforts, which resulted in 545 tows over the course of this
study (Table 1). After a tow, we noted the presence of macroal-
gae in the sample.
In this study, we sequentially sampled the demersal, mobile
component of the fish community. We intentionally disregarded
more sedentary species (syngnathids, gobies [family Gobiidae],
and blennies [family Blenniidae]) because of gear escapement
or potential sampling bias for these species. In contrast to
other species in the community, their size or close association
with the bottom below the seagrass canopy would compromise
relative abundance estimates of those individuals. Thus, we are
TABLE 1. Number of sites sampled (N), mean temperature and salinity, and
percent of sites with macroalgae present for each zone and year sampled.
Temperature Salinity
Percent sites
Year Zone N Mean SD Mean SD with algae
1997 1 21 20.1 1.24 17.4 0.84 0.0
2 36 21.0 0.91 20.4 1.85 8.3
3 37 23.9 0.52 21.9 1.19 21.6
1998 1 42 26.9 1.20 17.5 0.84 0.0
2 87 25.8 1.36 20.9 2.32 4.6
3 92 26.4 1.75 19.5 2.26 8.9
1999 1 50 22.3 3.75 20.7 0.96 6.0
2 89 21.9 3.59 23.9 1.81 11.2
3 91 24.5 3.15 20.8 2.60 13.2
unable to assess the relative abundance estimates of sygnathids,
gobies, or blennies in our study relative to those reported in the
literature for Chesapeake Bay (Orth and Heck 1980; Weinstein
and Brooks 1983), and we have recalculated species abundance
after excluding these species for historical comparisons.
Statistical analyses.—Redundancy analysis (RDA) was ap-
plied to species and environmental data matrices to reveal plau-
sible relationships. Redundancy analysis is a constrained ordi-
nation method that models the response (i.e., species matrix)
variables as a function of the explanatory (i.e., environmen-
tal matrix) variables (ter Braak 1986; Legendre and Legendre
1998). The ordination finds the combination of variables that
best explain the variation of the response variables and uses
Monte Carlo permutation tests to determine the statistical sig-
nificance of the model and each of the explanatory variables. The
major advantages to using ordination methods for multivariate
data are that transformations are not necessary to fulfill sta-
tistical assumptions because statistical significance is assessed
with randomization tests and relationships between the re-
sponse and explanatory data matrices are easily visualized with
biplots.
Biplots were constructed with explanatory variables plotted
as vectors (continuous) or centroids (discrete), where the vec-
tor lengths indicated the relative strength of the relationship
with the response data. Response variables are typically plot-
ted as points so that the strength of their relationship with the
measured explanatory variables can be visually assessed in the
multivariate space by the biplot. Angles between the response
variables (plotted as a vector) and explanatory vectors reflect
their correlations: correlation is positive when the angle is less
than ± 90 degrees; correlation is negative when the angle is
greater than ± 90 degrees.
We fit a model where the species matrix was a function of
the environmental parameters (salinity, temperature, presence
of macroalgae, year, and location). Salinity and temperature are
continuous variables and were plotted as vectors along with the
presence of macroalgae. We used an effects model and included
year (1997 = 0, 1 or 1998 = 0, 1) and location (Zone 1 = 0,
1 or Zone 2 = 0, 1) as indicator variables. Only two indicators
are needed for both the 3 years and three locations to prevent
multicollinearity, but all are plotted for clarity. We tested each
parameter in the model with 10,000 permutations.
The RDA results were then used as an exploratory analysis
prior to generalized additive modeling (GAM). The GAMs are
very flexible, and provide an excellent fit when nonlinear rela-
tionships and significant noise occur in the predictor variables
(Hastie and Tibshirani 1990). Binomial GAMs were developed
for each species in the assemblage that showed a relationship
with a measured gradient. Local occurrence (presence = 1 and
absence = 0) was modeled against environmental variables for
all zones. We used a nominal α = 0.05 to assess statistical sig-
nificance. All statistical tests were conducted with the computer
program R (R Development Core Team 2005).
118 SCHAFFLER ET AL.
RESULTS
We collected 21,153 fish representing 31 species (Table 2)
over the 3 years from 545 otter trawl samples. The overwhelm-
ing majority of all individuals collected were Silver Perch
(86.1%). Spot made up 5.4% of all individuals collected fol-
lowed by Weakfish (2.4%), Spotted Seatrout (1.2%), Atlantic
Croaker (0.9%), and Atlantic Spadefish (0.9%). The remaining
26 species collectively made up less than 3.0% of all individuals
collected (Table 2). We also found that the species composition
has shifted from a Spot-dominated community in the late 1970s
to early 1980s (Orth and Heck 1980; Weinstein and Brooks
1983) to a community dominated by Silver Perch.
We saw a similar pattern with site occupancy, where the
numerically dominant species were found at the greatest pro-
portion of sites (Table 2). Silver Perch were found at >75%
of all sites followed by Spot at about 50% of all sites.
Weakfish and Spotted Seatrout occurred in about 25% of
all sites, while Atlantic Croaker, Southern Kingfish, Summer
Flounder, and Atlantic Spadefish occupied approximately 15%
of all sites. No other species occurred in more than 10% of sites
sampled.
There were significant differences between environmental
variables among zones (Table 1; F
6,1078
= 32.58, P < 0.0001).
Temperature (F
3,540
= 14.34, P < 0.0001), salinity (F
3,540
=
78.20, P < 0.0001), and the proportion of sites with macroal-
gae present (F
3,540
= 3.35, P = 0. 0187) showed differences
among zones. Year was a significant covariate only for salinity
(F
1
= 76.09, P < 0.0001). Salinity was different among all zones
and was higher during 1999 than other years. Temperature was
highest in zone 3 and similar between zones 1 and 2. There were
more sites in zone 3 containing macroalgae than at either zone
1 or 2, where proportions were similar (Table 1).
TABLE 2. Common scientific names of species captured in Chesapeake Bay, frequency of occurrence (%) among all fish captured, and frequency of occurrence
(%) among all sites sampled.
Species Species code Percent occurrence Percent occupancy
Spot Leiostomus xanthurus SPT 5.4 45.7
Silver Perch Bairdiella chrysoura SLV 86.1 77.2
Weakfish Cynoscion regalis WKF 2.4 19.8
Spotted Seatrout Cynoscion nebulosus SST 1.2 24.4
Harvestfish Peprilus paru HVF 0.2 4.6
Northern Puffer Sphoeroides maculatus NPF 0.3 8.3
Shad Dorosoma sp. SHD <0.1 1.5
Inshore Lizardfish Synodus foetens ILZ <0.1 0.7
Threespine Stickleback Gasterosteus aculeatus TSS <0.1 0.2
Pigfish Orthopristis chrysoptera PIG 0.5 9.4
Pinfish Lagodon rhomboides PIN 0.1 1.7
Striped Burrfish Chilomycterus schoepfii SBF <0.1 1.1
Orange Filefish Aluterus schoepfii FLF <0.1 0.4
Summer Flounder Paralichthys dentatus SMF 0.5 14.9
Northern Kingfish Menticirrhus saxatilis NKF 0.8 14.7
Atlantic Spadefish Chaetodipterus faber ASF 0.9 17.6
Atlantic Croaker Micropogonias undulatus ACR 0.9 11.7
Red Drum Sciaenops ocellatus RDM <0.1 0.4
Black Sea Bass Centropristis striata BSB 0.3 7.0
Cobia Rachycentron canadum COB <0.1 0.2
Grouper Epinephelus sp. GRO <0.1 0.6
Bluefish Pomatomus saltatrix BLF <0.1 1.5
Black drum Pogonias cromis BDM <0.1 0.6
Tautog Tautoga onitis TAU <0.1 1.7
Striped Bass Morone saxatilis STB 0.1 0.7
Florida Pompano Trachinotus carolinus FPO <
0.1 0.2
Sheepshead Archosargus probatocephalus SHE <0.1 0.6
Gray Snapper Lutjanus griseus MGS <0.1 0.4
Mojarra Eucinostomus sp. MOJ <0.1 2.9
American eel Anguilla rostrata AME <0.1 0.2
Hogchoker Tr inectes maculatus HOG <0.1 0.2
FISH SPECIES DISTRIBUTION IN SEAGRASS HABITATS 119
TABLE 3. Redundancy analysis eigenvalues, cumulative percent of variance explained, and Monte Carlo permutation tests (10,000 permutations) for all axes.
Statistic Axis 1 Axis 2 Axis 3 Axis 4 Axis 5 Axis 6 Axis 7
Eigenvalues 0.0817 0.0326 0.0228 0.0087 0.0044 0.0020 0.0010
Cumulative percent of variance explained 53.3 74.6 89.5 95.2 98.0 99.3 100.0
F-value 28.16 11.25 7.87 3.00 1.51 0.69 0.36
P-value <0.0001 <0.0001 <0.0001 <0.0001 0.1250 0.7833 0.9867
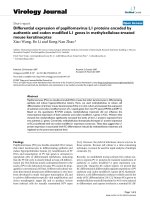
The first four axes of the RDA ordination were significant
(Table 3) and explained 91% of the cumulative variance. The first
axis explained 53% of the total variance. All measured explana-
tory variables explained a significant amount of the variance
(Table 4). Salinity appeared to be the most important variable
structuring the fish community (Figure 2). Temperature and the
indicator variables zone 1 and 1997 were also important. Zone
1 was negatively correlated with salinity and four species of fish
(Weakfish, Atlantic Croaker, Spotted Seatrout, and Southern
Kingfish) were most often encountered in this sampling area.
Conversely, Spot occurred most often at higher salinity sites in
zone 3 and Silver Perch were associated with moderate to high
salinity sites in zone 2.
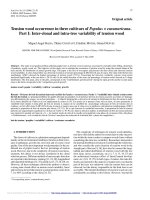
Because all effects in the RDA model were significant, we
built GAMs for the 10 species that showed a relationship with
measured gradients (Table 5). The deviance explained for these
models ranged from 3.2% for Spotted Seatrout to 35.1% for
Pigfish. Both temperature and salinity were significant for seven
or six species, respectively. Most species show a negative or no
response to low temperatures while showing a variable response
at moderate to high temperatures (Figure 3). For salinity there
was a mixed response at both high and low salinities (Figure 4).
Using 1999 as the baseline for comparisons, 1998 differed the
most as five species were either more (three) or less (two) likely
to be present at sampling locations. Conversely, during 1997
only Spot were significantly more likely to occur at sampling
locations. Similarly, using zone 3 as a baseline, five species
were either more or less abundant in at least one of the other
two zones. Weakfish were much more likely to be present in
TABLE 4. Monte Carlo permutation tests (10,000) for each term in the RDA
model. The terms 1999 and zone 3 were not included in the model because of
multicollinearity.
Effect Variance F-value P-value
Salinity 0.0372 12.82 0.0001
Temperature 0.0199 6.87 0.0001
Algae 0.0054 1.87 0.0385
1997 0.0276 9.49 0.0001
1998 0.0200 6.90 0.0001
1999 0.2115
Zone 1 0.0278 9.58 0.0001
Zone 2 0.0154 5.31 0.0001
Zone 3 0.2936
both zones 1 and 2 than zone 3, while Pigfish were much less
likely to be present in zones 1 and 2 than zone 3. The other
species showed a mixed response. The presence of macroalgae
only negatively impacted the presence of Spot.
DISCUSSION
Juvenile finfish populate nursery grounds in Chesapeake
Bay in response to habitat complexity (Orth and Heck 1980;
Weinstein and Brooks 1983), quality (presence of macroalgae;
Sogard and Able 1991), and gradients of temperature and
salinity. We explicitly tested the null hypothesis that the fish
community would not respond to abiotic gradients but found
that responses were highly variable between species where
site occupancy was influenced by the temperature and salinity
regime. For example, we showed that Spot responded positively
to both warmer temperatures and higher salinities. Under a
climate change scenario that included increased precipitation,
Spot would not be favored. In contrast to our findings, previous
-1
-0.5
0
0.5
1
-1 -0.5 0 0.5 1
RDA Axis 2
RDA Axis 1
Temperature
Salinity
1997
1998
1999
Zone 1
Zone 2
Zone 3
Algae
SPT
PIG
NPF
SLV
WKF
ACR
SST
NKF
ASF
BSB
HVF
SMF
SHD ILZ TSS
PIN SBF FLF
RDM COB GRO
BLF BDM TAU
STB FPO SHE
MGS MOJ AME
HOG
FIGURE 2. Redundancy analysis biplot examining juvenile finfish occurrence
in Chesapeake Bay in relation to measured environmental parameters. Continu-
ous response variables are represented by vectors and dummy indicator variables
are represented by a plus sign for year (1997–1998) and a multiplication sign
for location (Zone 1–3). See Table 2 for species codes.
120 SCHAFFLER ET AL.
TABLE 5. Generalized additive modeling results for the effects of environmental covariates on species presence–absence. Percent deviance is the percentage
of the deviance explained for the model, temperature and salinity are the estimated degrees of freedom of the smoothing parameter, and year (1997, 1998), zone
(1, 2), and algae (presence of macroalgae) are the estimated parameter effects for the remaining terms in the model. Values in bold italics indicate significance at
α = 0.05 and blank cells indicate that there were no individuals collected during 1997 and therefore only 1 year is needed for an effects parameterization.
Species Percent deviance Temperature Salinity 1997 1998 Zone 1 Zone 2 Algae
SPT 15.8 2.06 3.22 1.716 –0.315 –1.209 –0.039 –0.872
SLV 7.8 2.64 2.60 –0.018 –0.831 0.096 0.479 0.785
WKF 22.2 1.87 1.90 0.530 1.651 2.470 1.091 –0.036
SST 3.2 1.02 1.07 0.241 0.401 0.810 0.243 –0.659
HVF 12.7 1.00 2.27 –0.415 0.944 –0.431 –1.230
ASF 13.4 2.40 1.04 0.255 0.191 0.117 –0.286
NKF 7.4 1.99 1.03 0.190 0.917 0.486 0.277 –1.041
ACR 15.1 1.07 1.06 –0.420 1.895 0.588 0.558 0.018
NPF 15.7 7.53 1.03 –0.998 –0.737 –1.733 –1.836
PIG 35.1 2.50 6.73 –0.584 –4.262 –5.034 –0.854
research in Chesapeake Bay and the Hudson River estuary
indicated that the juvenile finfish community largely responded
to abiotic conditions over the previous year and current
conditions had no effect on community dynamics (Hurst et al.
2004; Wingate and Secor 2008). Our research demonstrated
the advantage of multiple-year broad-scale synoptic sampling
of these nursery areas by quantifying potential abiotic drivers
of community structure in the current year.
The physical and chemical structure of Chesapeake Bay
is well known (Austin 2004; Dorval et al. 2005a; Hannigan
et al. 2010); there is a salinity gradient along the main-stem
portion of the estuary and differences in salinity between areas
on the eastern and western shores. The salinity structure is
highly dependent on precipitation and discharge from the many
tributaries supplying freshwater. Wingate and Secor (2008)
have shown that both winter temperature and flow (a proxy
for salinity) are drivers structuring the fish communities in the
upper portion of Chesapeake Bay. Interestingly, Austin (2004)
found that salinity was lagged by about 90 d in response to
freshwater influx. This is a similar response to that noted for the
fish community in Chesapeake Bay (Wingate and Secor 2008).
Likewise, we have demonstrated the importance of salinity for
structuring the seagrass-associated juvenile fish communities.
Perturbations to the salinity regime in Chesapeake Bay have the
potential to alter the value of these nursery habitats to overall
stock dynamics. One of the looming drivers of the physical
and biological structure of the ecosystem is that from climate
change (Pyke et al. 2008). The predictions for the mid-Atlantic
region are for increased variability in precipitation, which, as
we have demonstrated, will lead to variable responses from
the juvenile fish community. The approach we took to use
GAM sets up a framework that enabled us to make inferences
about how this fish community would respond to potential
threats from climate change. We demonstrated that numerous
fishes in the community would respond negatively to decreased
salinity.
Presence of macroalgae was a significant variable in the
analysis for Spot and the overall fish community. Macroalgae
generally occur as drift accumulations throughout Chesapeake
Bay seagrass beds because seagrasses reduce current speed and
buffer wave action. At very high biomass levels, macroalgae
can smother and eliminate seagrass (Hauxwell et al. 2001) and
also promote hypoxia that negatively influences fish and inverte-
brate populations (Baden et al. 1990; Oesterling and Pihl 2001;
Deegan et al. 2002; Fox et al. 2009). Alternatively, at low to
moderate levels of abundance, macroalgae can increase habi-
tat complexity of seagrass habitats and provide additional food
resources for resident invertebrates, thereby providing added
forage for fish populations (Martin-Smith 1993; Norkko et al.
2000; Epifanio et al. 2003; Powers et al. 2007). The significant
negative association of macroalgae with the presence of Spot
and the overall fish community suggested that macroalgae was,
and will continue to be, a concern in Chesapeake Bay and poten-
tially other estuaries that are or are becoming more eutrophic,
which will influence macroalgal abundances (McGlathery et al.
2007).
Two sciaenids, Silver Perch and Spot, were the numerically
dominant species in fish assemblages associated with Chesa-
peake Bay seagrass beds in our study. In this study, Silver Perch
were far more abundant than Spot and present at most sam-
pling locations. This pattern contrasts sharply with a study by
Orth and Heck (1980), who sampled at similar times using
similar gear and reported that Spot were also ubiquitous but
they dominated the relative abundance of species encountered
in western shore locations (Mobjack Bay and the York River)
of Chesapeake Bay from 1976 to 1977 comprising over 63%
of individuals collected. Silver Perch in their study (Orth and
Heck 1980) made up just over 5% of the fish assemblage. A sim-
ilar abundance relationship was found by Weinstein and Brooks
(1983) within a seagrass bed at the mouth of Hungars Creek on
the eastern shore of the bay. They reported that Spot comprised
>80% of individuals collected, whereas Silver Perch accounted
FISH SPECIES DISTRIBUTION IN SEAGRASS HABITATS 121
FIGURE 3. Generalized additive modeling results for the effect of temperature
on the presence of selected species that showed a relationship with a measured
environmental gradient. The statistical significance of the smoothing function
is indicated in Table 5. The dashed lines around the smoothed fit are 95%
confidence intervals, and data availability is indicated by tic marks above the
x-axis. See Table 2 for species codes.
for between only 1% and 2% of the fishes sampled in seagrass.
More recent sampling in seagrass beds in the western shore of
lower Chesapeake Bay between 2009 and 2011 demonstrated
continued dominance of Silver Perch (Sobocinski et al. 2013),
suggesting a long-term, dramatic reversal in relative abundance
of the two species.
Other species frequently encountered in our study included
Weakfish, Spotted Seatrout, Northern Kingfish, Summer Floun-
FIGURE 4. Generalized additive modeling results for the effect of salinity
on the presence of selected species that showed a relationship with a measured
environmental gradient. The statistical significance of the smoothing function
is indicated in Table 5. The dashed lines around the smoothed fit are 95%
confidence intervals, and data availability is indicated by tic marks above the
x-axis. See Table 2 for species codes.
der, Atlantic Croaker, Atlantic Spadefish, and Black Sea Bass.
Several of these (Northern Kingfish, Atlantic Spadefish, and
Weakfish) were not collected in earlier investigations (Orth and
Heck 1980; Weinstein and Brooks 1983) and there may be mul-
tiple reasons why these fish were not observed. First, the lack
of Weakfish in the historic surveys likely represents sampling in
seagrass habitats that are not preferred. We found that Weakfish
were found at very few sites on the western shore (zone 3) or
122 SCHAFFLER ET AL.
eastern shore (zone 2), which corresponds to areas sampled in
historic surveys (Orth and Heck 1980; Weinstein and Brooks
1983), but site occupancy was generally high in zone 1. Sec-
ond, Atlantic Spadefish were not collected in historic surveys
but were found in at least 14% of all sites we sampled during
1998–1999. However, Atlantic Spadefish were not captured at
any site we sampled during 1997. Therefore, it is possible that
Atlantic Spadefish were not present during the years sampling
took place in the historical surveys. Finally, the current pres-
ence of Northern Kingfish in seagrass beds may also represents
an apparent change in species composition over time. North-
ern Kingfish were present in all geographic zones and occupied
between 7% and 33% of all sites sampled. Any of these three
reasons (unfavorable habitat, poor recruitment year, and change
in distribution) could be applied to any of these three species,
and it underscores the importance of our multiyear synoptic-
scale approach to addressing hypotheses concerning commu-
nity structure. However, these three species also were abundant
in the 2009–2011 contemporary study (Sobocinski et al. 2013)
again offering evidence of a species reversal in these seagrass
fish communities.
A valuable use for studies like ours when similar histori-
cal studies exist is for comparisons of taxa to assess commu-
nity change in response to climate change (Fodrie et al. 2010).
However, the major drawback to these comparisons is that they
will involve species that are rare and analyzing data with many
zeros presents difficulties (Pennington 1983). Our study loca-
tion, Chesapeake Bay, is ideally positioned just north of Cape
Hatteras, North Carolina. Cape Hatteras has long been recog-
nized as a faunal break (Grothues and Cowen 1999) and stock
boundary (Bowen and Avise 1990; Jones and Quattro 1999).
Therefore, the impacts of climate warming and range extension
of southerly species, as well as range contraction of northerly
species, should have the highest likelihood of detection here.
As pointed out by Fodrie et al. (2010), an increased abundance
of southerly species can be used as evidence for the effects of
climate change. Certainly Atlantic Spadefish follow this pat-
tern because Chesapeake Bay is at the northern end of their
range and they were present at a moderately high proportion
of sites and made up >1% of the total numbers of individuals
collected in this study. In the Sobocinski et al. study (2013),
Atlantic Spadefish increased further to 10.4% of the collection.
Similarly, three other species (Florida Pompano, Gray Snap-
per, and Mojarra) were also found in our study, although at
low abundances and among few sites. Although none of these
species were found in historic collections (Orth and Heck 1980;
Weinstein and Brooks, 1983), they are a part of the Chesapeake
Bay fauna. To be able to conclusively take this as evidence
of climate change, we must establish that these juveniles are
not vagrants (Sinclair 1988; Sinclair and Iles 1989) and have
either established reproducing populations or are contributing
to the spawning population. Currently, we do not have infor-
mation concerning the overwinter survival and contribution of
southerly spawned juveniles transported to Chesapeake Bay, but
we cannot discount the evidence that seems to indicate that their
presence may be increasing. It would likely require a technique
such as otolith chemistry (Schaffler et al. 2009) to definitively
answer the question of whether these juveniles are contributing
to the adult population.
ACKNOWLEDGMENTS
We greatly acknowledge the contributions of Dave Combs in
particular for providing logistical support and participating in
all aspects of this project. We also acknowledge the assistance
of Paul Gerdes and Jill Dowdy for their participation in sam-
pling efforts, as well as Jennifer Whiting and Dave Wilcox in
assisting in data review and GIS aspects of sampling. Funding
was provided by the Virginia Marine Resources Commission’s
Recreational Fishing License Fund to R.J.O., grant RF 04-04,
05, and 06, and J.J.S. was supported by grant NSF OCE 0961421
from the National Science Foundation during construction of
this manuscript. This is contribution number 3277 from the
Virginia Institute of Marine Science.
REFERENCES
Adams, S. M. 1976. The ecology of eelgrass, Zostera marina (L.), fish commu-
nities. I. Structural analysis. II. Functional analysis. Journal of Experimental
Marine Biology and Ecology 22:269–311.
Austin, J. A. 2004. Estimating effective longitudinal dispersion in Chesapeake
Bay. Estuarine, Coastal and Shelf Science 60:359–368.
Baden, S. P., and C. Bostr
¨
om. 2001. The leaf canopy of seagrass beds: faunal
community structure and function in a salinity gradient along the Swedish
coast. Ecological Comparisons of Sedimentary Shores 151:213–236.
Baden, S. P., L. O. Loo, L. Pihl, and R. Rosenberg. 1990. Effects of eutroph-
ication on benthic communities including fish: Swedish west coast. Ambio
19:113–122.
Bell, J. D., and D. A. Pollard. 1989. Ecology of fish assemblages and fisheries
associated with seagrasses. Pages 565–609 in A. W. D. Larkum, A. J. Mc-
Comb, and S. A. Shepard, editors. Biology of seagrasses: a treatise on the
biology of seagrasses with special reference to the Australian region. Elsevier,
Amsterdam.
Bloomfield, A. L., and B. M. Gillanders. 2005. Fish and invertebrate assem-
blages in seagrass, mangrove, saltmarsh, and nonvegetated habitats. Estuaries
28:63–77.
Bowen, B. W., and J. C. Avise. 1990. Genetic structure of Atlantic and Gulf
of Mexico populations of Sea Bass, menhaden, and sturgeon: influence of
zoogeographic factors and life-history patterns. Marine Biology 107:371–
381.
Chesapeake Executive Council. 1990. Submerged aquatic vegetation imple-
mentation plan. U.S. Environmental Protection Agency, Chesapeake Bay
Program, Annapolis, Maryland.
Deegan, L. A., A. Wright, S. G. Ayvazian, J. T. Finn, H. Golden, R. R. Merson,
and J. Harrison. 2002. Nitrogen loading alters seagrass ecosystem struc-
ture and support of higher trophic levels. Aquatic Conservation: Marine and
Freshwater Ecosystems 12:193–212.
Diez, J. M., C. M. D’Antonio, J. S. Dukes, E. D. Grosholz, J. D. Olden, C.
J. B. Sorte, D. M. Blumenthal, B. A. Bradley, R. Early, I. Ibanez, S. J.
Jones, J. J. Lawler, and L. P. Miller. 2012. Will extreme climatic events
facilitate biological invasions? Frontiers in Ecology and the Environment 10:
249–257.
Dorval, E., C. M. Jones, and R. Hannigan. 2005a. Chemistry of surface waters:
distinguishing fine-scale differences in sea grass habitats of Chesapeake Bay.
Limnology and Oceanography 50:1073–1083.
FISH SPECIES DISTRIBUTION IN SEAGRASS HABITATS 123
Dorval, E., C. M. Jones, R. Hannigan, and J. van Montfrans. 2005b. Can otolith
chemistry be used for identifying essential seagrass habitats for juvenile
Spotted Seatrout, Cynoscion nebulosus, in Chesapeake Bay? Marine and
Freshwater Research 56:645–653.
Dorval, E., C. M. Jones, R. Hannigan, and J. van Montfrans. 2007. Relating
otolith chemistry to surface water chemistry in a coastal plain estuary. Cana-
dian Journal of Fisheries and Aquatic Sciences 64:1–14.
Duarte, C. M., J. W. Fourqurean, D. Krause-Jensen, and B. Olesen. 2006.
Dynamics of seagrass stability and change. Pages 271–294 in A. W. D.
Larkum, R. J. Orth, and C. M. Duarte, editors. Seagrasses: biology, ecology,
and conservation. Springer, Dordrecht, The Netherlands.
Epifanio, C. E., A. I. Dittel, and R. A. Rodriguez. 2003. The role of macroalgal
beds as nursery habitat for juvenile blue crabs, Callinectes sapidus. Journal
of Shellfish Research 22:881–886.
Fodrie, F. J., K. L. Heck, S. P. Powers, W. M. Graham, and K. L. Robinson. 2010.
Climate-related, decadal-scale assemblage changes of seagrass-associated
fishes in the northern Gulf of Mexico. Global Change Biology 16:48–59.
Fox, S. E., M. Teichberg, Y. S. Olsen, L. Heffner, and I. Valiela. 2009. Restruc-
turing of benthic communities in eutropic estuaries: lower abundance of prey
leads to trophic shifts from omnivory to grazing. Marine Ecolology Progress
Series 380:43–57.
Franca, S., M. J. Costa, and H. N. Cabral. 2009. Assessing habitat specific fish
assemblages in estuaries along the Portuguese coast. Estuarine, Coastal and
Shelf Science 83:1–12.
Froeschke, J., and G. W. Stunz. 2012. Hierarchical and interactive habitat selec-
tion in response to abiotic and biotic factors: the effect of hypoxia on habitat
selection of juvenile estuarine fishes. Environmental Biology of Fishes 93:31–
41.
Gillanders, B. M. 2006. Seagrasses, fish, and fisheries. Pages 503–536 in A.
W. D. Larkum, R. J. Orth, and C. M. Duarte, editors. Seagrasses: biology,
ecology, and conservation. Springer, Dordrecht, The Netherlands.
Gray, C. A., D. Rotherham, and D. D. Johnson. 2011. Consistency of temporal
and habitat-related differences among assemblages of fish in coastal lagoons.
Estuarine, Coastal and Shelf Science 95:401–414.
Grenouillet, G., and D. Pont. 2001. Juvenile fishes in macrophyte beds: influence
of food resources, habitat structure and body size. Journal of Fish Biology
59:939–959.
Grothues, T. M., and R. K. Cowen. 1999. Larval fish assemblages and water
mass history in a major faunal transition zone. Continental Shelf Research
19:1171–1198.
Grubbs, R. D., and J. A. Musick. 2007. Spatial delineation of summer nursery
areas for juvenile Sandbar Sharks in Chesapeake Bay, Virginia. Pages 63–86
in C. T. McCandless, N. E. Kohler, and H. L. Pratt Jr. editors. Shark nursery
grounds of the Gulf of Mexico and the East Coast waters of the United States.
American Fisheries Society, Symposium 50, Bethesda, Maryland.
Hannigan, R., E. Dorval, and C. M. Jones. 2010. Rare earth element chemistry of
estuarine surface sediments in Chesapeake Bay. Chemical Geology 272:20–
30.
Hastie, T. J., and R. J. Tibshirani, 1990. Generalized additive models. Chapman
and Hall, London.
Hauxwell, J., J. Cebrian, C. Furlong, and I. Valiela. 2001. Macroalgal canopies
contribute to eelgrass (Zostera marina) decline in temperate estuarine ecosys-
tems. Ecology 82:1007–1022.
Heck, K. L., G. Hayes, and R. J. Orth. 2003. Critical evaluation of the nursery role
hypothesis for seagrass meadows. Marine Ecology Progress Series 253:123–
136.
Heck, K. L., and R. J. Orth. 2006. Predation in seagrass beds. Pages 537–550 in
A. W. D. Larkum, R. J. Orth, and C. M. Duarte, editors. Seagrasses: biology,
ecology, and conservation. Springer, Dordrecht, The Netherlands.
Heck, K. L. Jr., and T. A. Thoman. 1981. Experiments on predator-prey inter-
actions in vegetated aquatic habitats. Journal Experimental Marine Biology
and Ecology 53:125–134.
Hurst, T. P., K. A. McKown, and D. O. Conover. 2004. Interannual and long-
term variation in the nearshore fish community of the mesohaline Hudson
River estuary. Estuaries 27:659–669.
Jones, W. J., and J. M. Quattro. 1999. Genetic structure of Summer Flounder
(Paralichthys dentatus) populations north and south of Cape Hatteras. Marine
Biology 133:129–135.
Kemp, W. M., W. R. Boynton, J. E. Adolf, D. F. Boesch, W. C. Boicourt,
G. Brush, J. C. Cornwell, T. R. Fisher, P. M. Gillbert, J. D. Hagy, L. W.
Harding, E. D. Houde, D. G. Kimmel, W. D. Miller, R. I. E. Nevell,
M. R. Roman, E. M. Smith, and J. C. Stevenson. 2005. Eutrophication of
Chespaeake Bay: historical trends and ecological interactions. Marine Ecol-
ogy Progress Series 303:1–29.
Kimmel, D. G., W. D. Miller, and M. R. Roman. 2006. Regional scale climate
forcing of mesozooplankton dynamics in Chesapeake Bay. Estuaries and
Coasts 29:375–387.
Legendre, P., and L. Legendre. 1998. Numerical ecology, 2nd edition. Elsevier,
Amsterdam.
Livingston, R. J. 1982.Trophic organization of fishes in a coastal seagrass sys-
tem. Marine Ecology 7:1–12.
Livingston, R. J. 1985. Organization of fishes in coastal seagrass system: the
response to stress. Pages 367–382 in A. Yanez-Arancibia, editor. Fish com-
munity ecology in estuaries and coastal lagoons: towards an ecosystem inte-
gration. National Autonomous University of Mexico Press, Mexico City.
Love, J. W., A. K. Johnson, and E. B. May. 2006. Spatial and temporal dif-
ferences of Atlantic Menhaden (Brevoortia tyrannus) recruitment across ma-
jor drainages (1966–2004) of the Chesapeake Bay watershed. Estuaries and
Coasts 29:794–801.
Martin-Smith, K. M. 1993. Abundance of mobile epifauna: the role of habitat
complexity and predation by fishes. Journal of Experimental Marine Biology
and Ecology 17:243–260.
McGlathery, K. J., K. Sundb, and I. C. Anderson. 2007. Eutrophication in
shallow coastal bays and lagoons: the role of plants in the coastal filter.
Marine Ecology Progress Series 348:1–18.
Nagelkerken, I., G. van der Velde, W. C. E. P. Verberk, and M. Dorenbosch.
2006. Segregation along multiple resource axes in a tropical seagrass fish
community. Marine Ecology Progress Series 308:79–89.
Norkko, J., E. Bonsdorff, and A. Norkko. 2000. Drifting algal mats as an
alternative habitat for benthic invertebrates: species specific responses to a
transient resource. Journal of Experimental Marine Biology and Ecology
248:79–104.
Oesterling, M., and L. Pihl. 2001. Effects of filamentous green algal mats
on benthic macrofaunal functional feeding groups. Journal of Experimental
Marine Biology and Ecology 263:159–183.
Orth, R. J., T. J. B. Carruthers, W. C. Dennison, C. M. Duarte, J. W. Fourqurean,
K. L. Heck Jr., A. R. Hughes, G. A. Kendrick, W. J. Kenworthy, S. Olyarnik,
F. T. Short, M. Waycott, and S. L. Williams. 2006. A global crisis for seagrass
ecosystems. Bioscience 56:987–996.
Orth, R. J., and K. L. Heck. 1980. Structural components of eelgrass (Zostera
marina) meadows in lower Chesapeake Bay-fishes. Estuaries 3:278–288.
Orth, R. J., S. R. Marion, K. A. Moore, and D. J. Wilcox. 2010. Eelgrass
(Zostera marina
L.) in the Chesapeake Bay region of mid-Atlantic coast of
the USA: challenges in conservation and restoration. Estuaries and Coasts 33:
139–150.
Orth, R. J., and K. A. Moore. 1983. Chesapeake Bay: an unprecedented decline
in submerged aquatic vegetation. Science 222:51–53.
Orth, R. J., and K. A. Moore. 1988. Submerged aquatic vegetation in Chesa-
peake Bay: a barometer of bay health. Pages 619–629 in M. P. Lynch and
E. C. Krome, editors. Understanding the estuary: advances in Chesapeake
Bay research. Chesapeake Research Consortium, Publication 129, CBP/TRS
24/88, Solomons, Maryland. .
Orth, R. J., J. F. Nowak, G. F. Anderson, D. J. Wilcox, J. R. Whiting, and L. S.
Nagey. 1996. Distribution of submerged aquatic vegetation in the Chesapeake
Bay and tributaries and Chincoteague Bay—1995. U.S. Environmental Pro-
tection Agency, Chesapeake Bay Program Office, Final Report, Annapolis,
Maryland. Available: (June 2013).
Orth, R. J., J. F. Nowak, D. J. Wilcox, J. R. Whiting, and L. S. Nagey.
1997. Distribution of submerged aquatic vegetation in the Chesapeake
Bay and tributaries and Chincoteague Bay—1996. U.S. Environmental
124 SCHAFFLER ET AL.
Protection Agency, Final Report, Annapolis, Maryland. Available:
(June 2013).
Orth, R. J., J. F. Nowak, D. J. Wilcox, J. R. Whiting, and L. S. Nagey. 1998.
Distribution of submerged aquatic vegetation in the Chesapeake Bay and
tributaries and Chincoteague Bay—1997. U.S. Environmental Protection
Agency, Final Report, Annapolis, Maryland. Available: s.
edu/bio/sav/sav97. (June 2013).
Pennington, M. 1983. Efficient estimators of abundance, for fish and plankton
surveys. Biometrics 39:281–286.
Pereira, P. H. C., B. P. Ferreira, and S. M. Rezende. 2010. Community structure
of the ichthyofauna associated with seagrass beds (Halodule wrightii)in
Formoso River estuary—Pernambuco, Brazil. Anis da Academia Brasileira
de Ciencias 82:617–628.
Powers, M. J., M. J., C. H. Peterson, H. C. Summerson, and S. P. Powers. 2007.
Macroalgal growth on bivalve aquaculture netting enhances nursery habitat
for mobile invertebrates and juvenile fishes. Marine Ecology Progress Series
339:109–122.
Pyke, C. R., R. G. Najjar, M. B. Adams, D. Breitburg, M. Kemp, C. Hershner,
R. Howarth, M. Mulholland, M. Paolisso, D. Secor, K. Sellner, D. Wardrop,
and R. Wood. 2008. Climate change and the Chesapeake Bay: state-of-the-
science review and recommendations. Chesapeake Bay Program Science and
Technical Advisory Committee, Annapolis, Maryland.
R Development Core Team. 2005. R: a language and environment for statisti-
cal computing. R Foundation for Statistical Computing, Vienna. Available:
. (June 2013).
Ralph, P. J., D. Tomasko, K. Moore, S. Seddon, and C. M. O. Macinnis-Ng.
2006. Human impacts on seagrasses: eutrification, sedimentation and con-
tamination. Pages 567–593 in A. W. D. Larkum, R. J. Orth, and C. M. Duarte,
editors. Seagrasses: biology, ecology, and conservation. Springer, Dordrecht,
The Netherlands.
Schaffler, J. J., C. S. Reiss, and C. M. Jones. 2009. Spatial variation in otolith
chemistry of Atlantic Croaker larvae in the Mid-Atlantic Bight. Marine Ecol-
ogy Progress Series 382:185–195.
Sheppard, J. N., N. C. James, A. K. Whitfield, and P. D. Cowley. 2011. What role
do beds of submerged macrophytes play in structuring estuarine fish assem-
blages? Lessons from a warm-temperate South African estuary. Estuarine,
Coastal and Shelf Science 95:145–155.
Sinclair, M. 1988. Marine populations. An essay on population regulation and
speciation. University of Washington Press, Seattle.
Sinclair, M., and T. D. Iles. 1989. Population regulation and speciation in the
oceans. ICES Journal of Marine Science 45:165–175.
Smith, N. G., C. M. Jones, and J. Van Montfrans. 2008. Spatial and tempo-
ral variability of juvenile Spotted Seatrout Cynoscion nebulosus growth in
Chesapeake Bay. Journal of Fish Biology 73:597–607.
Sobocinski, K. L., R. J. Orth, M. C. Fabrizio, and R. J. Latour. 2013. Historical
comparison of fish community structure in lower Chesapeake Bay seagrass
habitats. Estuaries and Coasts 36:775–794.
Sogard, S. M., and K. W. Able. 1991. A comparison of eelgrass, sea lettuce
macroalgae, and marsh creeks as habitats for epibenthic fishes and decapods.
Estuarine, Coastal and Shelf Science 33:501–519.
ter Braak, C. J. F. 1986. Canonical correspondence analysis: a new eigenvec-
tor technique for multivariate direct gradient analysis. Ecology 67:1167–
1179.
Thayer, G. W., W. J. Kensworth, and M. S. Fonseca. 1984. The ecology of
eelgrass meadows of the Atlantic Coast: a community profile. U.S. Fish and
Wildlife Service FWS/OBS-84\02.
Tolan, J. M., S. A. Holt, and C. P. Onuf. 1997. Distribution and community
structure of ichthyoplankton in Laguna Madre seagrass meadows: potential
impact of seagrass species change. Estuaries 20:450–464.
Waycott, M., C. M. Darte, T. J. B. Carruthers, R. J. Orth, W. C. Dennison, S.
Olyarnike, A. Calladine, J. W. Fourqurean, K. L. Heck Jr., A. R. Hughes,
G. A. Kendrick, W. J. Kenworthy, F. T. Short, and S. L. Williams. 2009.
Accelerating loss of seagrass across the globe threatens coastal ecosystems.
Proceedings of the National Academy of Sciences of the USA 106:12377–
12381.
Weinstein, M. P., and H. A. Brooks. 1983. Comparative ecology of nekton resid-
ing in a tidal creek and adjacent seagrass meadow: community composition
and structure. Marine Ecology Progress Series 12:15–27.
Wingate, R. L., and D. H. Secor. 2008. Effects of winter temperature and flow
on a summer-fall nursery fish assemblage in Chesapeake Bay. Transactions
of the American Fisheries Society 137:1147–1156.
Woodland, R. J., and D. H. Secor. 2011. Differences in juvenile trophic niche
for two coastal fish species that use marine and estuarine nursery habitats.
Marine Ecology Progress Series 439:241–254.
Wyda, J. C., L. A. Deegan, J. E. Hughes, and M. J. Weaver. 2002. The response
of fishes to submerged aquatic vegetation complexity in two ecoregions of
the Mid-Atlantic Bight: Buzzards Bay and Chesapeake Bay. Estuaries 25:86–
100.