Feasibility study of removal of surface contaminants from solid surfaces using water jets with bubbles and ultrasound
Bạn đang xem bản rút gọn của tài liệu. Xem và tải ngay bản đầy đủ của tài liệu tại đây (11.6 MB, 218 trang )
FEASIBILITY STUDY OF REMOVAL OF SURFACE CONTAMINANTS
FROM SOLID SURFACES USING WATER JETS WITH BUBBLES AND
ULTRASOUND
MUHAMMAD FADZLI B HASSAN
NATIONAL UNIVERSITY OF SINGAPORE
2013
I
FEASIBILITY STUDY OF REMOVAL OF SURFACE CONTAMINANTS
FROM SOLID SURFACES USING WATER JETS WITH BUBBLES AND
ULTRASOUND
MUHAMMAD FADZLI B HASSAN
(B.ENG (HONS), NATIONAL UNIVERSITY OF SINGAPORE)
A THESIS SUBMITTED FOR
THE DEGREE OF DOCTOR OF PHILOSOPHY
DEPARTMENT OF MECHANICAL ENGINEERING
NATIONAL UNIVERSITY OF SINGAPORE
2013
II
Declaration
I hereby declare that this thesis is my original work and it has been written by me in its entirety. I
have duly acknowledged all the sources of information which have been used in the thesis.
This thesis has also not been submitted for any degree in any university previously.
_____________________________________________________
Muhammad Fadzli Bin Hassan
09 May 2013
III
This thesis incorporates content from the following publications:
Hassan, M. F., Lee, H. P., & Lim, S. P. (2010, May). The variation of ice adhesion strength with
substrate surface roughness.
Measurement Science and Technology, 21, 1-9.
Hassan, M. F., Lee, H. P., & Lim, S. P. (2012). Effects of Shear and Surface Roughness on
Reducing the Attachment of Oscillatoria sp. on Substrates. Water Environment Research. 84 (9),
744 – 752.
Hassan, M. F., Lee, H. P., & Lim, S. P. (2012). A Semi-Empirical Analysis of the Formation of
Equilibrium Bubbles from Submerged Needle Manifolds at Low to Moderate Gas Flow Rates.
Physics of Fluids. Under review; manuscript number MS #12-1056.
Hassan, M. F., Lee, H. P., & Lim, S. P. (2012). A semi-empirical analysis of the effects of needle
bore and flow rate in pneumatic retinopexy
. Eye. Under review; manuscript number EYE-12-
811.
IV
Acknowledgements
I would like to express my profound gratitude and regards for my supervisors, Associate
Professor Lee Heow Pueh and Associate Professor Lim Siak Piang for giving me this wonderful
opportunity to conduct research in the field of contaminant control using bubbles and ultrasound.
I sincerely thank them for all their guidance and advice, academic-related and otherwise, during
my time at the National University of Singapore.
I would also like to thank Associate Professor Sigurdur Thoroddsen for his guidance in t
he early
stages of my studies, Professor Khoo Boo Cheong for his valuable input on bubble dynamics as
well as the staff of the Tropical Marine Science Institute for giving me guidance on microalgae
cultivation and research as well as allowing me the use of their facilities.
My profound gratitude also goes to the National Research Foundation (Environmental Water
Technologies) scholarship board for their generous financial support without which my graduate
research work would not have been possible.
Finally,
I would like to thank my parents and my wife for their encouragement and support in
making this work possible.
V
Table of Contents
Contents V
Summary X
List of Tables XII
List of Figures XIV
List of Symbols XIX
1 Introduction
1.1 Surface foulants and contaminants 1
1.2 Objectives and scope of Work 6
2 Investigation I: Adhesion of Ice to Solid Substrates
2.1 Introduction 8
2.1.1 An introduction to surface roughness 9
2.2
Literature survey 10
2.3 Current investigation 11
2.4 Preparation of aluminium samples 17
2.5
Experimental procedure 21
2.6 Analysis 25
2.7
Computer simulations 26
VI
2.8 Discussion and limitations 29
2.9
Conclusions 31
3 Investigation II: Adhesion of Microalgae to Stainless Steel
3.1 Introduction to Oscillatoria sp. microalgae 34
3
.2 Shear stress 36
3.3 Materials and methods 37
3.4 Results and discussion 49
3.5
Conclusion 57
4
Investigation III: The Effects of Ultrasound on Microalgae
4.1 Introduction 60
4.2 Literature review 61
4.2.1
The agglomeration of microalgae by ultrasound 61
4.2.2
The mechanical vibration of microalgae by ultrasound 62
4.2.3
The lysing of microalgae by ultrasound 65
4.
2.4 Surface roughness effects on the sonication of microalgae biofilms 66
4.3 Preliminary experiment: The agglomeration of microalgae suspensions by
ultrasonic waves
67
4.3.1
Preliminary experiment: Procedure 70
4.3.2 Preliminary experiment: Results 71
4.3.3 Preliminary experiment: Laser vibrometer readings 75
4.3.4
Preliminary experiment: Pressure distribution measurement 76
VII
4.3.5 Discussion 80
4
.4 The effects of ultrasound on algae biofilms: experiment 81
4.4.1 Experimental setup and procedure 81
4.4.2
Experimental results 85
4.4.3 Visualization of water flows induced by ultrasound 89
4.4.4
Discussion 92
4.5 Conclusion 92
5
Investigation V: The Measurement of Impact and Shear Stresses of Impinging
Equilibrium Bubbles
5.1 Introduction 95
5.2 The quantification of impact and shear forces via direct measurement 96
5.3
Calibration of PVDF film 99
5
.4 Materials and methods 102
5.5
Experimental results 104
5.6
Discussion 108
5.7 Conclusion 110
6
Investigation VI: The removal of surface foulants and contaminants from an etched
surface with bubbles and ultrasound
6.1 The removal of microalgal biofilms by non-cavitating bubbles 112
6.1.1
Introduction 112
6.1.2 Literature review 113
VIII
6.1.3 Materials and methods 114
6.1.4
Experimental Results 121
6.1.4.1 Macro scale analysis 121
6.1.4.2 Micro scale analysis 122
6.1.5 The removal of microalgal biofilms by equilibrium bubbles on a large
scale over a prolonged period of time 125
6.2
The removal of microalgal biofilms by non-cavitating bubbles with ultrasound
131
6.2.1
Introduction 131
6.2.2
Theory of ultrasound on bubble dynamics 131
6.2.3
Experimental setup and conditions 134
6.2.4 Experimental results 138
6.2.5 Conclusion 140
7 Conclusion
7.1 Introduction 142
7
.2 Investigation I: Adhesion of Ice to Solid Substrates 143
7.3 Investigation II: Adhesion of Microalgae to Stainless Steel 144
7.4 Investigation III: The Effects of Ultrasound on Microalgae Suspensions and
Biofilms
145
7.5
Investigation IV: The Measurement of Impact and Shear Stresses of Impinging
Bubbles 146
7.6
Investigation V: The removal of surface contaminants from an etched surface
with bubbles and ultrasound 148
7.7
Final Remarks 150
IX
Appendix I: The Production of Bubbles from Submerged Needle Nozzles
A.1 Introduction 152
A
.2 Literature survey 153
A.3 Important bubble parameters 155
A.3.1 Capillary length, a 155
A.3.2
Bubble surface area A and characteristic diameter d
i
156
A.3.3 Bubble shapes 156
A.3.4 Characteristics of a one-dimensional bubble plume 158
A.3.5
Sauter-mean diameter, d
SM
160
A.3.6
Plume Reynolds number, Re
P
160
A
.4 Theoretical Analysis 161
A.4.1
Slow bubbles Stage I: Formation of bubble at the capillary tip 161
A.4.2 Slow bubbles Stage II: Rise and Detachment of Bubble 163
A.4.3
Fast bubbles Stage I: Formation of bubble at the capillary tip 166
A.4.4
Fast bubbles Stage II: Rise and detachment of bubble 167
A.5
Solutions of theoretical analysis 170
A.5.1
End of Stage I 170
A.5.2 End of Stage II 171
A.6
Experimental analysis 173
A.7 Experimental results 174
A.8 Conclusion 180
References
182
X
Summary
The problem of surface contaminants on solid substrates can take many forms. In the oil
industry, this problem takes the form of oil sludge on storage tank walls, which has the effect of
lowering tank volumes and clogging supply pipelines. In the water treatment and supply
industry, algae can form potentially
-toxic biofilms on reservoir walls. In temperate and sub-arctic
regions, ice accretion is a major issue for the aviation industry as it weighs down aircraft and
adversely affects the aerodynamic characteristics of aeroplanes. Even in everyday life, the
average person is concerned with biofilms of
Streptoccocus mutans, otherwise known as dental
plaque, for their propensity to create dental caries, halitosis, and even cardiovascular disease in
extreme cases.
This dissertation was inspired by a work done by Parini and Pitt (2006) on the effects of the
impingement of equilibrium bubbles on the removal of dental plaque. It was felt that a
comprehensive study on the characteristics of surface contaminant attachment and removal with
respect to bubble impingement and ultrasound had to be conducted so as to study the feasibility
of their use in industry. To do so, a wide range of investigations was carried out, including the
effects of shear and surface roughness on algae deposition on solid substrates, the effects of
ultrasound on algae biofilms, and the effects of bubble impingement on algae biofilms. The
XI
results do not support the feasibility of using either ultrasound or bubble impingement or even
both of them together for an efficient and effective removal of surface contaminants.
As the investigation was proceeding, several other sub-objectives were realized. Among these
sub-objectives was a possible method for directly measuring the impact stresses of an impinging
bubble and the characterization of the adhesion strength of accreted ice with substrate surface
roughness. A new semi-empirical method for estimating the size of bubbles formed in
submerged needle nozzles was also achieved. This achievement did not only allow for a good
degree of control of the bubble characteristics for the bubble impingement investigations, but it
also had the side application of possibly resolving an ongoing controversy in the field of
opthalmology.
XII
List of Tables
Chapter 2
2.1
Properties of aluminium 3003-H14 beams. 12
2.2 Surface roughness readings, R
a
(µm)
18
2.3 Ice thickness measurements for Specimen A. 21
2.4 Evaluated interfacial stress (MPa) 24
Chapter 3
3.1 Specifications of annular biofilm reactor 38
3.2
Shear stress with respect to rotational speed. 41
3.3 Mean surface roughness readings of the coupons 46
Chapter 4
4.1
The surface roughness readings of the five coupons. 81
Chapter 5
5.1 Average FFT, impact stress, bubble size and velocity readings for five bubbles at every
given impingement angle.
109
XIII
Chapter 6
6.1(a) The Sauter-mean diameters (and their associated standard deviations) for the six coupons
in the first set of readings. All readings in mm. 120
6.1(b) The Sauter-mean diameters (and their associated standard deviations) for the six coupons
in the second set of readings. All readings in mm 121
6.2(a) The Sauter-mean velocities (and their associated standard deviations) for the six coupons
in the first set of readings. All readings in ms
-1
. 121
6.2(b) The Sauter-mean velocities (and their associated standard deviations) for the six coupons
in the second
set of readings. All readings in ms
-
1
.
121
6.3
Biofilm thickness readings by CLSM. The initial and final readings for each coupon refer
to the average of three thickness readings on each coupon.
124
6.4 Distribution of bubble sizes for the large-scale, prolonged case 129
6.5 Parameters used in the final investigation. 134
6.6 Surface roughness readings (R
a
) for the six acrylic coupons.
136
Appendix I
A.1 The parameters that make up M. From Schladow (1993). 163
XIV
List of Figures
Chapter 1
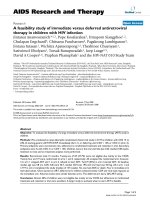
1.1 Removal of sludge via submerged jet. Adapted from Hamm et al (1989) 3
1.2
A bubble jet produced by a 2.0 bar air stream forced through a 30 G needle 6
Chapter 2
2.1 Determination of average surface roughness R
a
. All measurements in μm.
10
2.
2 Surface roughness readings, R
a
(µm) 13
2.3 The determination of the neutral axis position of a composite aluminium/ice beam 14
2.4 Schematic of the experimental setup 16
2.5
One of the aluminium beams. All dimensions are in mm 17
2.6
One sample surface roughness reading for specimen A 19
2.7
A close-up view of Specimen A 19
2.8
A close-up view of Specimen C 20
2.9
The FFT waveform when interfacial breakage occurs 22
2.10
The FFT waveform when no interfacial breakage occurs 24
2.11
The variation of interfacial stress with surface roughness 26
2.12 Finite element analysis of ice/aluminium composite beam under oscillation 27
XV
2.13 The quantitative variation of stress with frequency over one oscillatory period. 28
2.14
The role of surface tension in the ice adhesion process 29
Chapter 3
3.1 The annular biofilm reactor setup. (1) The spinning stainless steel drum in acrylic casing
(2) AC motor (3) Gearbox setup (4) Motor speed control system 37
3.2 A closeup at the rotating drum mechanism 38
3.3
Top view of the rotating cylinder (not to scale) 39
3.4
(a) - (j). Flow visualization images for different rotational speeds 42 - 43
3.5
The stainless steel coupons used 45
3.6 A closeup view of Coupon 8. 47
3.7 Algae cell count vs wall shear stress 50
3.8 (a) – (f): Average cell counts for the individual coupons. 50 - 52
3.9
Hypothetical effects of surface roughness on the sloughing-off of algae 55
3.10
Anchoring of Oscillatoria sp. algae onto roughened substrate 55
3.11
Average algae cell counts vs shear stress 57
Chapter 4
4.1 (a)-(c). The concentration of algal cells upon the application of an ultrasonic wave.
Adapted from Bosma et al (2003). 61
4.2 Setup of the ultrasound apparatus. (a) Side View (b) Top view 68
4.3
Schematic of the experimental setup 69
4.4
The setup for the sonication of the microalgae suspension 70
4.5
Algae distribution at time t = 0 s for the control experiment 71
4.6 The variation of algae distribution with time for f = 20 kHz 72
XVI
4.7 The variation of algae distribution with time for no ultrasound exposure 73
4.8
Algae distribution and displacement distribution graphs for f = 20 kHz 74
4.9 The experimental schematic used in this investigation 75
4.10 The experimental setup used for the sonication of Oscillatoria sp. biofilms. 76
4.11 The experimental schematic used in this investigation 77
4.12 (i) – (viii). Approximate pressure distribution fields in mPa for each frequency level
……………………………………………………………………………………… 78- 79
4.13 The measurement locations for the pressure field measurement 82
4.14: The experimental setup used for the sonication of Oscillatoria sp. biofilms. 84
4.15 (a)
– (d): The progression of the biofilm on Coupon 5 over ten minutes of sonication
at 20 kHz. 85 - 86
4.16 (a) – (d): The progression of the biofilm on Coupon 2 over ten minutes of sonication at
400 kHz. 87
4.17 (a) – (d): The progression of the biofilm on Coupon 3 over ten minutes of sonication at
400 kHz. 88
4.18. Flow of dye in the trough upon sonication. 89 - 91
Chapter 5
5.1 Normal (F
N
) and shear (
F
S
)
forces of an impacting bubble 100
5.2 Conventional strain gauge side-by-side with a PVDF sensor. The centerlines of both
gauges in the transverse axis coincide 102
5
.3 Strain vs Voltage readings in graphical format for the calibration readings 103
5.4 Experimental setup used in this investigation 104
5
.5 Voltage spike registered by the FFT analyzer upon bubble impingement 105
5.6 A composite glass/PVDF beam and its all-glass equivalent. 107
5.7 (a) The bubble just after formation and (b) at the point of collision 110
XVII
5.8 Discrepancy ratio vs impingement angle (in radians). A discrepancy ratio of 1 indicates
exact agreement with the theoretical value. 111
Chapter 6
6
.1 The culturing of microalgal biofilms 116
6
.2
Biofilm depth measurement using CLSM. The scale bar represents 50 μm
117
6.3 Photographical chamber used for taking photographs of algae-coated glass slides 118
6.4 Experimental setup for effects of bubbling on biofilm structure 119
6.5 The rise of the bubbles from the needle. The relatively large gaps between the bubbles
indicate that the bubbles hit the substrate singly. 122
6.6
(i)-(vi): Macro scale analysis for Coupon 1 123 - 124
6.7
The shearing-off of the exopolysaccharide layer by the impinging bubble 126
6.8
The prolonged, large scale experiment using an air stone 129
6.9 Oscillatoria sp. biofilm (a) before and (b) after exposure to extensive bubble plumes over
a period of 1 hr 130
6.10(a) A closeup view before bubbling (b) A closeup view after bubbling. The scale bar
represents 1 mm 131
6.11 The variation of surface roughness R
a
used in the current investigation. 136
6.12
The experimental setup for the sonicated bubbling of algae-coated etched coupons. 137
6.13
Set 1 for the CLSM readings for biofilm thickness. ‘Original’: readings before bubbling
and sonication, ‘Final’: readings after bubbling and sonication 139
6.14 Set 2 for the CLSM readings for biofilm thickness 139
6.15 Set 1 for the CLSM readings for biofilm thickness. 140
XVIII
Appendix I
A.1 Bubble shapes 161
A.2 Water entrainment as a result of a one-dimensional bubble plume. 163
A.3 The force balance on the spherical bubble (Stage I) 165
A.4 (a) The rise of the bubble while still attached to the needle capillary by a short air
column, and (b) the detachment of the bubble, leaving behind a small residual
hemispherical bubble 167
A.5
(a)The first possible solution for t
c
for fast bubbles. 173
A.5
(b)The second possible solution for t
c
for fast bubbles 173
A.6
The variation of bubble diameter with the volume flow rate at the end of Stage I. 174
A.7
The variation of bubble diameter with the volume flow rate at the end of Stage II 175
A.8
The relationship between minimum bubble volume (in mm
3
) and needle internal diameter
(in μm)
176
A.9 The experimental setup 177
A.10 The theoretical and experimental variations of bubble diameter vs volume flow rate. The
experimental values refer to the Sauter-mean diameter d
SM
.
179
A.11
The theoretical and experimental variations of bubble volume vs air flow rate for 25G
needles 180
A.12 The theoretical and experimental variations of bubble volume vs air flow rate for 30G
needles 180
A.13
The theoretical and experimental variations of bubble volume vs air flow rate for 21G
needles
181
A.14
An ellipsoidal bubble (bottom) and a spherical cap bubble (top) produced by the 21-
gauge needle 181
XIX
List of Symbols
While the use of a unified, streamlined list of symbols for the entire dissertation would have been
preferable, it was found to be impractical in this case due to the modular nature of this
dissertation and the large number of variables and constants that were used. A separate list of
symbols for each chapter is thus presented here.
Chapter 2
Variable/
Constant
Symbol
y
height measurement
n
d
data point for height measurement
R
a
Average surface roughness
σ
int
Interfacial stress
ω
1,
ω
2,
ω
3
Beam natural frequency
M
Mass of beam
L
Length of beam
W
Width of beam
H
Height of beam
I
Second moment of area of beam
E
ice
and E
Al
Young’s modulus (i: ice, a: aluminium)
h
ice
, h
Al
Height of section (i: ice, a: aluminium)
y
ice
, y
Al
Distance between midpoint of section and neutral axis (i: ice, a: aluminium)
z
ice
distance of the neutral axis from the bottom face of the aluminium beam
ε
int
Strain on interface
XX
Chapter 3
Variable/
Constant
Symbol
R
a
Average surface roughness
R
1
, R
2
Radius (1: inner, 2: outer)
ω
1
,
ω
2
Rotational speed (1: inner, 2: outer)
h
ann
Annular gap
L
cyl
Cylinder length
Γ
Aspect ratio
ρ
w
Density of water
θ
Angle in the polar axis
r
Radius from the center of reactor
τ
w
Wall shear stress
ν
Kinematic viscosity of water
Re
ann
Annular Reynolds number
N
Drum rotational speed
n
0
Total algae count in the reactor
n
1
Haemocytometer cell count
n
2
Algae count on one coupon
m
a
Mass of one algae cell
F
cent
Centrifugal force on algae cell
τ
cent
Centrifugal stress on algae cell
δ
Boundary layer thickness
v
f
Fluid velocity
Chapter 4
Variable/
Constant
Symbol
f
1
,
f
2
,
f
r
Natural frequency of vibration
(f
1
: algae strand on a solid substrate, f
2
: gas vacuole, f
r
: rough substrate )
a
l
Characteristic length of the algae strand
γ
Specific heat ratio of air
P
0
atmospheric pressure
r
0
radius of the gas vacuole
ρ
w
density of water
r
s
Characteristic substrate roughness parameter
V
voltage response for a given frequency
I
u
Ultrasonic power output per unit area
A
u
Hydrophone sensor area
P
u
Ultrasonic power output
F
u
Force of ultrasound on area of sonication
c
u
Ultrasonic wave velocity
XXI
T
Ambient temperature
P
a
Ultrasonic pressure on hydrophone
Chapter 5
Variable/
Constant
Symbol
t
c
Impact time
ρ
a
,
ρ
w
fluid density (
ρ
a
: air,
ρ
w
: water)
D
b
diameter of the bubble
σ
w
surface tension coefficient of water
v
b
final velocity of bubble
u
b
Approach velocity of bubble
a
b
Acceleration/deceleration of bubble
θi
Angle of impingement
F
1
Upward force of the rising force
F
N
Normal impingement force
F
S
Shear impingement forces
A
b
Bubble cross-sectional diameter
ε
Measured induced strain
σ
Measured stress
E
PVDF
, E
GLASS
Young’s modulus of material under stress.
E
PVDF
: for PVDF, E
GLASS
: for glass
F
P
Pressure force
F
H
History force
P
lap
Pressure term from Laplace equation
Chapter 6
Variable/
Constant
Symbol
ω
0
undamped natural frequency
ω
d
damped natural frequency
P
0
Atmospheric pressure
γ
Specific heat ratio of air
σ
interfacial tension
r
0
Radius of bubble
ρ
w
Density of water
g
gravitational acceleration
D
g
thermal diffusivity of gas
c
f
speed of sound in water
c
a
speed of sound in air
μ
f
shear viscosity of water
G
th
thermal damping constant
XXII
Appendix I
Variable/
Constant
Symbol
a
Capillary length
A
Bubble surface area
d
i
, d
x
, d
z
, d
SM
bubble diameter (i: characteristic, x: horizontal, z: vertical, SM: Sauter-mean)
E
OB
Eotvos number
Re
p
, Re
B
Reynolds number (b: bubble, p: plume)
M
Bubble plume parameter
α
entrainment coefficient
λ
dispersion constant
P
a
atmospheric pressure
h
water depth of needle source
h
a
equivalent water head of atmospheric pressure
ρ
r
density of water
Q
0
volumetric gas flow rate
H
total head at base of container
u
s
slip velocity
u
B
velocity scale
g
acceleration due to gravity
μ
Dynamic viscosity
F
B
buoyancy force on the bubble
W
B
bubble weight
F
S
surface tension between the bubble and the needle point
F
D
hydrodynamic drag
v
e
outward velocity of the bubble surface as it is being inflated
r
s
instantaneous radius of the bubble
V
s
instantaneous bubble volume
J, K
Grouped terms
v
c
, v
h
bubble velocity (c: rise velocity, h: velocity of remaining hemisphere)
t
c
elapsed time between the end of Stage I and final detachment of the bubble
C
D
drag coefficients
V
F
final bubble volume
Introduction
CHAPTER 1
1
Chapter 1
Introduction
1.1 Surface
Foulings and Contaminants
Surface foulings and contaminants are ubiquitous in everyday life. They take the form of a full
range of chemical and biological agents, depending on the context in which the
contaminants are
found. For instance, an oil rig in the middle of the sub-Arctic tundra may consider ice to be a
contaminant for its propensity for sticking to exposed oil rig surfaces. Likewise, a water
treatment plant may consider microalgae to be a contaminant for its propensity to stick to walls
of treatment tanks and pipes.
Introduction
CHAPTER 1
2
Periodically these contaminants have to be removed in order to ensure the continued smooth
operation of machinery and equipment. Severe ice accretion on helicopter blades, for inst
ance,
may impede the ability of the aircraft to take off and land properly. The presence of microalgae
on the walls of water treatment tanks can poison the water supply, clog supply pipes, and reduce
overall storage capacity of the tanks (Heath et al. 2004
).
Conventionally the removal of these
fouls and contaminants involves the use of manual or
robotic labour to physically shovel the contaminants out. While such methods are simple, they
are not without their drawbacks. Surface contaminant removal by hand is both an unpleasant and
potentially hazardous task due to the presence of poisonous compounds. For example,
petrochemical sludge may contain toxic compounds such as hydrogen sulfide and benzene.
While robotic removal might be safer, the high operating and maintenance costs of a cleaning
robot limit its use to extremely hazardous environments where no human can safely work in
(Heath et al.
2004).
More advanced measures involve the use of a liquid jet to erode the contaminants away so that
the jet liquid mix
ture can be easily pumped out of the tank. There has been research into the use
of a submerged fluid jet to erode away accumulated petrochemical sludge. This erosion does not
occur through the mechanical action of the jet directly striking the sludge itself. Rather, it is due
to the formation of recirculation zones at the interface between the jet and the sludge as the jet
passes over the sludge gradually erodes away the sludge (Figure 1.1) (Hamm et al. 1989).