A PROSPECTIVE STUDY ON DETECTION, SUBTYPE ANALYSIS, CHARACTERIZATION, MOLECULAR EPIDEMIOLOGY AND TRANSMISSION OF INFLUENZA VIRUSES AMONG UNIVERSITY STUDENTS AND STAFF IN SINGAPORE
Bạn đang xem bản rút gọn của tài liệu. Xem và tải ngay bản đầy đủ của tài liệu tại đây (5.31 MB, 251 trang )
A PROSPECTIVE STUDY ON DETECTION, SUBTYPE ANALYSIS,
CHARACTERIZATION, MOLECULAR EPIDEMIOLOGY AND
TRANSMISSION OF INFLUENZA VIRUSES AMONG
UNIVERSITY STUDENTS AND STAFF IN
SINGAPORE
RAMANDEEP KAUR VIRK
(M.D. Microbiology, India)
A THESIS SUBMITTED
FOR THE DEGREE OF DOCTOR OF PHILOSOPHY (PH. D.)
DEPARTMENT OF MEDICINE
NATIONAL UNIVERSITY OF SINGAPORE
2015
I
II
ACKNOWLEDGEMENTS
I would like to take this opportunity to express my earnest gratitude to the
following who have kindly contributed in making this thesis work possible:
Foremost, my supervisor and my mentor, Prof Paul Anantharajah Tambyah
(NUS, NUHS) for believing in me, providing me the opportunity to learn
under his esteemed supervision, providing help with funds for conducting the
research work, critically reviewing my thesis and for being a pillar of support.
Next, my co-supervisor, Dr. Boon Huan Tan (DSO, NUS) for providing me a
nourishing laboratory environment, critically reviewing my thesis and for
providing immense encouragement and support.
Besides my supervisor and my co-supervisor, rest of my Thesis Advisory
Committee members: A/Prof Tan Yee Joo (NUS) and Prof Richard Surgue
(NTU) for keeping an oversight over the research work and for providing
valuable comments and advices.
Dr. Anupama Vasudevan (NUH) for moral support and help with statistics;
Dr. Vithiagaran Gunalan (ASTAR) & Prof Gavin Smith (Duke-NUS) for
providing research ideas; Dr. Hong Kai Lee (NUS) for help with
phylogeographic anlaysis; Dr Catherine Chua (NUS) & Masafumi Inoue
(ASTAR) for their association with my work; Senthmarai Chelvi for help with
data collection; Dr. Aidan Lyanzhiang (NUH) for help with statistics;
Elizabeth Ai-Sim Lim, Ka-Wei Chan, Pei Jun (DSO) & Lim Toh Pern
(ASTAR) for helping me in conducting the experiments.
My loving family: my mother Gurmeet Kaur, my husband Devinder Singh,
my sister Antar Puneet Virk and my kids Arshia & Ranbir. This work would
not have been possible without their help and sacrifices.
All the students and staff from NUS who participated in this study and NUS
for providing research scholarship and the opportunity to be associated with it.
And finally, GOD for all his blessings!
III
TABLE OF CONTENTS
CONTENTS
Page
Declaration page
I
Acknowledgements
II
Table of contents
III
Publications, presentations, awards
VII
Summary
VIII
List of tables
XI
List of figures
XIV
List of abbreviations
XIX
Chapter 1- Introduction
1.1 Influenza infection
1.2 Influenza virology
1.3 Influenza proteins
1.3.1 Polymerase proteins
1.3.1.1 PB-2
1.3.1.2 PB1, PB1-F2
1.3.1.3 PA
1.3.2 HA
1.3.3 NP
1.3.4 NA
1.3.5 M1, M2
1.3.6 NS1, NS2
1.4 Epidemiology of influenza
1.4.1 Seasonal influenza
1.4.2 Pandemic influenza
1.5 Influenza diagnostics
1.6 Prevention and Treatment
1.6.1 Prevention
1.6.2 Treatment
1.7 Drug resistance
1.8 Influenza in Singapore
1.9 Purpose of Research
Chapter 2- Materials and Methods
2.1 Study population and Data collection
2.2 Laboratory methods
2.2.1 Isolation of influenza viruses in Eggs
2.2.1.1 Checking the status of the eggs
2.2.1.2 Inoculating eggs with clinical
Specimen
2.2.1.3 Harvesting inoculated eggs
1
1
1
3
3
3
4
4
5
6
7
7
7
9
9
9
12
13
13
14
15
16
19
24
24
25
25
25
25
25
IV
2.2.2 Tissue Culture and Infection
2.2.2.1 Propagation and Maintenance of
MDCK cells
2.2.2.2 Plate centrifugation assay
2.2.2.3 Immunofluorescent staining
2.2.3 Molecular Techniques
2.2.3.1 RNA/Total nucleic acids extraction
2.2.3.2 Multiplex end-point RT-PCR and
pyrosequencing for detection of
Influenza A and B viruses
2.2.3.3 Five-plex Real-Time TaqMan PCR for
influenza A and B virus detection
2.2.3.4 Multiplex RT-PCR protocol for the
detection of Adenovirus and Bocavirus
2.2.3.5 Singleplex RT-PCR protocol for
influenza A virus detection
2.2.3.6 Multiplex RT-PCR protocol for
Coronavirus and human
metapneumovirus detection
2.2.3.7 Multiplex RT-PCR protocol for
Rhinovirus detection
2.2.3.8 Multiplex RT-PCR protocol for the
Parainfluenza virus detection
2.2.3.9 Multiplex RT-PCR protocol for
Enterovirus detection
2.2.3.10 Multiplex RT-PCR protocol for
Respiratory Syncytial
Virus A and B detection
2.2.3.11 Reverse Transcription (RT) for
sequencing of Influenza A virus HA
and NA gene segments
2.2.3.12 Polymerase Chain Reaction (PCR) for
sequencing of Influenza A virus
2.2.3.13 Sequencing of Influenza A virus
internal genes
2.2.3.14 DNA separation by Agarose Gel
Electrophoresis
2.2.3.15 Sequencing Reaction Preparation
Chapter 3- Viral etiology of ILI on NUS campus (2007-09)
3.1 Background
3.2 Materials and Methods
3.2.1 Laboratory methods
3.2.2 Statistical Analyses
3.3 Results
3.4 Discussion
3.5 Conclusions
Chapter 4- Clinical Characteristics of study population
4.1 Background
4.2 Materials and Methods
4.2.1 Laboratory methods
4.2.2 Statistical Analyses
26
26
27
27
28
28
28
29
29
30
31
32
33
34
35
35
36
38
38
38
39
39
41
41
41
41
48
53
54
54
55
55
55
V
4.3 Results
4.4 Discussion
4.5 Conclusions
Chapter 5- Comparison of Molecular methods and culture methods
5.1 Background
5.2 Materials and Methods
5.2.1 Laboratory methods
5.2.2 Determination of influenza A virus infection
5.2.3 Statistical Analyses
5.3 Results
5.4 Discussion
5.5 Conclusions
Chapter 6- Genetic and Antigenic characterization of full genome of
seasonal and pandemic 2009 influenza viruses circulating on campus
6.1 Background
6.2 Materials and Methods
6.2.1 Sample selection
6.2.2 Laboratory methods
6.2.3 Phylogenetic Analysis
6.2.4 Determination of closest vaccine reference
6.2.5 Determination of lineage
6.2.6 Detection of aa variations in epitopes of HA1
6.2.7 Structural modelling
6.3 Results
6.3.1 Seasonal H3N2 viruses
6.3.1.1 HA and NA diversity
6.3.1.2 Diversity of internal genes
6.3.2 Seasonal H1N1 viruses
6.3.2.1 HA and NA diversity
6.3.2.2 Diversity of internal genes
6.3.3 Pandemic H1N1/09 viruses
6.3.3.1 HA and NA diversity
6.3.3.2 Diversity of internal genes
6.4 Discussion
6.5 Conclusions
Chapter 7- Prediction of N-linked glycosylation sites on the
glycoproteins HA and NA of influenza A viruses
7.1 Background
7.2 Materials and Methods
7.2.1 Deduced protein sequences
7.2.2 Prediction of N-linked glycosylation sites
7.3 Results
7.3.1 Glycosylation patterns in sH1N1 viruses
7.3.2 Glycosylation patterns in H3N2 viruses
7.3.3 Glycosylation patterns in pH1N1/09 viruses
7.4 Discussion
7.5 Conclusions
Chapter 8- Characterization of Drug Resistance
8.1 Background
8.2 Materials and Methods
56
62
68
70
70
71
71
72
72
72
78
81
82
82
84
84
84
84
85
85
88
89
90
90
90
101
104
104
111
115
115
122
123
130
131
131
133
133
134
134
134
135
137
138
141
142
142
144
VI
8.3 Results
8.3.1 Characterization of drug resistance in H3N2
viruses
8.3.2 Characterization of drug resistance in sH1N1
viruses
8.3.3 Characterization of drug resistance in
pH1N1/09 viruses
8.4 Discussion
8.4.1 H3N2 viruses
8.4.2 sH1N1 viruses
8.4.3 pH1N1/09 viruses
8.5 Conclusions
Chapter 9- Molecular epidemiology & Transmission of influenza
9.1 Background
9.2 Materials and Methods
9.2.1 Part A
9.2.2 Part B
9.2.2.1 Phylogenetic analysis
9.2.2.2 Phylogeographic analysis
9.3 Results
9.3.1 Part A
9.3.2 Part B
9.4 Discussion
9.5 Conclusions
Chapter 10- Conclusions and future work
10.1 Viral etiology of ILI on NUS campus 2007-09
10.2 Clinical characteristics of study population
10.3 Comparison between PCR and culture to detect influenza
10.4 Genetic characterization of influenza viruses circulating
on campus
10.5 Prediction of glycosylation sites
10.6 Drug Resistance monitoring
10.7 Molecular epidemiology of influenza
10.8 Overall conclusions
Bibliography
Appendices
146
146
148
149
149
150
152
153
154
155
155
157
157
158
158
158
160
160
163
167
169
170
170
171
171
172
172
173
174
175
176
210
VII
PUBLICATIONS, PRESENTATIONS, AWARDS
1) Published manuscript: Virk RK, Tambyah PA, Tan BH et al. (2014)
Prospective Surveillance and Molecular Characterization of Seasonal
Influenza in a University Cohort in Singapore. PLoS ONE 9(2):
e88345. doi:10.1371/journal.pone.008834- appended in Appendix II
2) Published manuscript: Tan AL, Virk RK, Tambyah PA, Inoue M, Lim
EA-S, Chan K-W, et al. (2015) Surveillance and Clinical
Characterization of Influenza in a University Cohort in Singapore.
PLoS ONE 10(3): e0119485. doi:10.1371/journal.pone.0119485-
appended in Appendix II
3) Poster presentation: Phylogeography of influenza transmission on a
tropical university campus, Courage fund Infectious Disease
Conference 2015, Singapore.
4) Poster presentation: Molecular Evidence of Transmission of Influenza
on a University Campus in Singapore, Third isirv-AVG Conference
Influenza and Other Respiratory Virus Infections: Advances in Clinical
Management, (ISIRV 2014) Tokyo, Japan- Cited in the article: Hurt et
al. (2015) Overview of the 3
rd
isirv- Antiviral Group Conference-
advances in clinical management 9(1), 20-31.
5) Poster presentation: Genetic Characterization of Influenza
A(H1N1)pdm09 viruses in a University Cohort in Singapore, Yong
Loo Lin School of Medicine Scientific congress, (YLLSOM 2014),
Singapore.
6) Poster presentation: Molecular methods are critical in sentinel
surveillance of influenza: Results from a prospective study of 352
students and staff with influenza-like illness, International Symposium
on Antimicrobial Agents and Resistance (ISAAR 2009), Malaysia-
Received best poster award
7) Award: Yeoh Seang Aun Graduate Prize in Tuberculosis and Infectious
diseases, Annual Graduate Scientific Congress, (AGSC 2015),
Singapore.
VIII
SUMMARY
Educational institutions have been suspected of being foci for transmission
of influenza. University population provides an advantage to study local
epidemiology of influenza as well as imported cases, as university students
have a good mix of both local and overseas students. Viral etiology of
influenza-like illness (ILI) has been determined previously in military
populations or hospitalized patients with not many studies in university
cohorts. A prospective surveillance study was conducted at the University
health and wellness centre (UHC), National University of Singapore (NUS), to
characterize influenza viruses circulating on campus from 2007-09 with initial
phase of the influenza A/H1N1 2009 pandemic (pH1N1/09) being captured.
Nasopharyngeal swabs, clinical information and demographic data were
collected from 510 students and staff presenting to UHC with ILIs. Influenza
virus (32.8%; that comes form 18% in 2007, 24% in 2008 and 59% in 2009)
was identified as the main causative agent followed closely by adenovirus
(32.4%), rhinovirus (10.6%), enterovirus (7%), coronavirus (3.4%),
parainfluenza virus (1.4%), respiratory syncytial virus (1.4%) and human
metapneumovirus (1%).
Of the seven symptoms elicited, five had significant association with
laboratory-confirmed influenza: fever (OR 2.36, 95%CI 1.74-3.20), cough
(OR 1.43, 95%CI 1.10-1.84), chills (OR 1.51, 95%CI 1.18-1.94), running nose
(OR 1.33, 95%CI 1.02-1.73) and aches (OR 1.61, 95%CI 1.24-2.09). Fever
(p<0.0001), chills (p<0.0001), aches (p<0.0002), running nose (p<0.0009) and
cough (p<0.0062) were predictive of influenza. Pandemic H1N1 had fever as
IX
the most common presentation and H3N2 infections were the most
symptomatic of all influenza subtypes.
PCR was found to be superior to culture in detecting both seasonal and
pandemic 2009 influenza A virus. Additionally, an inverse relationship
between cycle threshold (ct) value and successful viral isolation was found in
case of pandemic H1N1 2009 viruses.
Genetic characterization using molecular sequencing data found that the
seasonal IAVs were genetically diverse from the contemporary vaccine strain
for the same season but matched well with the vaccine strain of upcoming
influenza season. No neuraminidase inhibitor resistance was detected but a
very high level of adamantane resistance was detected (98%).
Molecular epidemiological analysis based on hemagglutinin gene
sequences identified residence at hostel (OR 4.2, 95%CI 1.2-14.9, p<0.05) as a
potential risk factor for contracting any influenza A subtype seasonal or
pandemic. Phylogenetic analysis conducted on concatenated whole genomes
of pH1N1/09 viruses showed 5 well-supported clusters of highly-similar
sequences with the majority from students staying on-campus suggesting intra-
campus transmission. Phylogeographic analysis provided a stronger evidence
of geographical clustering based on faculty, Life-Sciences versus Non-life
Sciences (AI P=0.02; PS P=0.05); residence, on-campus versus off-campus
(AI P=0.009; PS P=0.04). This phylogeographic analysis was clearer than the
conventional epidemiologic analysis which only identified residence on-
campus (OR 1.517, 95%CI 1.037-2.217) as a significant risk factor for
laboratory-confirmed pandemic H1N1 2009 infection. Integration of
X
molecular, epidemiological and statistical methods for influenza surveillance
can guide public authorities to identify foci of transmission in localized
communities. Targeted intervention strategies including possibly closures of
the university or campus-based quarantine may be implemented in cases of
impending pandemics if there is sufficient evidence of intra-campus
transmission.
XI
LIST OF TABLES
Table No.
Description
Page
Table 1.1
Influenza A virus RNA segments and proteins encoded
2
Table 1.2
Important determinants of influenza virus pathogenicity
8
Table 1.3
The Origin of Swine Influenza Virus Segments
11
Table 1.4
Summary of characteristics of pandemics of 20
th
and 21
st
century
11
Table 1.5
Influenza Virus Testing Methods (CDC)
12
Table 1.6
Anti-influenza drugs and their mechanism of Action
15
Table 1.7
Mortality data for Singapore for past influenza Pandemics
17
Table 1.8
Literature review of influenza research in Singapore (2010-
13)
18
Table 1.9
Literature review of influenza research in university cohort
20
Table 2.1
Primer and Probe sequences for Influenza A virus
29
Table 2.2
Primer and Probe sequences for Adenovirus and Bocavirus
30
Table 2.3
Primer and Probe sequences for Coronavirus and human
metapneumovirus
31
Table 2.4
Primer and Probe sequences for Parainfluenza virus
32
Table 2.5
Primer and Probe sequences for Rhinovirus
33
Table 2.6
Primer and Probe sequences for Enterovirus
34
Table 2.7
Primer and Probe sequences for Respiratory Syncytial virus
A and B
35
Table 2.8
List of primers for sequencing of surface genes of influenza
A virus
37
Table 3.1
Demographic characteristics of study population
42
Table 3.2
Viral etiology of ILI on NUS campus (2007-09)
43
Table 3.3
Absolute numbers of viral co-infections
44
Table 3.4
Number (%) of Subjects positive for Influenza virus infection
47
XII
Table 4.1
Symptom distribution in subjects and Odds ratios with
Predictive values
56
Table 4.2
Laboratory confirmed influenza positivity according to
population characteristics
58
Table 4.3
Clinical characteristics: Influenza negative vs positive cases
59
Table 4.4
Demographic characteristics: Influenza negative vs positive
cases
60
Table 4.5
Comparison of clinical characteristics across influenza types
and subtypes
61
Table 4.6
Summary of studies describing clinical characteristics of
pH1N1/09 influenza
65
Table 4.7
Summary of studies comparing clinical characteristics:
Pandemic vs Seasonal influenza
66
Table 5.1
Number (%) of samples positive for influenza A virus
infection detected employing RT-PCR and viral isolation
methods during the surveillance period (May 2007-
September 2009)
73
Table 5.2
Sensitivity of molecular and viral isolation methods for
detection of influenza A virus infection during the period of
surveillance and the methods employed
77
Table 5.3
Comparison of sensitivity of conventional viral isolation and
plate centrifugation assay
77
Table 5.4
Association between ct value and successful viral isolation
for pH1N1/09 viruses
78
Table 6.1
Clade-specific amino acid changes in HA of H3N2 viruses
(WHO 2008)
85
Table 6.2
Clade-specific amino acid changes in NA of H3N2 viruses
(WHO 2008)
86
Table 6.3
Clade-specific amino acid changes in HA of sH1N1 viruses
(WHO 2008)
86
Table 6.4
Clade-specific amino acid changes in NA of sH1N1 viruses
(WHO 2008)
87
Table 6.5
Cluster-specific changes in six gene segments of pH1N1/09
virus (Fereidouni et al. 2009)
87
Table 6.6
List of amino acid residues (n=131) distributed in epitopes A,
B, C, D, and E of Hemagglutinin 1 of H3N2 viruses (Adapted
from Lee and & Chen 2004)
88
XIII
Table 6.7
List of amino acid residues distributed in antigenic sites Sa,
Sb, Ca1, Ca2 and Cb of Hemagglutinin 1 of H1N1 viruses
(Adapted from Igarashi et al. 2010)
89
Table 6.8
Structural templates and target references used for structural
modelling
90
Table 6.9
Percentage amino acid identity and mutations observed in
HA of H3N2 viruses compared to closest WHO vaccine
reference
96
Table 6.10
Percentage amino acid identity and mutations observed in
NA of H3N2 viruses compared to closest WHO vaccine
reference
96
Table 6.11
List of amino acid residues changes distributed in epitopes A,
B, C, D, and E of hemagglutinin 1 (HA1) surface protein of
H3N2 viruses isolated in this study compared to WHO
vaccine strains
97
Table 6.12
Percentage amino acid identity and mutations observed in
MP of H3N2 viruses compared to closest WHO vaccine
reference
101
Table 6.13
Percentage amino acid identity and mutations observed in
HA of sH1N1 viruses compared to closest WHO vaccine
reference
106
Table 6.14
Percentage amino acid identity and mutations observed in
NA of sH1N1 viruses compared to closest WHO vaccine
reference
107
Table 6.15
Percentage amino acid identity and mutations observed in
MP of sH1N1 viruses compared to closest WHO vaccine
reference
113
Table 6.16
Mutations in HA relative to vaccine strain
A/California/7/2009
116
Table 7.1
Potential glycosylation sites predicted in HA protein of H3N2
viruses isolated from Singapore in 2007
130
Table 8.1
Differential susceptibility of various influenza subtypes to
Neuraminidase inhibitors
145
Table 9.1
Association of epidemiological factors with transmission of
influenza
160
Table 9.2
Results of phylogeny trait association for pandemic 2009
viruses detected on NUS campus during early pandemic
phase
165
XIV
LIST OF FIGURES
Figure No.
Description
Page
Figure 1-1
Schematic representation of influenza virus segments and
proteins. The Non-structural (NS) proteins and newly
discovered proteins are shown in rectangles.
2
Figure 1-2
Schematic representation of Ribonucleoprotein complex
(RNP). RNP is composed of four viral proteins (PB- 2,
PB-1, PA, NP) and viral RNA.
3
Figure 1-3
X-Ray crystallographic structure of HA protein monomer
of the 1918 H1N1 virus. The HA protein possesses two
domains: globular head and stem. Receptor binding site
and antigenic sites are located on globular head and
cleavage site is located in the stem region.
6
Figure 1-4
Reassortment and adaptation events of pandemic
Influenza A viruses Reassortment events in origin of
pandemic 2009 virus
10
Figure 1-5
Influenza surveillance data from Singapore
17
Figure 3-1
Viral etiology of ILIs detected on NUS campus from
2007-2009
43
Figure 3-2
Bar chart representing total number of samples obtained
and number of samples positive for influenza A
45
Figure 3-3
Pie chart showing percentages of influenza A subtypes
detected on campus from 2007-09 (top) and influenza
subtypes detected in 2007, 2008 and 2009 (bottom). ND
represents non-determined subtypes
46
Figure 3-4
Epidemiological curve showing distribution of total
influenza, influenza types and subtypes during the overall
study period from May 2007-September 2009. IAV
stands for influenza A virus and IBV for influenza B
virus. ND are not-determined influenza subtypes.
48
Figure 4-1
Frequency (%) of occurrence of various clinical
symptoms across seasonal and pH1N1/09 flu
62
Figure 5-1
Epidemiological curve showing influenza cases positive
by RT-PCR and viral isolation methods
73
Figure 5-2
Frequency of influenza A subtypes during the study
period detected using reverse-transcription polymerase
chain reaction (RT-PCR)
74
XV
Figure 6-1
Neighbor-Joining trees of Hemagglutinin (HA) and
Neuraminidase (NA) gene segments of 10 H3N2 strains
detected in 2007 in a Singapore university
campus(green), WHO vaccine(red) and reference
strains(black) from 2003-09. Boot strap values 60 and
over are shown. Analyses were conducted in MEGA 6.
Clade-specific amino acid (aa) changes are shown at the
branches. The bar the bottom represents aa substitutions
per site.
91
Figure 6-2
Neighbor-Joining trees of Hemagglutinin (HA) gene of
10 H3N2 strains detected in 2007 in a Singapore
university campus(green), WHO vaccine(red) strains
from 2003-09 with representative (A) USA strains(black);
(B) global strains(black) from the same time period in
2007. Boot strap values 60 and over are shown. Analyses
were conducted in MEGA 6. The bar the bottom
represents aa substitutions per site.
93
Figure 6-3
Neighbor-Joining tree of Hemagglutinin (HA) of 10
H3N2 strains detected in 2007 in a Singapore university
campus (green), WHO vaccine (red) strains from 2003-
09, 20 strains from Vietnam (black) from the same time
period in 2007 and top 10 blast hits of
A/Singapore/139N/2007 (black). The strain 139N is
shown in grey box. Boot strap values 60 and over are
shown. Analysis was conducted in MEGA 6. The bar at
the bottom represents amino acid substitutions per site.
The strain name is followed by month and date of
isolation.
95
Figure 6-4
Best-scoring models representative of the H3N2 HA
trimer (above) and monomer(below) were generated
using the MODELLER program using the A/Hong
Kong/4443/2005 HA (PDB ID: 2YP7) as a structural
template and A/Wisconsin/67/2005 as a target reference.
Mutations relative to this reference strain were
highlighted in YASARA, either in orange, red or green
for different HA monomers. Residue numbering follows
HA protein numbering.
99
Figure 6-5
Best-scoring models representative of the H3N2 NA
dimer(above) and monomer(below) were generated using
the MODELLER program using the
A/Tanzania/205/2010 NA (PDB ID: 4GZO) as a
structural template and A/Wisconsin/67/2005 as a target
reference. Mutations relative to this reference strain were
highlighted in YASARA in orange or green for different
NA monomers. Residue numbering follows N2 protein
numbering. Strain 139N had only one mutation relative to
Wisconsin while the rest 9/10 strains had the aa changes
shown in the figure.
100
XVI
Figure 6-6
Neighbor-Joining trees of Matrix (M), Non-structural,
(NS), Nucleoprotein (NP), Polymerase Basic-2 (PB-2),
Polymerase acidic (PA), and Polymerase Basic-1(PB-1)
gene segments of 10 sH1N1 strains detected in 2007 in a
Singapore university campus(green), WHO vaccine(red)
and reference strains(black) from 2000-09. Boot strap
values 60 and over are shown. Analyses were conducted
in MEGA 6. The bar at the bottom represents amino acid
substitutions per site.
102
Figure 6-7
Neighbor-Joining trees of Hemagglutinin (HA) and
Neuraminidase (NA) gene segments of 10 seasonal
H1N1(sH1N1) strains detected in 2007 in a Singapore
university campus(green), WHO vaccine(red) and
reference strains(black) from 2000-09. Boot strap values
60 and over are shown. Analyses were conducted in
MEGA 6. Clade-specific amino acid (aa) changes are
shown at the branches. The bar the bottom represents aa
substitutions per site.
105
Figure 6-8
Neighbor-Joining tree of Hemagglutinin (HA) of 10
seasonal H1N1 strains detected in 2007 in a Singapore
university campus(green), WHO vaccine and reference
strains(red) from 2000-2009 and representative global
strains from the same time period in 2007(black). Boot
strap values 60 and over are shown. Analysis was
conducted in MEGA6. The bar at the bottom represents
number of amino acid substitution per site.
108
Figure 6-9
Best-scoring models representative of the seasonal HA of
H1N1 trimer (above) and monomer (below) were
generated using the MODELLER program using the
A/Thailand/CU44/2006 HA (PDB ID: 4EDB) as a
structural template and A/New Caledonia/20/1999 as a
target reference. Mutations relative to this reference strain
were highlighted in YASARA, either in red, magenta or
green for different HA monomers. Residue numbering
follows HA protein numbering.
109
Figure 6-10
Best-scoring models representative of the seasonal H1N1
NA dimer (above) and monomer(below) were generated
using the MODELLER program using the A/Brevig
Mission/1/1918 NA (PDB ID: 3BEQ) as a structural
template and A/New Caledonia/20/1999 as a target
reference. Mutations relative to this reference strain were
highlighted in YASARA in yellow. Residue numbering
follows N1 numbering.
110
Figure 6-11
Neighbor-Joining trees of Matrix (M), Non-structural,
(NS), Nucleoprotein (NP), Polymerase Basic-2 (PB-2),
Polymerase acidic (PA) and Polymerase Basic-1(PB-1)
gene segments of 10 sH1N1 strains detected in 2007 in a
Singapore university campus(green), WHO vaccine(red)
112
XVII
and reference strains(black) from 2000-09. Boot strap
values 60 and over are shown. Analyses were conducted
in MEGA 6. The bar at the bottom represents amino acid
substitutions per site.
Figure 6-12
Neighbor-Joining tree of 40 Hemagglutinin (HA) and 35
Neuraminidase (NA) gene segments of pH1N1/09 strains
detected in 2009 in a Singapore university campus
(black), WHO vaccine and closest reference strain for
2009(red). Boot strap values 60 and over are shown.
Analyses were conducted in MEGA 6. Common
mutations are shown at the branches and sporadic
mutations are shown at the end of the strain name. The
bar at the bottom represents amino acid substitutions per
site.
117
Figure 6-13
Neighbor-Joining tree of Hemagglutinin (HA) of
pH1N1/09 strains (in red are on-campus and in green are
off-campus strains) detected in 2009 (July & August) on
a Singapore university campus and community strains (in
black). Boot strap values 60 and over are shown. Analysis
was conducted in MEGA 6. The bar at the bottom
represents number of amino acid substitution per site.
118
Figure 6-14
Best-scoring model representative of the H1N1pdm09
HA trimer was generated using the MODELLER
program using the A/California/04/2009 HA (PDB ID:
3LZG) as a structural template and A/California/07/2009
as a target reference. Mutations relative to this reference
strain were highlighted in YASARA, either in orange, red
or green for different HA monomers. Residue numbering
follows HA protein numbering.
119
Figure 6-15
Neighbor-Joining trees of 38 Matrix (M), 34 Non-
structural (NS) and 34 Nucleoprotein (NP) gene segments
of pH11/09 strains detected in 2009 in a Singapore
university campus(black) and WHO vaccine and closest
reference strains for 2009(red). Boot strap values 60 and
over are shown. Analyses were conducted in MEGA 6.
The bar at the bottom represents amino acid substitutions
per site.
120
Figure 6-16
Neighbor-Joining trees of Polymerase Basic-2 (PB-2),
Polymerase acidic (PA) and Polymerase Basic-1(PB-1)
gene segments of 34 pH11/09 strains detected in 2009 in
a Singapore university campus(black) and WHO vaccine
and closest reference strains for 2009(red). Boot strap
values 60 and over are shown. Analyses were conducted
in MEGA 6. The bar at the bottom represents amino acid
substitutions per site.
121
Figure 7-1
Graph showing predicted N-glycosylation sites in HA of
sH1N1 viruses isolated from Singapore at threshold of
0.5
135
XVIII
Figure 7-2
Graph showing predicted N-glycosylation sites in HA
H3N2 viruses isolated from Singapore at threshold of 0.5
136
Figure 7-3
Graph showing predicted N-glycosylation sites in HA of
A/Singapore/139N/2007 isolated from Singapore
sequences at threshold of 0.5
136
Figure 7-4
Graph showing predicted N-glycosylation sites in HA of
pH1N1/09 viruses at threshold of 0.5
137
Figure 7-5
Sequence of a representative strain of pH1N1/09 virus
isolated in this study showing predicted N-glycosylation
sites in HA
137
Figure 8-1
Amino acid alignment (97 aa) of M2 protein of H3N2
(A), sH1N1 (B), p09H1N1 (C) and combined H3N2 and
sH1N1 (D) viruses
147
Figure 9-1
Neighbor-joining tree for ‘shared strains’ based on amino
acid sequences of hemagglutinin gene (HA) of influenza
strains of subtype pH1N1/09 isolated from university
campus. Four distinct clusters identified are shown in
different colors and the name of the strain is followed by
the day and month of sample collection. Green color
strains belong to cluster A, blue color strains belong to
cluster B, red color strains belong to cluster C and grey
color strains belong to cluster D. The analyses were
conducted in Mega 6. The bar at the bottom indicates the
number of amino acid substitutions per site.
161
Figure 9-2
Neighbor-joining trees for ‘non-shared strains’ based on
amino acid sequences of Hemagglutinin (HA) of
influenza virus subtypes H3N2 (A), sH1N1 (B) and
pandemic H1N1/09 (C) detected on Singapore university
campus. The analyses were conducted in Mega 6. The bar
at the bottom indicates the number of amino acid
substitutions per site. The strain name is followed by date
and month of isolation.
162
Figure 9-3
Maximun-Likelihood phylogenetic tree of 34
concatenated genomes of pH1N1/09 viruses from NUS
campus. Strain name is followed by residence status and
week of isolation. On campus sequences are in red and
Off campus sequences are in black font. Clusters were
identified with strong bootstrap support (70%). Clusters
with exclusively On- campus sequences are highlighted
in grey color.
166
XIX
LIST OF ABBREVIATIONS
aa
amino acid
AdV
Adenovirus
AI
Association index
ATCC
American Type Culture Collection
BaTS
Bayesian Tip-association Significance testing
BEAST
Bayesian Evolutionary Analysis Sampling Trees
BOV
Bocavirus
BSA
Bovine Serum Albumin
CDC
Centers for Disease Control and Prevention
CO
2
Carbon dioxide
COV
Coronavirus
Ct
Cycle threshold
CPE
cytopathic effects
DFA
Direct fluorescent antibody
DMEM
Dulbecco’s modified eagle’s medium
DMSO
Dimethyl sulfoxide
DNA
Deoxyribonucleic acid
cDNA
Complementary Deoxyribonucleic acid
dNTP
deoxyribonucleotide
DSO
Defence Science Organization
DTT
Dithiothreitol
EDTA
Ethylenediaminetetraacetic acid
EIA
Enzyme immunoassay
EV
Enterovirus
FBS
Fetal Bovine Serum
GISRS
Global influenza surveillance and response system
GTR
Generalised time-reversible
HA
Hemagglutinin
HIA
Hemagglutination assay
HPAI
Highly pathogenic avian influenza
HMPV
Human metapneumovirus
IAV
IBV
Influenza A virus
Influenza B virus
IFN
Interferon
ILI
Influenza like illness
IRB
Institutional review board
M1
Matrix protein 1
M2
Ion Channel matrix protein
MBCS
Multibasic cleavage site
MCMC
Markov chain monte carlo
MDCK
Madin-Darby Canine Kidney
M/MP
Matrix
Mab
Monoclonal antibody
MEGA
Molecular Evolutionary Genetic Analysis
MERS
Middle East Respiratory syndrome
MOH
Ministry of health
NA
Neuraminidase
NAI
Neuraminidase inhibitor
NEP
Nuclear export protein
nf
nuclease free
XX
NJ
Neighbor-Joining
NP
Nucleoprotein
NPV
Negative predictive value
NRIC
National Registration Identity Card
NS
Non-structural protein
nt
nucleotide
NUS
National University of Singapore
PA
Polymerase acidic
PB-1
Polymerase basic-1
PB1-F2
Polymerase basic 1– reading frame 2
PB2
Polymerase basic 2
PBS
Phosphate buffered saline
PCR
PDB
Polymerase chain reaction
Protein Data Bank
PDZ
Postsynaptic density protein
PIV
Parainfluenza virus
PPV
Positive predictive value
PS
Parsimony score
PST
Posterior set of trees
RBD
Receptor binding domain
RIDT
Rapid influenza antigen detection tests
RNA
Ribonucleic acid
ssRNA
Single stranded Ribonucleic acid
vRNA
Viral ribonucleic acid
RNP
Ribonucleoprotein
Rpm
Rotations per minute
RSV
Respiratory syncytial virus
RT
Reverse transcription
RTPCR
Reverse transcription polymerase chain reaction
rRTPCR
Real-time Reverse transcription polymerase chain reaction
RV
Rhinovirus
SARS
Severe acute respiratory syndrome
SEA
South-East Asia
TBE
Tris/Borate/EDTA
TPCK
L-1-tosylamido-2-phenylethyl chloromethyl ketone
UHC
University Health Centre
UPL
Universal probe library
VTM
Viral transport medium
WHO
World Health Organization
1
Chapter 1: Introduction
1.1 Influenza infection
Influenza (commonly called ‘flu’) is an acute, febrile, contagious
infection of respiratory tract caused by influenza viruses. The symptoms range
from mild to severe. The common symptoms of influenza include fever or
feeling feverish, chills, sore throat, cough, muscle aches, headache, and
weakness/fatigue. Although it is self-limited illness, complications such as
pneumonia, sinus infections and ear infections may occur in
immunocompromised individuals, young children, pregnant women or
individuals with serious underlying medical conditions (CDC 2014a).
1.2 Influenza virology
Influenza virus belongs to family Orthomyxoviridae (Pringle 1996).
Currently, this family is constituted by 6 genera: influenza virus A, influenza
virus B, influenza virus C, Thogotavirus (Pringle 1996), Isavirus (Palese &
Shaw 2007; Wright et al. 2007) and Quarjavirus (Presti et al. 2009). Antigenic
differences in matrix (M) proteins and nucleoproteins (NP) form the basis of
classification of influenza viruses into three types: A, B, and C. Although
these 3 types cause human infections only influenza A virus (IAV) possesses
the remarkable capacity to cause pandemics (Klenk et al. 2008) because only
IAV has animal reservoirs: pigs, birds, sea mammals (Webster et al. 1992;
Alexander & Brown 2000) and birds (CDC 2014b) which provide HA and NA
capable of adaptation and transmission in humans.
2
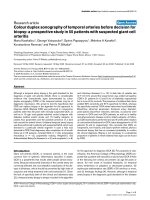
IAVs encode 8 negative stranded RNA segments (Figure 1-1 and Table
1.1) ranging from 890 to 2341 nucleotide (nt) in length for a total of about
13,588 nts depending on the subtype (Lamb & Choppin 1983) and 16
polypeptides (Schrauwen et al. 2014) that perform specific functions (Table
1.1). IAV subtypes are based on HA and NA. There are 18 HA subtypes
known so far with H17 discovered in fruit bats (Tong et al. 2012) and H18 in
Peruvian bats (Tong et al. 2013) and 11 NA subtypes. Influenza B virus (IBV)
has antigenically diversified into Victoria and Yamagata lineages since 1970s
(Kanegae et al.1990).
Adapted from Schrauwen et al. 2013
Figure 1-1: Schematic representation of influenza virus segments and
proteins. The Non-structural (NS) proteins and newly discovered proteins are
shown in rectangles
Table 1.1: Influenza A virus RNA segments and proteins encoded (Adapted
from Lamb et al. 2001)
Segment
Length
(nucleotides)
Encoded polypeptides (length)
1
2,341
PB2(759)
2
2,341
PB1(757), PB1-F2(87),PB1N40
3
2,233
PA(716), PA-X, PA-N155, PA-N182
4
1778
HA(566)
5
1565
NP(498)
6
1413
NA(454)
7
1,027
M1(252), M2(97), M42
8
890
NS1(230), NS2/NEP(121)
3
1.3. Influenza proteins
1.3.1 Polymerase proteins
Polymerase proteins comprise of Polymerase Basic protein-1 (PB-1),
Polymerase Basic protein-2 (PB-2), Polymerase Acidic protein (PA) and together
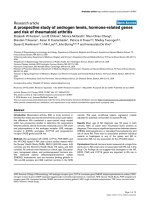
with Nucleoprotein (NP) and viral RNA they form ribonucleoprotein (RNP)
complex (Figure 1-2). These proteins are required for transcription and replication
of genome (Huang et al. 1990). Chen et al., identified 52 host-associated
signatures and 35 of these signatures are located in the RNP (Chen et al. 2006).
Adapted from Naffakh et al. 2008
Figure 1-2: Schematic representation of Ribonucleoprotein complex(RNP). RNP
is composed of four viral proteins(PB-2, PB-1, PA, NP) and viral RNA
1.3.1.1 PB-2
PB-2 possesses host range restriction markers (Shi et al. 1995; Chen et al.
2006; Naffakh et al. 2008) the most remarkable being PB2 residue 627 (Subbarao
et al. 1993) which in avian host generally encodes Glutamic acid (E) while in
human host encodes Lysine (K) and rarely Arginine (R). PB-2 residue 701 is
another host range restriction marker with Aspartate (701D) encoded in avian host
while asparagine (701N) encoded in human host (Gabriel et al. 2005; Li et al.
4
2005). Additionally residues 701–702 direct nuclear localization (Gabriel et al.
2008; Tarendeau et al. 2007). Notably, 2009 H1N1 virus (pH1N1/09) does not
possess mammalian adaptation residues 627K and 701N (Schrauwen et al. 2014).
Of the 10 amino acid (aa) changes in PB2 proposed to be human host markers,
pH1N1/09 only carries T271A (Finkelstein et al. 2007). Alternative strategies
such as SR polymorphism have been proposed for human adaptation (Mehle &
Doudna 2009).
1.3.1.2 PB-1 & PB1-F2
PB1 also determines host range restriction with human viruses encoding
Serine (S) at residue 375 and Asparagine (N) in most avian viruses (Taubenberger
et al. 2005; Naffakh et al. 2008). PB1-F2 induces apoptosis (Gibbs et al. 2003)
and is a determinant of virulence in IAVs (Chen et al. 2001; McAuley et al. 2007;
Chakrabarti & Pasricha 2013; McAuley et al. 2010; Conenello et al. 2007).
Asparagine (N) to Serine (S), substitution at residue 66 (N66S) reduces interferon
(IFN) production (Varga et al. 2012). Notably, pandemic H1N1 2009 (pH1N1/09)
does not encode PB1-F2 because of the premature stop codon (Schrauwen et al.
2014).
1.3.1.3 PA
PA is a phosphoprotein and induces proteolytic cleavage (Sanz-Ezquerro et
al. 1995). PA-X modulates host response to infection (Jagger et al. 2012) and is a
fusion protein of IAV (Shi et al. 2012).