UNDERSTANDING THE INTERACTIONS BETWEEN VEGETATION AND HYDROLOGICAL SYSTEMS IN TROPICAL URBAN AREAS FOR SUSTAINABLE WATER RESOURCES MANAGEMENT
Bạn đang xem bản rút gọn của tài liệu. Xem và tải ngay bản đầy đủ của tài liệu tại đây (2.37 MB, 188 trang )
UNDERSTANDING THE INTERACTIONS
BETWEEN VEGETATION AND HYDROLOGICAL
SYSTEMS IN TROPICAL URBAN AREAS FOR
SUSTAINABLE WATER RESOURCES
MANAGEMENT
TRINH DIEU HUONG
(M.Sc, TuDelft)
A THESIS SUBMITTED
FOR THE DEGREE OF DOCTOR OF PHILOSOPHY
DEPARTMENT OF CIVIL AND
ENVIRONMENTAL ENGINEERING
NATIONAL UNIVERSITY OF SINGAPORE
2014
i
DECLARATION
I hereby declare that the thesis is my original work and it has been written by
me in its entirety. I have duly acknowledged all the sources of information
which have been used in the thesis.
This thesis has also not been submitted to any degree in any university
previously.
Trinh Dieu Huong
19
th
August 2014
ii
ACKNOWLEDGEMENTS
This thesis is a result of four years of research work since I was admitted into
the PhD program in the Department of Civil and Environmental Engineering,
the National University of Singapore. Throughout this journey, I have worked
with a great number of people whose contributions in the research deserved
special mention.
In the first place, I would like to show my utmost gratitude to Dr. Ting Fong
May Chui for her supervision, advice, guidance, and above all, for her
patience from the very early stage of this research. She triggered all my
excitements and guided me in the right direction of the research. I truly thank
her for believing in me. Her encouragements lead me to the more achievement
than I could imagine.
I would also like express my deep gratitude to Emeritus Professor Cheong Hin
Fatt for all the valuable suggestions that shaping up my research. His supports
during the transition of supervisor help me stay on track. Without his help, my
dissertation could never be completed. Thank you very much, sir.
My special thanks to my group member, Dr. Palanisamy Bakkiyalakshmi, Mr.
Ali Meshgi, Mr Ly Duy Khiem, for their advice and their willingness to share
their bright thoughts and the difficult time during field work. It was great to
work with them.
I gratefully thank my friend in NUS, Ms Sally Teh for all the enjoyable lunch
time, Mr. Zhang Xiaofeng for helping me with the field work and teaching me
mandarin. Special thanks Ms. Serene Tay, who introduced the PhD program
in NUS to me, who was always a great help whenever I need. To me, you are
my class mate, my best friend and my sister. I would also like to thank all my
PhD fellows, Xiangbo, Jiexin, Kittikun, Harif, Han Ting, Abraham, Zhu Lei,
Nguyen Thi Qui. You all made my life in NUS more memorable.
iii
Last but not least, I would like to express my thanks to my family. Thank my
beloved parents for their love, encouragement and caring from my home town
throughout my PhD. My loving and caring husband, Justin Yeoh, gave me not
only emotional support but also valuable comments and suggestions in statistic
and optimization. My lovely daughter, Sabrina Yeoh, is my main source of
energy and happiness.
iv
TABLE OF CONTENTS
Acknowledgements ii
Table of Contents iv
Summary ix
List of Tables xii
List of Figures xiii
List of Abbreviations xv
Chapter 1. Introduction 1
1.1. Problem Overview 1
1.1.1 Interaction of vegetation and hydrological system 1
1.1.2 Managing hydrology – vegetation interactions for sustainability
of urbanization 13
1.1.3 Catchment – scale hydrological model and additional tools 15
1.2 Research Objectives 18
1.3 Thesis Overview 21
Chapter 2. An empirical method for approximating canopy throughfall 23
2.1 Abstract 23
2.2 Introduction 24
2.3 Methodology 25
2.3.1 Overview 25
2.3.2 Mass balance model (MBM) 26
2.3.3 Potential Evapotranspiration / Actual Evaporation 28
2.3.4 Choice of Variables in Empirical Equations 30
2.3.5 Regression analysis 30
2.3.6 Data Availability and Usage 31
2.3.7 Local and Global Equations 32
v
2.4 Results and Discussions 32
2.4.1 Fluxes of Mass Balance Model 32
2.4.2 Local Equations 33
2.4.3 Sensitivity Analysis of Local equations 34
2.4.4 Verification of Local equations 37
2.4.5 Global Equation 40
2.5 Discussions 42
2.6 Conclusions 42
Chapter 3. Performance of green roof for stormwater management in
tropical regions 44
3.1 Abstract 44
3.2 Introduction 45
3.3 Methodology 47
3.3.1 One-dimensional green roof model 48
3.3.2 Model calibration and validation 51
3.3.3 Green roof characteristics 51
3.3.4 Singapore rainfall analysis 53
3.3.5 Simulation plan 54
3.4 Results 55
3.4.1 Model calibration and validation 55
3.4.2 Event analysis 56
3.4.3 Average performance 61
3.5 Discussion 64
3.6 Summary and Conclusion 67
vi
Chapter 4. Assessing the hydrologic restoration of an urbanized area via
integrated distributed hydrological model 71
4.1 Abstract 71
4.2 Introduction 71
4.3 Methodology 74
4.3.1 The Integrated Distributed Hydrological Model 74
4.3.2 Green roofs and bio-retention systems – conceptual
understanding and model implementation 75
4.3.3 Marina-like Catchment – A Case Study in Singapore 77
4.4 Results 86
4.4.1 Impacts on overall water balance 86
4.4.2 Impacts on eminent water resources issues 88
4.4.3 Model sensitivity analysis 94
4.5 Discussion 96
4.6 Summary and conclusions 96
Chapter 5. Optimizing bio-retention locations for stormwater
management using genetic algorithm 100
5.1 Abstract 100
5.2 Introduction 101
5.3 Methodology 103
5.3.1 Fundamental criteria in implementing bio-retention system 104
5.3.2 Optimization model 105
5.4 Results and discussion 112
5.4.1 Integrated distributed hydrological model calibration 112
5.4.2 Optimization model performance 114
5.4.3 Influences of bio-retention location on outlet peak discharge . 115
5.4.4 Influences of bio-retention location on groundwater 119
5.4.5 Study implications and limitations 121
vii
5.5 Summary and conclusions 122
Chapter 6. Conclusions 125
6.1 Contributions 125
6.2 Limitations 128
6.3 Possible Areas for Future Research 129
Appendices 132
A Hydrological model selection 132
B Equations in Mike SHE hydrological modelling system 140
B.1 Interception/Evapotranspiration 140
B.2 Infiltration 142
B.3 Overland flow 142
B.4 Channel flow: one-dimensional Saint-Venant equation 143
B.5 Unsaturated zone 143
B.6 Saturated zone 144
B.7 Coupling unsaturated zone and saturated zone 144
C Genetic algorithm in water resource planning and management 146
C.1 Evolutionary computation and genetic algorithm 146
C.2 Genetic algorithm operator 146
C.3 Single-objective and multiple objective optimizations 149
References 150
Chapter 1 150
Chapter 2 155
Chapter 3 157
Chapter 4 160
viii
Chapter 5 164
Chapter 6 166
Appendices 166
ix
SUMMARY
The hydrologic and vegetation systems are intrinsically interrelated.
Urbanization replaces vegetation with impervious surfaces, significantly
influencing hydrological processes. The impacts could be even more
significant in tropical areas due to frequent and high intensity storm events.
Therefore, there are strong interests to better understand the hydrological
processes and their interactions with vegetation to mitigate water related
problems such as flooding. The interactions involve a number of complex and
dynamic processes, from the plot scale to catchment scale. Computational
modeling is required to evaluate the influences of urbanization and predict the
effectiveness of problem mitigation. This dissertation first examines the
hydrology-vegetation interactions in the plot scale. The understanding is then
upscaled to formulate flooding mitigation at the catchment scale.
This dissertation is divided into the following three parts:
(1) Examining the influences of vegetation on hydrological processes in
the plot scale
The first part of this dissertation studies the relationship between vegetation
and throughfall. Precipitation is partly intercepted by vegetation canopy,
reduceing the amounts that reaches the ground (i.e. throughfall). This study
derives some simple-to-use empirical equations relating throughfall, and
canopy to rainfall characteristics. The amounts of throughfall in any regions
can be estimated with reasonable accuracy using information on only three
variables (i.e. maximum canopy storage, average rainfall depth and time
interval between two consecutive rainfalls in a month). It also proposes a
methodology to derive location-specific equations with higher accuracy when
additional weather data are available.
x
This part of the study also explores the influence of green roof on water
routing. Using a one-dimensional hydrological model, three important
characteristics of green roofs: hydraulic conductivity, soil thickness and
storage capacity are examined in different time scales. It demonstrates that the
time and magnitude of peak discharges are strongly affected by the design of
green roofs. It also shows that green roof performance varies among regions
due to different rainfall characteristics, and analyses on a single storm event or
a series of storm events yield different results. Overall, it brings insights to our
understandings on the influence of green roofs on water routing and the proper
upscaling of green roof model to the large scale catchment hydrological
model.
(2) Evaluating urbanization impact on hydrological system in the
catchment scale and restoration solution
The second part of this dissertation investigates the hydrological responses to
urbanization using an integrated distributed hydrological model based on the
main conditions of the Marina catchment, a highly urbanized catchment in
Singapore. It first demonstrates current conditions of the catchment. It then
simulates the condition before urbanization by assuming the entire catchment
is covered by vegetation. By comparing the results of two scenarios, it
concludes that urbanization affects the hydrological system significantly in
terms of changing water balance and water regime. Green structures (e.g.
green roofs and bio-retention systems) are then implemented to mitigate the
hydrological impacts of urbanization. Results demonstrate that green roofs
delay the time and reduce the magnitude of outlet peak discharges while bio-
retention systems mitigate peak discharges and enhance the infiltration rate.
Therefore, the implementation of both green roofs and bio-retention systems is
able to restore the flow characteristics similar to the pre-urbanized conditions
even in a tropical area. The results enhance our understandings of hydrological
changes during the different phases of urbanization. They are not only
applicable to Singapore but also to any catchment-level planning of green
structures in other urban areas.
xi
(3) Optimizing green structure locations for stormwater management
The last part of this dissertation proposes a scheme to determine the optimized
locations of green structures for stormwater management. As green roofs can
only be located on the top of buildings, this part of study focuses on the bio-
retention system location. A genetic algorithm is written and used as an
optimization tool, and it generates varying combinations of the bio-retention
system locations. The generated combinations are used as the input to the
integrated distributed hydrological model. The combination that gives the
lowest outlet discharge is then regarded as the best solution. Developed
separately from the hydrological model, the genetic algorithm is not only
transferable to other study areas but also can be coupled with any hydrological
models most suitable for any particular case study.
Overall, the results of this dissertation advance the knowledge of the
vegetation-hydrology interactions in tropical urban areas, which benefit
stormwater management. Using the Marina catchment in Singapore as a case
study, some of the results, such as the throughfall equation and the genetic
algorithm code in the bio-retention location optimization, are not only
applicable to tropical regions but also to the rest of the world.
xii
LIST OF TABLES
Table 1.1 Relationship between infiltration rate, soil texture and canopy
specifications (Maitre et al. 1999) 4
Table 1.2 Model selection criteria and specific requirements 16
Table 2.1 Data availability and usage 31
Table 2.2 Local equations and associated R-squared values 34
Table 3.1 Variation of soil thickness of green roofs (Czemiel Berndtsson
2010) 52
Table 3.2 Model validation using rainfall events in September 2009 56
Table 3.3 Average performances of green roofs with different characteristics
62
Table 3.4 Influence of green roof characteristics during 3 month ARI
condition and average long-term basis 69
Table 4.1 Vegetation characteristics of Marina-like catchment 81
Table 4.2 Soil texture and properties of Marina-like catchment 82
Table A.1 Examples of the lumped hydrological models available in literature
132
Table A.2 Examples of the semi-distributed hydrological models available in
literature 133
Table A.3 Examples of the fully distributed hydrological models available in
literature 137
xiii
LIST OF FIGURES
Figure 1.1 Interaction between vegetation and hydrological system 2
Figure 1.2 Dependence of transpiration rate with the saturation threshold
(Guswa et al. 2002) 6
Figure 1.3 Roles of different vegetation types on soil water balance (Laio et al.
2001) 10
Figure 1.4 Linkages between soil moisture deficit and vegetation water stress.
(Porporato et al. 2001) 11
Figure 1.5 Interactions between vegetation and hydrological system in urban
area 13
Figure 2.1 Rainfall interception and throughfall in hydrological system 24
Figure 2.2 In-flux and out-flux of a canopy “bucket” 26
Figure 2.3 Flow chart of mass balance model (MBM) in calculating monthly
canopy thoughfall 28
Figure 2.4 Daily MBM components in Singapore (January 2006) 33
Figure 2.5 Dependence of throughfall on maximum canopy storage 36
Figure 2.6 Dependence of throughfall on rainfall characteristics 37
Figure 2.7 Verification of local equations in Singapore, Vancouver and
Stanford 38
Figure 2.8 Verification of global equation in Singapore 41
Figure 2.9 Verification of global equation in Fontainebleau 41
Figure 3.1 Components of one-dimensional green roof model 48
Figure 3.2 Hyetograph of designed rainfall with 3 months return period 53
Figure 3.3 Comparison between the measured and simulated rainfall events on
19th September, 2009 56
Figure 3.4 Runoff under different soil hydraulic conductivities during 3 month
ARI condition 58
xiv
Figure 3.5 Influences of green roof characteristics on outlet discharge during 3
month ARI condition 60
Figure 4.1 Components of integrated distributed hydrological model 75
Figure 4.2 Location of Marina Catchment within Singapore 78
Figure 4.3 Land cover (left) and soil distribution (right) of Marina-like
catchment 81
Figure 4.4 Water balance at observation point (indicated in Figure 4.2) in
catchment equipped with bio-retention systems 87
Figure 4.5 Water balance aggregated over one year for different scenarios 88
Figure 4.6 Peak discharges at catchment outlet under different scenarios 90
Figure 4.7 Delay of peak discharges for different sections (i.e., downstream,
midstream and upstream) of the main river of catchment 91
Figure 4.8 Infiltration rate at observation point (indicated in Figure 4.2) in
catchment 93
Figure 4.9 Average infiltration rate of entire catchment under different
scenarios 93
Figure 5.1 Flow chart of optimization model 106
Figure 5.2 Characteristics of Marina Catchment, Singapore (Trinh and Chui
2013). Map of Singapore in the top right corner. 108
Figure 5.3 Land cover (left) and soil distribution (right) of Marina Catchment
(Trinh and Chui 2013) 108
Figure 5.4 Chromosome structure proposed in this study 110
Figure 5.5 Chromosome decoding 110
Figure 5.6 Illustrations of Crossover and Mutation Operator 112
Figure 5.7 Hydrological model calibration and validation 114
Figure 5.8 Outlet peak discharges for all populations over generations 115
Figure 5.9 Outlet discharge in various scenarios, demonstrating the
effectiveness of bio-retention systems 116
Figure 5.10 Best and random bio-retention system arrangements. Green dots
represent bio-retention systems 118
Figure 5.11 Common bio-retention locations in 20 top arrangements of lowest
discharge 119
Figure 5.12 Groundwater recharge in different bio-retention arrangement 120
Figure C.1 GA framework (Nicklow et al. 2009) 149
xv
LIST OF ABBREVIATIONS
ARI
Average Recurrence Interval
BMP
Best Management Practice
DEM
Digital Elevation Model
DHI
Danish Hydraulic Institute
GA
Genetic Algorithm
HSPF
Hydrological Simulation Program-Fortran
LAI
Leaf Area Indexes
LID
Low Impact Development
MBM
Mass Balance Model
NSGA
Non-dominated Sorting
PDE
Partial Differential Equation
RD
Root Depth
SHE
System Hydrologique European
StormWISE
Stormwater Investment Strategy Evaluation
SWAT
Soil Water Assessment Tool
SWMM
Storm Water Management Model
1
CHAPTER 1. INTRODUCTION
1.1. Problem Overview
Hydrologic and vegetation systems are intrinsically interrelated. Urbanization
replaces vegetation with impervious surfaces, significantly influencing
hydrological processes. The impacts could be even more significant in tropical
areas due to frequent and high intensity storm events. Therefore, there is a
strong interest to better understand the hydrological processes and their
interactions with vegetation to mitigate water related problems such as
flooding. The interactions involve a number of complex and dynamic
processes, ranging in scale from plot to catchment level. Computational
modeling is required to evaluate the influences of urbanization and predict the
effectiveness of problem mitigation. This dissertation first examines the
hydrology-vegetation interactions at a plot scale. The understanding is then
upscaled to evaluate the influences of urbanization at the catchment scale. In
addition, the low impact development is introduced to formulate flooding
mitigation solution. The location of the low impact developments (e.g. rain
gardens, bio-retention swales, constructed wetlands, green roofs) are also
considered via an optimization model.
1.1.1 Interaction of vegetation and hydrological system
Vegetation has great impact on the hydrological system by controlling in-
fluxes and out-fluxes, and redistributing water among the system components.
At the same time, the changes in hydrological system characteristics affect the
condition of vegetation dynamically. Thus, vegetation and hydrological
system are closely interconnected with each other.
Figure 1.1 shows the typical interactions between vegetation and hydrological
systems. Before reaching the ground, part of the precipitation is intercepted by
the vegetation canopy. When the canopy reaches a saturated state, water will
channel down through the stem. The remaining precipitation passes through
the canopy and reaches the ground. It then infiltrates into the ground,
replenishes the subsurface water or contributes to surface runoff and routes to
the river eventually. At the same time, evaporation/ evapotranspiration also
2
takes place. Plants use the intercepted water from the canopy and the extracted
for evapotranspiration. Surface water from and soil water also contribute to the
evaporation process. The state of art relating the processes of vegetation-
hydrological system interaction is addressed in the following.
Figure 1.1 Interaction between vegetation and hydrological system
Stemflow and throughfall
Throughfall is the precipitation that reaches the ground after going through the
canopy. It is important to know the amount of throughfall as it reflects the
amount of water supplies for hydrologic budget. To date, a number of
researches have attempted to estimate the throughfall amount. Studies first
stated factors affecting the amount of interception such as: duration and
intensity of rainfall, the area and roughness of the plants’ surfaces which retain
or absorb water (combined as canopy storage capacity) (Larcher 1983). For
example, interception of grass is much lesser than that of trees in short rainfall
and high evaporation demand conditions (Laio et al. 2001); high rainfall
intensities, long-duration storms, open plant canopies and smooth bark give
less interception (Lunt 1934, Sharma et al. 1987, Farrington et al. 1991). In
addition, rainfall occurrence frequency is also an important factor during the
interception process (Bache and MacAskill 1984). During the periods with
less frequent rainfall, much of the rainwater is retained as the canopy is dry.
When the rain is more frequent, intercepted water is less due to the remaining
water from the previous event.
While there is some understanding of throughfall and its dependent factors,
there is still little knowledge on evaluating throughfall generically. Although
all the important dependent factors have been defined, most of the studies are
3
location specific and it is difficult to transfer the results from one location to
other.
Stemflow is the flow that created from the intercepted precipitation which is
channelled down through the stem. The amount of stemflow is insignificant
most of the time. However, it can be as high as 22% of precipitation in some
cases (Návar and Bryan 1990). When stemflow is strong enough, it can
potentially enhance infiltration rate and increase the soil-water flux
significantly.
Infiltration and percolation
Infiltration is the movement of water from the surface through the soil profile
under influences of gravity and capillarity. It involves three processes: entry
through the soil surface; depletion of available soil capacity, and transition
through the soil (Bache and MacAskill 1984). These processes not only
depend on the soil texture and hydraulic conductivity but also vegetation
(especially the entry through the soil surface). The litter on the soil surface
produces the organic matters which bind soil particles and increases their
porosity. The coverage of canopy and litter protects the soil surface from the
raindrop impact (Maitre et al. 1999), which potentially cause erosion,
compaction and sealing of soil surface, consequently lowering the infiltration
rate. Table 1.1 shows the effects of canopy on the infiltration rate. Focusing on
the canopy specifications, the relative infiltration rate is higher when the
canopy/ litter coverage area is larger. Moreover, vegetation increases the
surface roughness coefficient, giving more time for water to infiltrate. For
instance, under the same climatic condition, the infiltration rate of the area
with litter and grass basal coverage is nine time higher than the bare soil
(O’Connor 1985).
4
Table 1.1 Relationship between infiltration rate, soil texture and canopy
specifications (Maitre et al. 1999)
Country and Source
Soil
Texture
Canopy Specifications
Relative
Infiltration
Rate %
Zimbabwe
(Kennard and Walker 1973)
Sandy
Closed canopy
Open canopy
Open grassland
100
84
55
Zimbabwe
(Kennard and Walker 1973)
Variable
Complete litter cover
Partial litter cover
No litter cover
100
33
12
Kenya
(Belsky et al. 1989)
Loamy
Under canopy A. tortilis
Open field
Under canopy Adansonia
Open field
100
25
100
20
Kenya
(Scholte 1989)
Loamy
Under shrub
Open field
100
5
Not only canopy, the roots of vegetation also affect subsurface water recharge
via preferential flow. Preferential flow is an uneven and often rapid vertical
movement through the root channels, increasing the percolation rate. It
depends on the depth and coarseness of vegetation root systems: the deeper the
root can reach, the higher the percolation rate; the vegetation roots with the
coarser size generate the larger void space in the soil resulting in higher
amount of infiltrated water. Thus, it leads to significant changes in recharge
rate. Together with the movement of water, solute is also transported via
pathways. In the study of Allison and Hughes (1983), they observed the
penetration depth of the water in Western Australia period over of 20 years
with different types of vegetation on the surface. The results showed that
rainwater can reach the depth of 12 meters beneath the eucalypt forest, but
only the depth of 2.5 meters beneath the wheat land. It was further concluded
that more water is able to penetrate through the soil and reach the saturated
groundwater due to preferential flow. There is little knowledge about
preferential flow due to the difficulty in defining the contribution of
preferential flow on subsurface root structure of vegetation and in
understanding non-equilibrium of flow. Furthermore, researches are mostly
focus on the solute transport due to the consequence of groundwater polluted.
5
Evapotranspiration and subsurface water extraction
Beside interception, vegetation also reduces subsurface water recharge by
extracting the water from the soil for evapotranspiration purposes. The amount
of water for this process can be quite significant with the typical fraction from
45% to 80% (Larcher 1983). It is controlled by two factors: the atmospheric
demand, and availability of water in the soil.
Atmospheric demand determines the maximum amount of water transpired
under a typical climate condition including temperature, incoming radiation
and relative humidity, called as potential evapotranspiration. The hourly
potential evapotranspiration is calculated using the Penman (1948) - Monteith
(1965) equation as follows:
a
c
a
zzpair
net
r
r
r
eec
GH
E
1
0
(1.1)
where
is the latent heat of vaporization (MJ/kg), E is the hourly potential
evapotranspiration (mm/hour), Δ is the slope of saturation vapour pressure -
temperature curve (kPa/
0
C), H
net
is the net radiation (MJ/m
2
.hour), G is the
heat flux density to the ground (MJ/m
2
.hour),
air
is the air density (kg/m
3
), c
p
is the specific heat at the constant pressure (MJ/kg.
0
C), e
0
z
is the saturation
vapour pressure of air at height z (kPa), e
z
is the water vapour pressure of air at
height z (kPa),
(kPa/
0
C) is the psychometric constant, r
c
is the plant
resistance (s/m), r
a
is the diffusion resistance (s/m).
The availability of water in soil defines together with the potential
evapotranspiration the actual amount of evapotranspiration. If the water is
sufficient, the amount of water uptake will equal to water demand. If the soil is
too dry, the uptake is less. Vegetation with root within the unsaturated zone
6
mostly takes up water from the unsaturated zone for the evapotranspiration
process. To define the uptake amount from the unsaturated zone, Guswa et al.
(2002) suggested the soil moisture threshold values. These thresholds include
the saturation threshold (𝑠
∗
) above which uptake is equal to demand; the
wilting threshold (s
w
) below which there is no water uptake and the plant will
wilt; the field capacity (𝑠
𝑓𝑐
) below which the rate of gravity drainage becomes
negligible relative to evapotranspiration; and hygroscopic saturation (𝑠
ℎ
) at
which evaporation ceases. When relative soil moisture content is in the range
of 𝑠
∗
and 𝑠
𝑤
, the uptake is less than the demand but the plants still stay
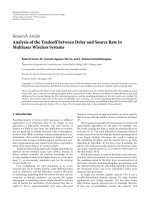
“healthy”. Figure 1.2 shows the relationship between the amount of
transpiration and the relative soil moisture content evaluated by the saturation
thresholds. If the relative soil moisture content drops below the critical value
(wilting point), the plant will wilt and die eventually. If the relative soil
moisture content is above the critical value, the plant will be at the normal
condition and the transpiration rate will reach the maximum at the saturation
point.
Figure 1.2 Dependence of transpiration rate with the saturation threshold
(Guswa et al. 2002)
Differing from the shallow root vegetation where the evapotranspiration rate
can be controlled by the relative soil moisture, vegetation with deeper roots
takes water directly from groundwater. As a result, the groundwater level
declines due to vegetation extraction. At the same time, lowering water table
also affects vegetation condition. Two typical areas with high groundwater
7
table fluctuations are riparian zones and wetlands. In the riparian systems, the
plants tap into water stored in river banks or into groundwater that is
discharged to the rivers. Some vegetations are highly adaptable to the
fluctuations of the water table, while others are sensitive to the water stress
exacted by sudden lowering of the water table (Stromberg et al. 1996).
Groundwater extraction may have serious impacts on the natural system. The
sudden changes in the depth of water table may cause stress and partial or
complete mortality in large trees (Bernadez et al. 1993, Stromberg et al. 1996).
However, depending on the particular condition, vegetation may response
differently to the changes. If the extraction of the water table is in the
acceptable range, there will be minimum effect on vegetation. Thus,
groundwater should be managed within an acceptable fluctuation range for a
death of particular plant.
Surface runoff
Suitable vegetation decreases surface runoff and prevents soil erosion
(Tromble 1976, Reid et al. 1999, Chaplot and Bissonnais 2003, Dunjó et al.
2004, Kothyari et al. 2004, Zhang et al. 2004, Mohammad 2005). Vegetation
increases the infiltration rate via canopies, roots and litters, reducing the
effective rainfall that contributes to runoff. Meanwhile, vegetation coverage
acts as surface roughness elements slowing down overland flow, reducing
streamflow discharges especially during the peak period. In addition, some
vegetations function as the temporal storage, delaying the effective rainfall for
a period of time before it contributes to runoff and streamflow. To date, there
is limited research on the delaying effect of vegetation. Most previous studies
have focused on the reduction of runoff and stream flow due to the decrease of
effective rainfall.
Rangeland degradation (Snyman 2005, Al-Seikh 2006) or deforestation
increases runoff risks (Singer and Le Bissonnais 1998, Vacca et al. 2000,
8
Snyman 2005, Al-Seikh 2006, Mohammad and Adam 2010) and significantly
increases stream flow. For example, streamflow discharge increases by 45%
due to clearing of 40% coverage in the Comet river basin, Queensland,
Australia (Siriwardena et al. 2006); by 24 % due to clearing of 19% coverage
in Tocantins river, central Brazil (Siriwardena et al., 2006). Nevertheless, the
changes of runoff due to changes in coverage also depend on the size of
catchment. The impact of land cover on streamflow in large catchments often
contrasts those observed in small catchments (Peña-Arancibia et al. 2012).
Thus, these results are location specific and hard to transfer to other
geographical locations.
Eco-hydrology
The interactions between hydrologic-vegetation systems are considered as
eco-hydrological processes and are briefly summarized here.
Eco-hydrology plays a major role in a wide range of scientific issues such as
hydrological processes (Rodriguez-Iturbe and Porporato 2004). Currently, it is
the most useful approach for evaluating the ecological mechanisms involved
in water cycling and water resources management. Exploring soil-water stress
is one key issue in eco-hydrology. It is particularly important for a long-term
study on the relationship between the vegetation and the changes in regional
climate and water circumstance (Wainwright 1996). Although eco-hydrology
is considered to be a new cross-disciplinary field of study from an academic
point of view, the essence of the science-related issues involved in eco-
hydrology have been applied to ecological restoration. This section will first
reviews the influences of vegetation on soil moisture dynamics, then the
effects of soil moisture dynamics on vegetation condition, and finally the
water balance of soil-vegetation system.
The response of vegetation to soil moisture dynamics: Climate, soil control
vegetation dynamics and vegetation plays an important role in controlling
water balance. Therefore, vegetation has a special role in water-control
ecosystem (Rodriguez-Iturbe et al. 2001, Rodriguez-Iturbe et al. 2001). There
are two main characteristics of vegetation that decides the dynamics of water-
control ecosystem which are vegetation root depth and vegetation water stress.