determination of polycyclic aromatic hydrocarbon pahs and aliphatic hydrocarbons in oysters by gc msms
Bạn đang xem bản rút gọn của tài liệu. Xem và tải ngay bản đầy đủ của tài liệu tại đây (924.49 KB, 8 trang )
Determination of Polycyclic Aromatic
Hydrocarbons (PAHs) and Aliphatic
Hydrocarbons in Oysters by GC-MS/MS
Klaus Mittendorf, Laszlo Hollosi, Ebru Ates, Katerina Bousova, Thermo Fisher Scientific Food Safety Response Center, Dreieich, Germany
Eric Phillips, Hans-Joachim Huebschmann, Thermo Fisher Scientific, Austin, TX, USA
James Chang, Thermo Fisher Scientific, San Jose, CA, USA
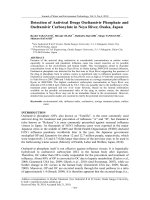
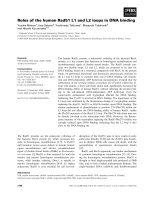
1. Schematic of Method
2. Scope
This method can be applied to oysters to detect the presence
of aliphatic hydrocarbons and PAH contamination from
crude oil found in the Gulf of Mexico in late May 2010.
From the profile using GC-MS/MS, the method can be used
to characterize the source of contamination. The method
can give a semi-quantitative indication of whether levels of
PAHs exceed safety limits for human consumption of oysters.
3. Principle
The method uses a liquid extraction of oysters with hexane,
followed by a clean-up on a silica-SPE-cartridge. The sample
is fortified with appropriate labeled internal standards
and analyzed by simultaneous GC-MS/MS using a
Thermo Scientific TSQ Quantum XLS triple quadrupole
mass spectrometer system. Aliphatic hydrocarbons and PAHs
of food safety significance are measured and compared with
the profile from crude oil collected from the Gulf of Mexico
in late May 2010.
4. Reagent List
Fisher Scientific USA
Part Number
4.1 Acetone A9491
4.2 Cyclohexane C6201
4.3 Hexane H3021
4.4 SPE Hypersep SI, 200 mg/3 mL 03251270
4.5 Toluene AC176850010
5. Calibration Standards
5.1 PAHs
Acenaphthene – Ace (Sigma)
Acenaphthylene – Acy (Sigma)
Anthracene – Ant (Sigma)
Benz[a]anthracene – B(a)A (Sigma)
Benzo[a]pyrene – B(a)P (Sigma)
Benzo[b]fluoranthene – B(b)F (Sigma)
Benzo[g,h,i]perylene – B(g,h,i)P (Sigma)
Benzo[k]fluoranthene – B(k)F (Sigma)
Chrysene – Chr (Sigma)
Dibenz[a,h]anthracene – D(a,h)A (Sigma)
Fluoranthene – Flu (Sigma)
Fluorene – Fln (Sigma)
Indeno[1,2,3-cd]pyrene – I(1,2,3-c,d)P (Sigma)
Naphthalene – Naph (Sigma)
Phenanthrene – Phe (Sigma)
Pyrene – Pyr (Sigma)
Key Words
•
TSQ Quantum XLS
• Aliphatic
Hydrocarbons
• Gulf Oil Spill
•
Oil Contamination
• Oyster Extraction
• PAHs
Method: 51980A
Sample (Oyster) Homogenization
Sample 2.0 g + Isotopically Labeled IS
Liquid Extraction
Clean-up
Concentration
GC-MS/MS
1. Weigh sample in 15 mL glass tube and add IS
2. Vortex samples (10 s)
3. Equilibrate 10 min
4. Extract with 5 mL hexane in ultrasonic bath (10 min)
5. Transfer in round flask with pasteur pipette
6. Repeat steps 4 and 5 three more times
7. Evaporate to about 1 mL
8. Condition SPE with 3 mL hexane
9. Apply sample
10. Elute up to 5 mL with hexane
11. Gently evaporate under nitrogen stream to dryness
12. Reconstitute in 180 µL of cyclohexane + 20 µL of
injection/surrogate standard.
5.2 Injection Standard
5-methylchrysene – 5-MChr (Dr. Ehrenstorfer)
5.3 Internal Standards
Anthracene-D10 – Ant-D10 (Sigma)
Benzo[a]pyrene-D12 – B(a)P-D12 (Sigma)
Benzo[ghi]perylene-D12 – B(g,h,i)P-D12 (LGC Standards)
Chrysene-D12 – Chr-D12 (Sigma)
5.4 Quality Control Materials
Petroleum Crude oil (NIST Standard Reference
Material
®
, 1582)
Aliphatic Hydrocarbons in 2,2,4-Trimethylpentane
(NIST Standard Reference Material, 1494)
6. Standards and Reagent Preparation
6.1 Stock solutions of 2 µg/mL of PAH standards
in toluene
6.2 Internal PAHs standard (IS) concentration:
2 µg/mL (Benzo[ghi]perylene-d
12
, Anthracene-d
10
,
Chrysene-d
12
) in toluene and 200 µg/mL
Benzo[a]pyrene-d
12
in cyclohexane
6.3 Working standard solution mixture of 16 PAHs
in toluene (100 ng/mL)
6.4 Working internal standard mixture of IS PAHs
in toluene (200 ng/mL)
6.5 Syringe standard, 5-methyl-chrysene (200 ng/mL)
in toluene.
6.6 Spiked solution of Petroleum crude oil (NIST 1582):
100 mg/mL in cyclohexane
7. Apparatus
Fisher Scientific USA
Part Number
7.1 Centrifuge, Heraeus
™
75-004-500
Multifuge
™
X3
7.2 Thermo Scientific 16 port SPE 03-251-252
vacuum manifold
7.3 Evaporator EVTM-130-32-16 3106395
(Fisher Scientific Germany)
7.4 Fisher precision balance 01918306
7.5 Vacuum pump 05-402-100
7.6 Rotavapor
®
R-210 05-024-21
7.7 Sartorius analytical balance 01-910-3224
7.8 Thermo sci. Barnstead 0905050
EASYpure
™
II water
7.9 Ultrasonic bath Elmsonic S40H 154606Q
7.10 ULTRA-TURRAX
®
– 1425980
dispergation tool
7.11 ULTRA-TURRAX – 14259023
Plug-in coupling
7.12 ULTRA-TURRAX 142259301
7.13 Vortex shaker 14505141
7.14 Vortex standard cap 14-505-140
7.15 GC column TR-50MS 30 m, 260R142P
0.25 mm ID, 0.25 µm film
7.16 TSQ Quantum XLS
™
Triple Quadrupole
Mass Spectrometer
8. Consumables
Part Number
8.1 GC vials 03393F
8.2 Pipette Finnpipette 100-1000 µL 14386320
8.3 Pipette Finnpipette 10-100 µL 14386318
8.4 Pipette Finnpipette 500-5000 µL 14386321
8.5 Pipette holder 14245160
8.6 Pipette Pasteur soda lime 136786A
glass 150 mm
8.7 Pipette suction device 03-692-350
8.8 Pipette tips 0.5 – 250 µL, 500/box 21377144
8.9 Pipette tips 1 – 5 mL, 75/box 2137750
8.10 Pipette tips 100 – 1000 µL, 2137746
200/box
8.11 Spatula, 18/10 steel 14356C
8.12 Spatula, nylon NC9319088
8.13 SPE Hypersep SI, 03251270
200 mg/3 mL, 50 pc.
8.14 Tube holder 03840233
8.15 Wash bottle, PTFE 0340911A
Glassware
8.16 Beaker, 50 mL FB10050
8.17 Fisherbrand test tubes 14-958D
8.18 Funnel, 55 mm 14353D
8.19 Glass tubes 14957E
8.20 Pasteur pipette 136786A
8.21 Round flask 50 mL, NS 29/32 9011835
(Fisher Scientific Germany)
8.22 Volumetric flask, 10 mL FB40110
8.23 Volumetric flask, 25 mL 10200A
9. Procedure
9.1 Sample Preparation
Rinse the glassware with acetone before proceeding with the
method to avoid cross contamination. Homogenize a suitable
amount (e.g. 250 g) of oyster meat appropriately to give a
slurry using a high speed blender, e.g. ULTRA-TURRAX.
9.2 Extraction
9.2.1 Accurately weigh the homogenized sample
(ca. 2 g) into a glass tube.
9.2.2 Add 50 µL of PAH internal standard solution
to the sample.
9.2.3 Vortex the mixture for 10 s and wait 10 min for
equilibration.
9.2.4 Add 5 mL of hexane to the sample and put it into
an ultrasonic bath for 10 min.
9.2.5
Transfer the supernatant hexane layer into a 50 mL
round flask with a Pasteur pipette.
9.2.6 Repeat the extraction (9.2.4 and 9.2.5) three
more times.
9.2.7 Centrifuge for 5 min at 4500 rpm and 5 °C
and decant supernatant.
9.2.8
Evaporate to 1 mL under vacuum (220 mbar/50 °C).
9.3 Clean-up
9.3.1 Condition the SPE-Cartridge with 3 mL of hexane.
9.3.2 Apply the extract to the cartridge and elute into
an evaporator tube with 5 mL of hexane.
9.3.3 Evaporate at 40 °C to dryness using a blow-down
apparatus under a gentle stream of nitrogen.
9.3.4 Reconstitute in 180 µL of cyclohexane plus 20 µL
of injection standard.
9.4 Analysis
9.4.1 GC operating conditions
GC analysis was performed on a Thermo Scientific
TRACE GC Ultra system (Thermo Fisher Scientific,
Waltham, MA USA). The GC conditions were as follows:
Column: Thermo TR-50MS 30 m, I.D.: 0.25 mm, 0.25 µm
film capillary column
Injection mode: splitless with a 5 mm injection port liner
Injection port temperature: 270 °C
Flow rate: 1.2 mL/min
Split flow: “On”, flow: 25 mL/min
Splitless time: 1 min
SSL carrier method mode: constant flow
Initial value: “On” with 1.2 mL/min
Initial time: 1 min
Gas saver flow: 15 mL/min
Gas saver time: 3 min
Vacuum compensation: “On”
Transfer line temperature: 270 °C
Oven Temperature: 60 °C for 1 min, then programmed at
12 °C/min to 210 °C, then 8 °C/min
to 340 °C with 5 min hold time
9.4.2 Mass Spectrometric Conditions
MS analysis is carried out using a TSQ Quantum XLS triple
quadrupole mass spectrometer (Thermo Fisher Scientific,
Waltham, MA USA). A satisfactory tune of the mass
spectrometer is achieved when the detector is set at m/z 300
or less and the three FC 43 (calibration gas) ions (68, 219,
and 502) are at least half the height of their respective
windows and the ions at 502 and 503 are resolved.
The MS conditions for PAHs are as follows:
Ionization mode: EI positive ion
Ion volume: closed EI
Emission current: 50 uA
Ion source temperature: 250 °C
Scan type: Full scan in range m/z 45-650 and SRM
Scan width: 0.15 for SRM
Scan time 0.2 s for full scan and 0.05 for SRM
Peak width: Q1, 0.7 Da; Q3, 0.7 Da FWHM
Collision gas (Ar) pressure: 0.5 mTorr
The mass spectrometer is programmed to be able
to simultaneously monitor the hydrocarbon profile in
scanning Full Scan (FS) GC-MS and quantify the presence
of PAHs by MS/MS within a single chromatographic run.
Eight segments are programmed each with 2 simultaneous
scan events. One scan event is used to monitor the aliphatic
hydrocarbon profile throughout the whole chromatographic
run (i.e in all segments), while SRM traces are set up for
the target PAHs in the other scan event. The program of
segments for SRM events (#1) is shown in Table 1.
Setting of scan event #2 for hydrocarbon profiling was
kept constant in all segments:
•
Scan type: FS in range 45-650 m/z
•
Scan time: 0.2 s
•
FWHM: 0.7 Da
•
Collision gas pressure: 0.5
10. Calculation of Results
10.1 Aliphatic Hydrocarbons
From the scanned GC-MS data, print a reconstructed ion
chromatogram (extracted ion chromatogram) for m/z 57
and plot this alongside a similar m/z 57 extracted chro-
matogram for the standard mixture of hydrocarbons. Any
detectable aliphatic hydrocarbon peaks in oysters can be
identified based on their retention times which are given in
Table 2. This is illustrated in Figure 1. Measure the specific
peak area ratios to characterize the source of hydrocarbon
contamination.
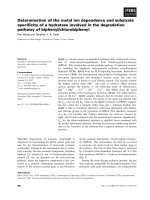
10.2 PAHs
The occurrence of one or more of any of the 16 PAHs of
food safety concern is indicated by the presence of transition
ions (quantifier and qualifier) as indicated in Table 1 at
retention times corresponding to those of the respective
standards shown in Table 1. This is illustrated in Figure 1.
Careful visual inspection of the SRM chromatograms
should be carried out to check for interferences. The
measured peak area ratios of precursor to quantifier ion
should be in close agreement with those of the standards
as shown in Table 1. If the presence of any of the 16 PAHs
is confirmed based on retention times and ion ratios then
quantification should be carried out as indicated below.
Calibration by the internal standardization is applied
for the quantification of PAHs. This calibration requires
the determination of response factors R
f
defined by the
equation below.
Calculation of the response factor:
R
f
=
A
St
× c
[IS]
A
[IS]
× c
St
R
f
– the response factor determined by the analysis of
standards PAH and internal standard
A
St
– the area of the PAH peak in the calibration standard
A
[IS]
– the area of the internal standard peak for the
calibration standard
c
St
– PAH concentration for the calibration standard
solution
c
[IS]
– the internal standard concentration for the
calibration standard solution
Calculations for each sample the absolute amount of PAH that
was extracted from the sample:
X
PAH
=
A
PAH
× X
[IS]
A
[IS]S
× R
f
X
PAH
– the absolute amount of PAH that was extracted
from the sample
A
PAH
– the area of PAH peak of the sample
A
[IS]S
–
the area of the internal standard peak of the sample
X
[IS]
– the absolute amount of internal standard added to
the sample
The concentration of PAH in the sample (ng/g):
c (ng/g) =
X
PAH
m
c – the concentration of PAH in the sample (ng/g)
m – the sample weight in g
11. Interpretation of Results
The analytical data generated in the method requires careful
interpretation to collect convincing evidence of aliphatic
hydrocarbon contamination of oysters originating from an
actual crude oil sample from Gulf of Mexico and consequent
PAH contamination. The method provides a hydrocarbon
profile and PAH profile which can be matched against that
of crude oil sample from the Gulf of Mexico. The compo-
sition of crude oil from the Gulf of Mexico is given in
Table 4 indicating relatively high levels of n-hexadecane,
n-heptadecane and pristane which are characteristic.
Characteristic pristane/C-17 ratio (0.7) phytane/C-18 ratio
(0.35) were observed. The relative amounts of any combi-
nation of individual aliphatic hydrocarbons can be measured
and matched against the crude oil sample from the Gulf of
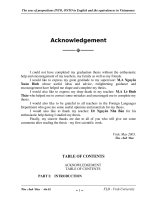
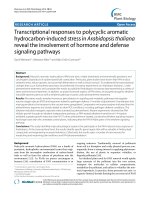
Mexico composition. As illustrated in Figure 4 which shows
both direct analysis of crude oil from the Gulf of Mexico
as well as analysis after cleanup from oysters. However,
it should be noted that the composition of the oil changes
with time and the uptake by oysters eventually may have
a different profile from the crude oil. The composition of
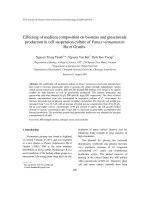
other samples of crude oils is illustrated in Figure 5 again
indicating differences in profile.
Similarly the pattern of PAHs found in crude oil is
very characteristic as shown in Table 4 with levels of Ant,
Phe, Flu and Chr being 100 times higher than levels of
B(a)P. Subject to satisfactorily meeting requirements for
identification of PAHs, the method gives semi-quantitative
values for the higher mass PAHs which can be used as a
good guide as to whether oysters samples are above or
below safety limits. Accurate results require confirmation
using a more refined cleanup procedure.
12. Method Performance
Method performance was established by separate spiking
experiments for blank oysters with firstly a mixture of
aliphatic hydrocarbon standards (NIST1494 – C10-C34
hydrocarbons) and secondly a mixture of 16 PAH standards.
To evaluate method performance with combined aliphatic
hydrocarbons and PAHs, spiking was carried out with
NIST 1582 petroleum crude oil.
12.1 Recovery
Aliphatic hydrocarbons – The method was shown to be
unsuitable for recovery of aliphatic hydrocarbons below
n-pentadecane due to losses during concentration of the
sample extract. Average recoveries of n-hexadecane (C-16)
to n-tetratricontane (C-34) ranged from 52-108%.
PAHs – Background contamination and lack of availability
of a real blank sample made it impossible to make an
accurate estimate of the recoveries of the lower mass PAHs
(Naph, Ace, Acy, Flu, Ant, Phe, Fln and Pyr). However
average recoveries of the remaining higher mass PAHs
[(B(a)P, Chr, B(b)F, B(k)F, B(k)F, B(a)P, B(g,h,i)P, and
D(a,h)A] ranged from 65-126%.
12.2 Specificity
Aliphatic hydrocarbons – Full scan spectra were obtained in
each case. Identification was confirmed by close agreement
of retention times for standards and comparison with
scanned spectra, particularly checking for evidence of
interferences. Extracted ion chromatograms using m/z 57
were used for profiling but additional ions characteristic
of aliphatic hydrocarbons (e.g. m/z 71) can be used as an
additional check of specificity.
PAHs – By SRM, specificity was confirmed based on the
presence of transition ions (quantifier and qualifier) at
the correct retention times corresponding to those of the
respective PAH standards. Furthermore, the measured
peak area ratios of precursor to quantifier ion should
be in close agreement with those of the standards.
12.3 Limits of Detection
Aliphatic hydrocarbons – LODs for aliphatic hydrocarbons
were estimated to be between 0.2 and 1 ng (on-column
injected) in full scan mode. For 1 µL of extract injected
into the GC-MS this is equivalent to 20-100 ng/g (ppb)
hydrocarbon contamination of the oysters.
PAHs – Background contamination made it impossible to
make an accurate estimate of the LODs of the lower mass
PAHs (Naph, Ace, Acy, Flu, Ant, Phe, Fln and Pyr).
However, LODs of the remaining higher mass PAHs
[(B(a)P, Chr, B(b)F, B(k)F, B(k)F, B(a)P, B(g,h,i)P, and
D(a,h)A] were estimated to be between 0.01 and 0.07 ng
(on-column injected) in SRM mode. For 1 µL of extract
injected into the GC-MS/MS this is equivalent to 1-7 ng/g
(ppb) PAH and oil contamination of oysters.
12.4 Accuracy
The accuracy for measurement of PAHs was determined
by spiking NIST crude oil standard into oysters and
following the full extraction and cleanup procedure.
Background contamination made it impossible to make
an accurate estimate of the recoveries of the lower mass
PAHs (Naph, Ace, Acy, Flu, Ant, Phe, Fln and Pyr).
However average recoveries of (B(a)A, B(a)P, B(g,h,i)P,
and I(1,2,3-c,d)P were 124, 92, 81 and 86 % respectively
as shown in Table 3. Bearing in mind that the method is
intended as a semi-quantitative screen this accuracy was
deemed to be satisfactory.
Duration Retention Precursor Quantifier Qualifier Ion Collision
Segment (min) PAH and IS Time (min) Ion Ion Ion Ratio Energy
1 10.50 Naph 8.66 127.9 102.0 77.8 0.38 15
2 2.50 Acy 12.13 152.0 151.1 126.0 0.11 10
Ace 12.35 154.0 153.0 152.0 0.12 10
3 1.50 Fln 13.37 165.9 165.0 162.9 0.05 10
4 3.00 Ant 15.87 178.0 176.0 152.0 0.70 30
Phe 15.95 178.0 176.0 152.0 0.70 30
Ant-D10 15.89 188.1 160.2 158.2 0.40 30
5 4.50 Flu 19.13 202.0 201.1 200.1 0.40 10
Pyr 19.97 202.0 201.0 200.1 0.40 10
6 3.70 B(a)A 23.48 228.1 226.0 202.1 0.15 20
Chr 23.71 228.1 226.2 202.2 0.15 20
Chr-D12 23.65 240.2 238.1 215.1 0.11 30
5MChr 24.98 242.1 241.1 227.5 0.15 30
7 3.80 B(b)F 26.75 252.1 250.1 226.1 0.18 30
B(k)F 26.82 252.1 250.1 226.1 0.18 30
B(a)P 27.96 252.1 250.1 226.1 0.18 30
B(a)P-D12 27.87 264.1 260.1 236.0 0.38 30
8 5.50 I(1,2,3-c,d)P 30.96 276.1 274.0 250.0 0.05 35
B(g,h,i)P 31.99 276.1 274.0 250.0 0.05 35
BgP-D12 31.86 288.2 286.1 125.1 0.06 35
D(a,h)A 30.97 278.0 276.0 226.1 0.05 35
Table 1: Parameters for SRM analysis of PAHs grouped according to Figure 1
Hydrocarbon Empirical Formula Molecular Ion Retention Time
n
-decane C
10
H
22
142.1 3.99
n
-undecane C
11
H
24
156.2 4.97
n
-dodecane C
12
H
26
170.2 6.14
n
-tridecane C
13
H
28
184.2 7.30
n
-tetradecane C
14
H
30
198.2 8.42
n
-pentadecane C
15
H
32
212.2 9.50
n
-hexadecane C
16
H
34
226.2 10.51
n
-heptadecane C
17
H
36
240.2 11.45
pristane C
19
H
40
268.3 11.24
n
-octadecane C
18
H
38
254.3 12.41
phytane C
20
H
42
282.3 12.30
n
-nonadecane C
19
H
40
268.3 13.28
n
-eicosane C
20
H
42
282.3 14.14
n
-docosane C
22
H
46
310.3 15.90
n
-tetracosane C
24
H
50
338.3 17.73
n
-hexacosane C
26
H
54
366.4 19.56
n
-octacosane C
28
H
58
394.4 21.35
n
-triacontane C
30
H
62
422.4 23.08
n
-dotriacontane C
32
H
66
450.5 24.77
n
-tetratricontane C
34
H
70
478.5 26.45
Table 2: Aliphatic hydrocarbons monitored in oysters spiked with NIST 1494
Average amount Average amount
Hydrocarbon [µg/g] (n=2) PAH [µg/g] (n=2)
n
-pentadecane 407 Naph 19
n
-hexadecane 1484 Acy 436
n
-heptadecane 1329 Ace 96
Pristane 928 Fln 144
n
-octadecane 337 Ant 11857
Phytane 118 Phe 11287
n
-nonadecane 330 Flu 958
n
-eicosane 289 Pyr 547
n
-docosane 188 B(a)A 29
n
-tetracosane 146 CHR 804
n
-hexacosane 82 B(b)F 428
n
-octacosane 43 B(k)F 40
n
-triacontane 31 B(a)P 2
n
-dotriacontane 23 B(g,h,i)P 7
n
-tetratricontane 10 I(1,2,3-c,d)P 2
D(h)A 3
Table 4: Composition of Crude oil from Gulf of Mexico. Characteristic
pristane/C-17 ratio (0.7) phytane/C-18 ratio (0.35) were observed.
PAH Assigned Value [ng/g] Measured Value [ng/g] Recovery [%]
B(a)A 14.06 ± 1.00 17.39 124
B(a)P 5.52 ± 1.00 5.11 92
I(1,2,3-c,d)P 0.85 ± 0.50 0.69 81
B(g,h,i)P 8.54 ± 0.2 7.37 86
Table 3: Analysis of spiked oysters with NIST 1582 crude oil
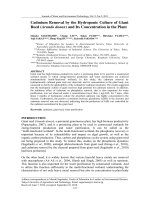
Figure 1: Chromatogram of oyster sample spiked with aliphatic hydrocarbons plus 10 ng/g PAH mixture. Top chromatogram shows
m/z
57 for hydrocarbon
profiling, while lower chromatograms are SRM traces for 16 individual PAHs. Retention times for the 16 PAHs found in Table 1.
m/z
57.0
Int: 1.12E7
m/z
127.9 -> 102.0
Int: 8.61E5
m/z
152.0 -> 151.1
Int: 3.71E6
m/z
154.0 -> 153.0
Int: 3.36E6
m/z
165.9 -> 165.0
Int: 1.87E6
m/z
178.0 -> 176.0
Int: 2.49E6
m/z
202.0 -> 201.0
Int: 8.38E7
m/z
228.1 -> 226.1
Int: 8.38E7
m/z
252.1 -> 250.1
Int: 1.59E6
m/z
276.1 -> 274.0
Int: 7.23E5
m/z
278.0 -> 276.0
Int: 5.51E5
D(a,h)A
B(g,h,i)P I(1,2,3-c,d)P
B(b)F B(k)F B(a)P
B(a)A Chr
Flu Pyr
Phe Ant
Fln
Ace
Acy
Naph
Figure 4: Hydrocarbon profile of crude oil sample taken from the Gulf of Mexico in late May 2010 by direct analysis (top) and after 5 mg/kg spiking into oyster
sample (bottom) showing
m/z
57
Figure 2: Chromatogram of oyster sample spiked with 10 ng/g B(a)P
Figure 3: Chromatogram of oyster sample spiked with 5 µg/g crude oil sample taken from the Gulf of Mexico in late May 2010 and found to contain 5 ng/g B(a)P
Directly injected Mexican Gulf
oil spill sample
m/z
57.0
Pristane
Phytene
C17
C18
Mexican Gulf oil spill sample in
oyster after sample preparation
m/z
57.0
Part of Thermo Fisher Scientific
In addition to these
offices, Thermo Fisher
Scientific maintains
a network of represen -
tative organizations
throughout the world.
Africa-Other
+27 11 570 1840
Australia
+61 3 9757 4300
Austria
+43 1 333 50 34 0
Belgium
+32 53 73 42 41
Canada
+1 800 530 8447
China
+86 10 8419 3588
Denmark
+45 70 23 62 60
Europe-Other
+43 1 333 50 34 0
Finland/Norway/
Sweden
+46 8 556 468 00
France
+33 1 60 92 48 00
Germany
+49 6103 408 1014
India
+91 22 6742 9434
Italy
+39 02 950 591
Japan
+81 45 453 9100
Latin America
+1 561 688 8700
Middle East
+43 1 333 50 34 0
Netherlands
+31 76 579 55 55
New Zealand
+64 9 980 6700
South Africa
+27 11 570 1840
Spain
+34 914 845 965
Switzerland
+41 61 716 77 00
UK
+44 1442 233555
USA
+1 800 532 4752
TG51980_E 06/10M
Legal Notices
©2010 Thermo Fisher Scientific Inc. All rights reserved. Standard Reference Material is a registered trademark of NIST (National Institute of Standards and
Technology) reporting directly to the US Department of Commerce. Rotavapor is a registered trademark of BÜCHI Labortechnik AG. ULTRA-TURRAX is a
registered trademark of IKA-Werke GmbH & Co. All other trademarks are the property of Thermo Fisher Scientific Inc. and its subsidiaries. This information
is presented as an example of the capabilities of Thermo Fisher Scientific Inc. products. It is not intended to encourage use of these products in any manners
that might infringe the intellectual property rights of others. Specifications, terms and pricing are subject to change. Not all products are available in all
countries. Please consult your local sales representative for details.
Figure 5: Comparison of hydrocarbon distribution of different type of oils showing
m/z
57. Top: NIST1582 petroleum crude oil, middle: crude oil sample taken
from the Gulf of Mexico in late May 2010, at the bottom: NIST1494 hydrocarbon standard.