Experimental investigation for powder reinforcement effect on mechanical properties and natural frequency of isotropic hyper composite plate with various boundary conditions
Bạn đang xem bản rút gọn của tài liệu. Xem và tải ngay bản đầy đủ của tài liệu tại đây (2.97 MB, 18 trang )
INTERNATIONAL JOURNAL OF
ENERGY AND ENVIRONMENT
Volume 6, Issue 5, 2015 pp.499-516
Journal homepage: www.IJEE.IEEFoundation.org
ISSN 2076-2895 (Print), ISSN 2076-2909 (Online) ©2015 International Energy & Environment Foundation. All rights reserved.
Experimental investigation for powder reinforcement effect
on mechanical properties and natural frequency of isotropic
hyper composite plate with various boundary conditions
Abdulkareem Abdulrazzaq Alhumdany
1
, Muhannad Al-Waily
2
, Mohammed Hussein
Kadhim
1
1
Mechanical Engineering Department, College of Engineering, Karbala University, Ministry of Higher
Education & Scientific Research, Karbala, Iraq.
2
Mechanical Engineering Department, Faculty of Engineering, Al-Kufa University, Ministry of Higher
Education & Scientific Research, Najaf, Iraq.
Abstract
In this research eleven samples of composite plate materials was made with different volume fraction of
the components to produce an isotropic hyper composite materials composed of three materials, epoxy
resin and two reinforcements: short glass fiber and glass powder. The composite structure was studied to
estimate the mechanical properties (modulus of elasticity E, modulus of rigidity G, and Poisson’s ratio )
and the natural frequency experimentally. The experimental procedure includes the tensile test machine
with the load capacity (0-540KN) and vibration test machine. The effect of volume fraction for different
aspect ratios of plate were studied with six boundary conditions (Simply supported along all edges
(SSSS), Simply-Free Support Edges (SSFF), Clamped-Free Support Three Edges (CFFF), Simply-
Clamped Supported Edges (SSCC), Clamped-Free Supported Edges (CCFF), and Clamped Support
along all edges (CCCC). The results showed that the modulus of elasticity of hyper composite of short
glass fiber and glass powder reinforcement and epoxy resin material was increased with the increase of
short fiber volume fraction (
%). But the yield stress was decreased with the increase of powder
volume fraction (
%) of hyper composite material. The natural frequency of isotropic hyper composite
materials plate was increased with the increase of short fiber volume fraction were the volume fraction of
short fiber (
= 40%) at samples 4 and 8, maximum natural frequency had occur. It was observed that
the natural frequency for aspect ratio (AR=1) was higher than that for aspect ratio (AR=1.5). The
Experimental mechanical properties and natural frequency of composite plate with various volume
fraction results are compare with results of other researcher and the comparison shown the good
agreement between presented results and results of research, Muhannad Al-Waily [7], where, the
maximum error of mechanical properties compared about (8.77%) and maximum error for natural
frequency compared about (10.48%).
Copyright © 2015 International Energy and Environment Foundation - All rights reserved.
Keywords: Hyper composite materials; Isotropic composite plate; Natural frequency; Mechanical
properties, Experimental vibration, Powder effect.
International Journal of Energy and Environment (IJEE), Volume 6, Issue 5, 2015, pp.499-516
ISSN 2076-2895 (Print), ISSN 2076-2909 (Online) ©2015 International Energy & Environment Foundation. All rights reserved.
500
1. Introduction
The first attribute of composite materials that has been encouraged in the engineering applications was
their light-weight because of the positive effects on efficiency, noise and vibrations. Composite materials
are attaining both high strength and high stiffness when compared with metallic materials, especially in
the weight sensitive aerospace and aircraft engineering .
The last few decades witness a major effort to develop composite material systems and analyze and
design structural components made from them [1]. At present composite materials refer to materials
having strong fibers (continuous or discontinuous) surrounded by a weaker matrix material. The matrix
works to distribute the fibers and also to transmit the load to the fibers. The bonding between fibers and
matrix is created in the manufacturing phase of the composite material. This has essential influence on
the mechanical properties of the composite material (elastic properties: modulus of elasticity E, modulus
of rigidity G, and Poisson’s ratio υ), [2].
The analysis of natural frequency of composite plate/shell plays an important role in the design of
structure in mechanical, civil, and aerospace engineering applications [1]. Composite materials consist of
two or more materials which together produce desirable properties that cannot be achieved with any of
the components alone, [3]. The desirable characteristics of most fibers are high strength, high stiffness,
and comparatively low density. Glass fibers are the mostly used ones in medium performance composites
because of their high tensile strength and low cost .
Many studies were performed to examine the Analysis of natural frequency and properties of composite
plate, as,
Parsuram Nayak, [4], presents a combined experimental and numerical study of free vibration of woven
fiber Glass/Epoxy composite plates. He determined experimentally Elastic parameters and natural
frequencies of woven fiber Glass/Epoxy cantilevered composite plates and compared with the developed
computer program based on FEM, and determined the natural frequency and mode shape of the plate
using ANSYS package. The present experimental value and program result compared with ANSYS
package. The experimental frequency data is in fair agreement with the program computation. The
Percentage of error between experimental value and ANSYS package is within 15%.
Itishree Mishra andShishir Kumar Sahu, [5], presented a study involves extensive experimental works to
investigate the free vibration of woven fiber Glass/Epoxy composite plates in free-free boundary
conditions. the specimens of woven glass fiber and epoxy matrix composite plates were manufactured by
the hand-layup technique and determined Elastic parameters of the plate experimentally by tensile testing
of specimens using Instron 1195. An experimental investigation is carried out using modal analysis
technique with Fast Fourier Transform Analyzer, PULSE lab shop, impact hammer and contact
accelerometer to obtain the Frequency Response Functions. Also, this experiment is used to validate the
results obtained from the FEM numerical analysis based on a first order shear deformation theory. The
effects of different geometrical parameters including number of layers, aspect ratio, and fiber orientation
of woven fiber composite plates are studied in free-free boundary conditions in details .
Muhsin J. Jweeget. Al, [6], presented an experimental and theoretical study of composite materials
reinforcement fiber types . The experimental work and the theoretical investigation covered the study of
modulus of elasticity for long, short, woven, powder, and particle reinforcement of composite materials
types with difference volume fraction of fiber. They study of effect of fiber and resin types and the effect
of volume fraction of fiber and matrix materials on modulus of elasticity for composite materials. Their
results showed good agreement between experimental and theoretical study for different types of
composite materials. They showed that the best modulus of elasticity for reinforcement composite is
unidirectional fiber types in longitudinal direction and the woven reinforcement fiber types for transverse
direction.
Muhannad Al-Waily, [7], suggested analytical solution for dynamic analysis of hyper composite plate
combined from two reinforcement fiber, mat and powder or short and powder, with polyester or epoxy
resin matrix. The theoretical study of hyper composite plate evaluated the effect of the volume fraction
and types of reinforcement fiber and matrix resin. The suggested analytical solution include evaluation of
the mechanical properties of isotropic hyper composite material plate, as modulus of elasticity and
modulus of rigidity in addition to Poisson’s ratio. The results show the natural frequency increasing with
the increasing of reinforcement fiber and with the increasing of strength reinforcement fiber or resin
matrix. A comparison made between analytical results from theoretical solution of general equation of
motion of hyper composite plate, with numerical solution, by ANSYS program Ver. 14, results, given
good agreement with maximum error about 1.8% and minimum error about 0.75%.
International Journal of Energy and Environment (IJEE), Volume 6, Issue 5, 2015, pp.499-516
ISSN 2076-2895 (Print), ISSN 2076-2909 (Online) ©2015 International Energy & Environment Foundation. All rights reserved.
501
This work presents an experimental study of modal testing of different volume fractions of short
reinforcement fiber, reinforcement powder, and resin matrix hyper composite plates. A program based on
FEM is developed. The experimental results of the program have been compared with that obtained from
the finite element analysis and theoretical Analysis results. Elastic properties of the plates determined
from tensile test method. Variation of natural frequency with different parameter is studied as different
aspect ratios and boundary conditions supports.
2. Experimental study
The experimental study of composite materials included study of mechanical properties of different types
of composite materials with different volume fractions short reinforcement glass fiber, glass
reinforcement powder, and epoxy resin.
2.1 The density evaluation
To predict the weight of composite components, the density of each component (reinforcement glass
fiber, glass powder, and polyester resin materials) must be known. The tools used are,
Dial Phials
Sensitive Libras.
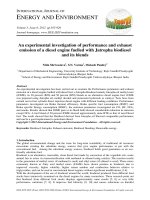
The density can be calculated by divide the material weight on the difference in water volume. As
follows:
= =
(1)
where, change of water volume after adding the material to water. and is density of short fiber,
powder, or resin materials, (Kg/m
3
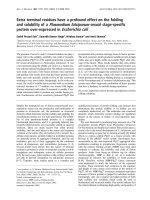
). As shown in Figure 1. And, The weight used fiber and resin
materials are show in Table 1.
Figure 1. Steps to evaluate density of glass powder used
Table 1. Density of glass fiber and polyester resin materials
Materials
Weight of Fiber (g)
(mL)
Density (kg/m
3
)
Short Fibers
150
75
2000
Glass powder
50
20.8
2400
epoxy
240
200
1200
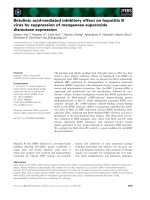
2.2 Composite plates manufacturing processes
To test the mechanical properties of Composite Materials the samples are manufactured with the
dimensions: 32 width, 44 length, 5 thickness, in the laboratory with the standard conditions.
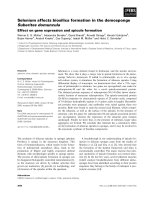
The following steps composite materials manufacturing as shows in Figure 2. And the produced
composite plates were shown in Figure 3.
Weight of the powder Volume of water Water with powder
International Journal of Energy and Environment (IJEE), Volume 6, Issue 5, 2015, pp.499-516
ISSN 2076-2895 (Print), ISSN 2076-2909 (Online) ©2015 International Energy & Environment Foundation. All rights reserved.
502
Figure 2. Steps of manufacturing the composite plates
7- Putting the resin mixture on fibers
8- Another layer of fibers
9- Putting the upper wood block
11- Resulting composite plate
10- Pressing upper block on lowers by
a heavy weights fibers
6- Mixing of resin
and powder
4- Painting the insulated layer on
the wood block and glass frame
5- Weighting of resin, powder
and fibers
1- Upper wood block painted
with insulated layer
2- Frame of glass on lower
wood block
3- Fixing the glass frame on the
lower wood block
International Journal of Energy and Environment (IJEE), Volume 6, Issue 5, 2015, pp.499-516
ISSN 2076-2895 (Print), ISSN 2076-2909 (Online) ©2015 International Energy & Environment Foundation. All rights reserved.
503
Figure 3. The final composite plates
2.3 Tensile test samples of composite materials
The tensile experimental test of composite materials includes the determination of the modulus of
elasticity for composite materials of short, and powder reinforcement fiber and polyester resin in various
volume fractions of fiber and resin materials.
as ASTM Number (D3039/D03039M) [8], the shape and dimensions of tensile test sample selected as
shown in Figure 4, as, Length of sample = 20cm, Width of sample = 3cm, Thickness of sample = 5mm.
Three samples are divided to test it for each type of composite plate. As shown in Figure 5.
Figure 4. Shape and dimensions of tensile test sample
Then, the tensile test properties of composite materials are defined by testing the samples by tensile
machine shown in Figure 6. The tensile test machine used to evaluate modules of elasticity and yield
stress for different reinforcement composite types with the load capacity (0-540KN). The resulting
sample after tensile test is shown in Figure 7.
Length=20 cm
Thickness= 5 mm
International Journal of Energy and Environment (IJEE), Volume 6, Issue 5, 2015, pp.499-516
ISSN 2076-2895 (Print), ISSN 2076-2909 (Online) ©2015 International Energy & Environment Foundation. All rights reserved.
504
The environmental conditions of the laboratory that the tensile test done in it are (Temperature = 25 C
and Moisture = 40%). The results that obtained from the tensile test for the specimens are shown in
Figure 8.
Figure 5. Tensile test samples preparing
Figure 6. Tensile test machine and processes of test
Figure 7. Tensile test samples after testing
International Journal of Energy and Environment (IJEE), Volume 6, Issue 5, 2015, pp.499-516
ISSN 2076-2895 (Print), ISSN 2076-2909 (Online) ©2015 International Energy & Environment Foundation. All rights reserved.
505
Figure 8. Tensile test result of short reinforcement glass fiber, glass reinforcement powder, and epoxy
resin composite (sample 5)
2.4 Vibration test of plate samples
The vibration test involves studying the fundamental natural frequency of the composite plate samples.
The made of vibration plate sample are shown in Figure 2. The dimensions of vibration plate samples
used are, as shown in Figure 9,
= + 5
,
= + 5 () (2)
For, = 25 ,
= 25 + 5 () = 30
= 5 , and different aspect ratio,
= 1,1.5 (3)
Then,
International Journal of Energy and Environment (IJEE), Volume 6, Issue 5, 2015, pp.499-516
ISSN 2076-2895 (Print), ISSN 2076-2909 (Online) ©2015 International Energy & Environment Foundation. All rights reserved.
506
= + 5
= 37.5 + 5
= 42.5 (4)
where, a, b, are length and width,
thickness
of plate, respectively.
And,
,
are the total experimental length, width of plate respectively.
Figure 9. Shape and dimensions of vibration test sample
The vibration plate samples studied are supported with different boundary conditions SSSS, SSCC,
SSFF, CCFF, CFFF,CCCC as shows in the Figure 10, of different aspect ratios, (b/a=1, 1.5)
1. Simply supported along all edges (SSSS)
2. Simply-Free Support Edges (SSFF)
3. Clamped-Free Support Three Edges (CFFF)
4. Simply-Clamped Supported Edges (SSCC)
5. Clamped-Free Supported Edges (CCFF)
6. Clamped supported along all edges (CCCC)
The flowchart in Figure 11, shows the sketch of the structure rig test. Vibration structure rig shown in
Figure 12, is used to evaluate the fundamental natural frequency with different parameters and boundary
condition.
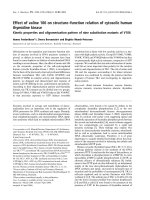
The machine and other parts used in the vibration structure rig are shows in Figure 13 (a, b, c, d, e) . The
fixed plate sample and accelerometer part and make impact location point on the plate shown in Figure
14, and the vibration test composite Plates with different boundary conditions are shown in Figures 15.
The vibration test machine and rig involved the following parts:
1. Structure to support the plate sample, made of steel plate with (10 mm) thickness, and other
dimensions as shown in Figure 13 (a).
2. Digital storage oscilloscope, model (ADS 1202CL+) and serial No.01020200300012 as shown in
Figure13 (b), with the information; maximum frequency (200 MHz), maximum read of sample per
second (500 MSa/s), FFT spectrum analysis and two input channels.
3. Amplifier, type (480E09), as shown in Figure 13 (c). The amplifier measures the response signal
from accelerometer and gives output signal to the digital storage oscilloscope.
4. Impact hammer tool, model (086C03) (PCB Piezotronics vibration division), as shown in Figure 13
(d), with the information about measurement range (2224 N), resonant frequency (≥ 22 KHz),
excitation voltage (20 to 30 VDC), constant current excitation (2 to 20 mA), output bias voltage (8 to
14 VDC), discharge time constant (2000 sec), hammer mass (0.16 kg), head diameter (1.57cm), tip
diameter (0.63 cm), and hammer length (21.6 cm).
5. Accelerometer, model (352C68), as shown in Figure 13 (e), with The information regarding this
accelerometer are: sensitivity (10.2 mV/(m/s
2
)), measurement range (491 m/s
2
), mounted resonant
frequency ( 35 kHz), non-linearity (≤ 1%).
6. Two positions indicated on the tested plates: central and lateral to apply five impulses to excite the
plate on each position by an impact hammer. As shown in Figure 16.
5 mm
2.5 cm
2.5 cm
b
t
a
t
b
a
2.5 cm
2.5 cm
y
x
International Journal of Energy and Environment (IJEE), Volume 6, Issue 5, 2015, pp.499-516
ISSN 2076-2895 (Print), ISSN 2076-2909 (Online) ©2015 International Energy & Environment Foundation. All rights reserved.
507
Impulse force test hammer is adapted for adapts FFT analysis of structure behavior testing. Impulse
testing of the dynamic behavior of mechanical structure involves striking the test object with the force-
instrumented hammer, and measuring the resultant motion with an accelerometer. Then analysis of
response signal is read from digital storage oscilloscope to FFT function by using sig-view program to
transform from t-domain into ω-domain and get the fundamental natural frequency of the plate Figure 17.
Figure 10. Different boundary conditions of vibration test plate
Figure 11. Flowchart of vibration structure rig
Output Signal
Accelerometer
Input Signal
Impact Hammer
Amplifiers
Digital Storage
Oscilloscope
USB Memory
Structure to Support Plate
Sample
Plate
x
International Journal of Energy and Environment (IJEE), Volume 6, Issue 5, 2015, pp.499-516
ISSN 2076-2895 (Print), ISSN 2076-2909 (Online) ©2015 International Energy & Environment Foundation. All rights reserved.
508
Figure 12. Rig and vibration test machine of composite plate structure
Figure 13. Vibration test machine parts
Bolt to install accelerometer
on plate specimen
(d) Impact hammer part
(e) Accelerometer part
(b) Digital storage oscilloscope
part
(c) Amplifier
part
(a) Structure rig for vibration test
Impact Hammer
Accelerometer
Storage Oscilloscope
Amplifiers
Output Signal
Structure Rig
Supported
Plate Sample
International Journal of Energy and Environment (IJEE), Volume 6, Issue 5, 2015, pp.499-516
ISSN 2076-2895 (Print), ISSN 2076-2909 (Online) ©2015 International Energy & Environment Foundation. All rights reserved.
509
Figure 14. Fixed plate sample and accelerometer part and impact location point for vibration test
Figure 15. The vibration test composite plates with different boundary conditions
Figure 16. The central and lateral positions of e- accelerometer part on the vibration tested plat
SSSS
SSCC
CCCC
CCFF
SSFF
CFFF
(a) Fixed the plate sample
(b) Fixed the Accelerometer Part and impact location point for various boundary conditions of plate
sample
International Journal of Energy and Environment (IJEE), Volume 6, Issue 5, 2015, pp.499-516
ISSN 2076-2895 (Print), ISSN 2076-2909 (Online) ©2015 International Energy & Environment Foundation. All rights reserved.
510
Figure 17. Sig-view program for FFT analysis function
3. Results and discussions
The results of isotropic hyper composite plate included the experimental values of the mechanical
properties and natural frequency of short reinforcement composite plate combined from
reinforcement(short glass fiber , glass powder reinforcement) and epoxy resin matrix material with
different volume fraction and two aspect ratios (AR=1 and 1.5), for different boundary conditions. In
addition to, compare the results evaluated with experimental test of natural frequency and mechanical
properties of simple supported plate with theoretical results for other research, Muhannad Al-Waily [7].
3.1 Verification case study
The comparison of mechanical properties and natural frequency for isotropic hyper composite plate
studied between experimental presented results and theoretical results presented by Muhannad Al-Waily,
[7], for simply supported plate with aspect ratio (AR=1, ( = = 25 ) and ( = 5 )) and
different volume fraction of resin, powder and short fiber, as shown in Tables 2 and 3.
Table 2. Comparison of experimental mechanical properties results with theoretical mechanical
properties results of Muhannad Al-Waily, [7]
Short fiber volume
fraction
%
Powder volume
fraction
%
Risen volume
fraction
%
E (Gpa)
experimentally
E (Gpa)
theoretically, [7]
Error
%
30
0
70
15.352
14.005
8.77
20
10
12.325
12.058
2.17
30
10
60
16.869
16.107
4.52
20
20
14.865
14.075
5.32
30
20
50
19.232
18.786
2.32
20
30
17.286
16.741
3.15
Table 3. Comparison of experimental natural frequency results, of simply supported plate and aspect
ratio (AR=1), with theoretical natural frequency results of Muhannad Al-Waily, [7]
Short fiber volume
Fraction
%
Powder volume
fraction
%
Risen volume
fraction
%
(rad/sec)
experimentally
(rad/sec)
theoretically, [7]
Error
%
30
0
70
1478.7
1347.014
8.91
20
10
1327.05
1236.749
6.81
30
10
60
1523.84
1374.748
9.78
20
20
1394.7
1274.106
8.65
30
20
50
1584.3
1418.263
10.48
20
30
1431.4
1329.897
7.09
From Table 2; the maximum error, between experimental presented mechanical properties results and
theoretical results; [7], about 8.77% (with 30% short reinforcement fiber, 0% powder reinforcement and
70% resin materials) and the minimum error about 2.17% (with 20% short reinforcement fiber, 10%
powder reinforcement and 70% resin materials). Also, Table 3 shown the maximum error between
experimental presented natural frequency of simply supported plate results and theoretical results; [7],
Accelerometer
Signal
FFT Signal
Natural Frequency
International Journal of Energy and Environment (IJEE), Volume 6, Issue 5, 2015, pp.499-516
ISSN 2076-2895 (Print), ISSN 2076-2909 (Online) ©2015 International Energy & Environment Foundation. All rights reserved.
511
about 10.48% (with 30% short reinforcement fiber, 20% powder reinforcement and 50% resin materials)
and the minimum error about 6.81% (with 20% short reinforcement fiber, 10% powder reinforcement
and 70% resin materials).The tables had shown the good agreement of the mechanical properties and
natural frequency results between presented work and other research.
3.2 The mechanical properties of composite plates
The experimental values of mechanical properties of hyper composite plate studied are shown in Table 4.
Were the modulus of elasticity and the yield stress measured.
Table 4. Mechanical properties of short hyper composite materials combined of different reinforcement
powders and fiber and epoxy resin matrix
Sample
No.
Volume fraction of
short fiber
%
Volume fraction of
powder fiber
%
Volume fraction
of risen
%
E (Gpa)
Y (Mpa)
1
30
0
70
15.352
152.603
2
20
10
12.325
104.38
3
10
20
10.41
50.1
4
40
0
60
17.218
215.64
5
30
10
16.869
117.28
6
20
20
14.865
95.07
7
10
30
12.573
41.96
8
40
10
50
19.984
134.96
9
30
20
19.232
108.45
10
20
30
17.286
65.43
11
10
40
14.128
34.8
The experimental values of tensile test results showed that the modulus of elasticity of samples 8 and 9
were the maximum at volume fraction of short fiber
= 40,30% respectively and the yield stress of
sample 4 was more than that of other samples, were three samples of composite plates tested and the
experimental values of tensile test results average to get the modulus of elasticity and the yield stress
values.
3.3 Vibration results
The experimental vibration test results of isotropic hyper composite plate measured, the evaluation the
natural frequency of composite plate structure with different aspect ratios (AR=1 and 1.5), and six
different boundary conditions (SSSS, SSFF, CFFF, SSCC, CCFF,CCCC), Included reading the signal to
FFT function by using sig-view program to get the fundamental natural frequency, as shown in Tables 5
to 7. The experimental values of fundamental natural frequency were averaged by indicating two
positions: central and lateral on the tested plates and applying five impulses to excite the plate on each
position by an impact hammer.
Table 5 shown the volume fraction of resin, powder and short fiber reinforcement of samples studied in
experimental investigation to evaluate the natural frequency. And, Tables 6 and 7 shows the natural
frequency of plate samples studied with experimental investigation with various volume fraction of resin
and reinforcement and different boundary conditions (SSSS, SSFF, CFFF, SSCC, CCFF,CCCC) of plate,
for aspect ratio of plate AR=1 and 1.5, respectively.
Figures 18 to 22, shows the effect of reinforcement powder and short fiber on the natural frequency of
different boundary conditions plate with different aspect ratio of composite plate. When, the dimensions
of composite plate as in eqs. 2 to 4 and the mechanical properties and volume fraction of resin and
reinforcements powder and short powder as in Table 4.
It can concluded that when the volume fraction of short fiber (
= 40%) at sample 8, maximum natural
frequency was occur (due to the maximum modulus of elasticity (stiffness) occur with sample 8), and,
the natural frequency increasing with increase the reinforcement powder or short fiber (since the
increasing of short fiber causes increase of the modulus of elasticity (stiffness) of plate), also, the natural
frequency increasing with increase the short fiber more than the increasing of natural frequency when
increase the powder reinforcement, since the effect of short fiber more than the effect of powder
International Journal of Energy and Environment (IJEE), Volume 6, Issue 5, 2015, pp.499-516
ISSN 2076-2895 (Print), ISSN 2076-2909 (Online) ©2015 International Energy & Environment Foundation. All rights reserved.
512
reinforcement. All figures showed that the natural frequency for plate with aspect ratio (AR=1) was
higher than that natural frequency for plate with aspect ratio (AR=1.5), since the stiffness/weight for
plate with AR=1 more than stiffness/weight of plate with AR=1.5.The Clamped-Supported along all
Edges (CCCC) boundary condition showed the highest values of the natural frequency, but the Clamped-
Free Supported (CFFF) boundary condition showed the lowest values.
Table 5. The Sample number, sample name , volume fraction of components
Sample
Number
Sample
Name
Volume Fraction
of Short Fiber
%
Volume Fraction
of powder fiber
%
Reinforcement
Volume Fraction
% +
%
Volume Fraction
of Risen
%
1
Sample 1
30
0
30
70
2
Sample 2
20
10
3
Sample 3
10
20
4
Sample 4
40
0
40
60
5
Sample 5
30
10
6
Sample 6
20
20
7
Sample 7
10
30
8
Sample 8
40
10
50
50
9
Sample 9
30
20
10
Sample 10
20
30
11
Sample 11
10
40
Table 6. Experimental natural frequency results for isotropic hyper composite plate with different
reinforcements short fiber and powder effect for various boundary conditions plate, with AR=1.
Sample
Number
Sample
Name
Natural Frequency (rad/sec)
CCCC
CCFF
CCSS
CFFF
SSFF
SSSS
1
Sample 1
2742.12
1654.81
2215.36
941.38
1489.45
1478.7
2
Sample 2
2500.2
1520.69
2103.41
826.41
1412.34
1327.05
3
Sample 3
2154.31
1310.24
1790.87
712.55
1203.14
1176.3
4
Sample 4
2856.64
1920.58
2602.35
1021.35
1623.24
1604.8
5
Sample 5
2787.9
1636.27
2102.54
924.96
1540.28
1523.84
6
Sample 6
2605.14
1580.22
2086.32
867.35
1480.38
1394.7
7
Sample 7
2354.28
1485.39
1858.64
872.46
1335.27
1263
8
Sample 8
3145.2
1978.24
2517.32
1025.36
1779.35
1680.1
9
Sample 9
3025.68
1921.3
2344.24
984.24
1542.21
1584.3
10
Sample 10
2601.86
1635.27
2284.27
920.37
1448.37
1431.4
11
Sample 11
2500.35
1518 32
1987.35
931.24
1356.23
1316.2
Table 7. Experimental natural frequency results for isotropic hyper composite plate with different
reinforcements short fiber and powder effect for various boundary conditions plate, with AR=1.5
Sample
Number
Sample
Name
Natural Frequency (rad/sec)
CCCC
CCFF
CCSS
CFFF
SSFF
SSSS
1
Sample 1
1986.34
739.64
1324.17
864.87
1096.21
1091.2
2
Sample 2
1940.23
643.86
1203.16
745.22
985.14
987.6
3
Sample 3
1730.36
587.42
1028.39
670.38
826.84
850.02
4
Sample 4
2235.23
846.49
1399.35
875.99
1256.201
1247.2
5
Sample 5
2125.34
784.87
1267.14
813.62
1130.17
1146.67
6
Sample 6
1850.15
745.21
1201.39
815.76
988.34
986.4
7
Sample 7
1598.36
698.22
1107.36
684.82
896.18
921.9
8
Sample 8
2310.32
892.34
1482.14
976.43
1176.32
1229
9
Sample 9
2211.86
789.66
1350.24
853.69
1116.34
1206.96
10
Sample 10
2101.98
725.14
1305.1
786.74
1023.37
1177.3
11
Sample 11
1872.47
675.14
1201.23
746.48
986.01
948.07
International Journal of Energy and Environment (IJEE), Volume 6, Issue 5, 2015, pp.499-516
ISSN 2076-2895 (Print), ISSN 2076-2909 (Online) ©2015 International Energy & Environment Foundation. All rights reserved.
513
Figure 18. Experimental natural frequency with powder reinforcement effect and various plate boundary
condition, for short fiber volume fraction
= 10% and various plate aspect ratio
Figure 19. Experimental natural frequency with powder reinforcement effect and various plate boundary
condition, for short fiber volume fraction
= 20% and various plate aspect ratio
Figure 20. Experimental natural frequency with powder reinforcement effect and various plate boundary
condition, for short fiber volume fraction
= 30% and various plate aspect ratio
AR=1
AR=1.5
AR=1
AR=1.5
AR=1
AR=1.5
International Journal of Energy and Environment (IJEE), Volume 6, Issue 5, 2015, pp.499-516
ISSN 2076-2895 (Print), ISSN 2076-2909 (Online) ©2015 International Energy & Environment Foundation. All rights reserved.
514
Figure 21. Experimental natural frequency with reinforcement short fiber effect and various plate
boundary condition, for powder reinforcement volume fraction
= 10% and various aspect ratio
Figure 22. Experimental natural frequency with reinforcement short fiber effect and various plate
boundary condition, for powder reinforcement volume fraction
= 20% and various aspect ratio
4. Conclusions
The main conclusions of this work are,
1. The comparison between the presented work and other research had shown the good agreement of
mechanical properties and natural frequency results. And, the increasing of reinforcement powder
cause increases the modulus of elasticity of hyper plate and increasing the natural frequency of plate.
2. The modulus of elasticity of hyper composite plate was increased with the increase of short fiber
volume fraction (
%).
3. The yield stress decreased with the increase of powder volume fraction (
%) of hyper composite
material.
4. The natural frequency of isotropic hyper composite materials plate was increased with the increase of
short fiber volume fraction were the volume fraction of short fiber (
= 40%) at samples 8,
maximum natural frequency had occur.
5. The clamped-supported along all edges (CCCC) boundary condition showed the highest values of
the natural frequency for both aspect ratios, but the Clamped-Free Support Three Edges (CFFF)
boundary condition showed the lowest values for aspect ratio(AR=1) and Clamped-Free Supported
(CCFF) for aspect ratio(AR=1.5).
AR=1
AR=1.5
AR=1
AR=1.5
International Journal of Energy and Environment (IJEE), Volume 6, Issue 5, 2015, pp.499-516
ISSN 2076-2895 (Print), ISSN 2076-2909 (Online) ©2015 International Energy & Environment Foundation. All rights reserved.
515
6. It was observed that the natural frequency for aspect ratio (AR=1) was higher than that for aspect
ratio (AR=1.5).
Acknowledgements
The authors would like to thank the Departments of Mechanical Engineering and material Engineering,
Kufa University. And Department of Mechanical Engineering, Karbala University for supporting tests
facilities of this study.
References
[1] Sharma. A. K., Mittal. N.D. ‘Reviw on stress and vibration analysis of composite plate’ Journal
Applied Sci., Vol. 10, No. 23, pp. 3156-3166, 2010.
[2] Gay D., Hoa S. V., Tsai S. W. ‘Composite Materials Design and Applications’ CRC Press LLC,
2003.
[3] Reddy J. N. ‘Mechanics of Laminated Composite Plates and Shells’ CRC Press LLC, 2004.
[4] Nayak P. ‘Vibration Analysis of Woven Fiber Glass/Epoxy Composite Plates’M.Sc. Thesis of
Technology in Civil Engineering (Structural Engineering), Department of Civil Engineering
National Institute of Technology Rourkela, Orissa, India, 2008.
[5] Mishra I., Sahu S. K. ‘An Experimental Approach to Free Vibration Response of Woven Fiber
Composite Plates under Free-Free Boundary Condition’ International Journal of Advanced
Technology in Civil Engineering, Vol. 1, No. 2, pp. 67-72, 2012.
[6] Muhsin J. Jweeg, Hammood A. S., Muhannad Al-Waily ‘Experimental and Theoretical Studies of
Mechanical Properties for Reinforcement Fiber Types of Composite Materials. International
Journal of Mechanical & Mechatronics Engineering, 12, 04, 62-75, 2012.
[7] Muhannad Al-Waily ‘Theoretical and Numerical Analysis Vibration Study of Isotropic Hyper
Composite Plate Structural. International Journal of Mechanical and Production Engineering
Research and Development, 3, 5, 145-164, 2013.
[8] D3039/D03039M. Standard Test Method for Tensile Properties of Polymer Matrix Composite
Materials. Annual Book of ASTM Standards, 15, 1995.
Abdulkareem Abdulrazzaq Alhumdany, Ph.D. In Mechanical Engineering, Mechanical Engineering
Department, University of Technology, Iraq. Specialization: Applied Mechanics, Ph.D. thesis title,
"Analysis of spur gear set performance under el as to hydrodynamic lubrication", Graduation Date:
2006. M.Sc. In Mechanical Engineering, College of Engineering/University of Baghdad, Iraq.
Specialization: Applied Mechanics, M.Sc. thesis title "Closed form solutions for the free vibrational
characteristics of open profile circular cylindrical shells", Graduation Date: 1985.B.Sc. In Mechanical
Engineering, College of Engineering/University of Baghdad, Iraq. Specialization: General Mechanics,
Graduation Date: 1981.Research Interests, Vibration Analysis, Stress Analysis under Static and
Dynamic Loading.
E-mail address:
Muhannad Al-Waily, Ph.D. in Mechanical Engineering, College of Engineering, Alnahrain University,
Iraq. Specialization: Applied Mechanics- Vibration Analysis Study, Composite Material Study-Crack
Study, Health Monitoring, Graduation Date: 2012. M.Sc. In Mechanical Engineering, College of
Engineering/University of Kufa/Iraq. Specialization: Applied Mechanics- Vibration Analysis Study,
Composite Material Study-Stress Analysis Study, Graduation Date: 2005. B.Sc. In Mechanical
Engineering/ College of Engineering/University of Kufa, Iraq. Specialization: General Mechanics,
Graduation Date: 2002.Research Interests, Vibration Analysis, Stress Analysis under Static and
Dynamic Loading, Composite Materials, Fatigue and Creep Analysis of Engineering Materials,
Mechanical Properties of Engineering Materials, Control and Stability of Mechanical Application,
Damage (Crack and Delamination Analysis), Buckling Analysis, and other mechanical researches.
E-mail address:
International Journal of Energy and Environment (IJEE), Volume 6, Issue 5, 2015, pp.499-516
ISSN 2076-2895 (Print), ISSN 2076-2909 (Online) ©2015 International Energy & Environment Foundation. All rights reserved.
516
Mohammed Hussein Kadhim, B.Sc. In Mechanical Engineering/ College of Engineering, University
of Kufa, Iraq. Specialization: General Mechanics, Graduation Date: 2013. He is pursuing M.SC. Degree
in Mechanical Engineering from Karbala University. Research Interests: Vibration Analysis, Composite
Materials, and Mechanical Properties of Engineering Materials.
E-mail address: