HV substation earth grid commissioning using current injection test (CIT) method worst case scenario determination
Bạn đang xem bản rút gọn của tài liệu. Xem và tải ngay bản đầy đủ của tài liệu tại đây (155.3 KB, 10 trang )
INTERNATIONAL JOURNAL OF
ENERGY AND ENVIRONMENT
Volume 6, Issue 4, 2015 pp.347-356
Journal homepage: www.IJEE.IEEFoundation.org
ISSN 2076-2895 (Print), ISSN 2076-2909 (Online) ©2015 International Energy & Environment Foundation. All rights reserved.
HV substation earth grid commissioning using current
injection test (CIT) method: Worst case scenario
determination
M. Nassereddine, J. Rizk, M. Nagrial, A. Hellany
School of Computing, Engineering & Mathematics University of Western Sydney, Australia.
Abstract
The existing of the High Voltage (HV) infrastructure creates a unique set of safety circumstances. The
earthing system is one of the main elements to mitigate any unsafe conditions. Commissioning the earth
grid certifies that the implemented system fulfills to the pertinent necessities. This paper endeavors to
present vital information on how to perform the earth grid commissioning of an HV infrastructure. This
paper will minutiae the minimum needs to guarantee the test will symbolize the actual fault case that the
design was based on. A flow chart diagram is established and presented in this paper, which allows the
determination of the most suitable injection route. The results of the case study are discussed, and the
results are shown in this paper.
Copyright © 2015 International Energy and Environment Foundation - All rights reserved.
Keywords: Earth grid; EPR, Fault current distribution; High voltage; OHEW; Split factor; Transmission
mains earth grid.
1. Introduction
Electrical infrastructure upgrade is required to meet the demands increase. The upgrade could be in the
form of refurbishing existing infrastructure or installing an additional one. The new infrastructure
involves the installation of new transmission lines and new substations. These new assets could be
located within proximity to the residential area. Also, part of these infrastructures could be accessible to
the generic public. Mishandling HV infrastructure can cause damages to properties and may inflict
injuries and be fatal. High voltage infrastructure necessitates earthing design to guarantee the safety and
the acquiescence of the system to confined standards and regulations. Earthing system presents a safe
working environment for workers and people passing by during a fault or malfunction of the power
system.
During the design stage of the earth grid, the designer collects all the possible information from soil
resistivity, services in the area, and the layout of the proposed substation. This information may not be
very accurate thus it will not symbolize the real case. For example, it is hard to obtain an accurate soil
resistivity structure to represents the local area. Therefore, numerous designers follow the single layer
structure approach, while others follow the two-layer soil structure approach [1, 2]. The output of these
two approaches provides a slightly different earthing system data. Also, within a developed area, it is not
possible for the designer to capture the entire existing infrastructure during the design stage. This
condition forces the requirements to commissioning the design earthing grid prior the commissioning of
the HV infrastructure. During the earthing system commissioning, the tester simulates the actual fault
International Journal of Energy and Environment (IJEE), Volume 6, Issue 4, 2015, pp.347-356
ISSN 2076-2895 (Print), ISSN 2076-2909 (Online) ©2015 International Energy & Environment Foundation. All rights reserved.
348
that represent the worst case scenario. The low-frequency current injection test is used to commissioning
and test the integrity of the installed earthing system [3].
The current injection test simulates a fault condition by injecting an offset frequency [4]. It is important
to choose the injection path where the worst case scenario is presented. The works in [5] show the critical
of the injection path. Also, the works show the critical of the overhead earth wire (OHEW) when it
comes to fault current distribution.
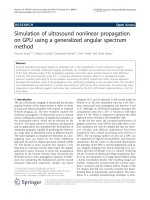
The works in this paper endeavour to provide information in regards to the fault current distribution
under substation fault, as well as feeder fault. This information helps determining the injection path that
represents the worst case scenario. The correct path ensures accurate measurements for the step, touch
and transfer voltages. A case study is included.
2. Theoretical study
The works in this paper enhances the CIT diagram as per [5]. The updated diagram is shown in Figure 1.
The works in this section focus on the analysing the fault current distribution to determine the correct
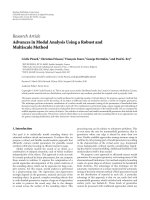
path that represents the worst case scenario. The CIT is based on injecting current and measure the
voltage rise due to the injection current magnitude. Figure 2 represents the CIT injection circuit.
Under substation fault and the presence of the auxiliary path, the fault current splits into two sub-currents
[6]:
• Substation grid current
• Auxiliary path current
2.1 Substation current
Equation 1 represents the substation current under the presence of the auxiliary path:
ffg
II
δ
=
(1)
where:
g
I
is the substation grid current,
f
I
is the fault current,
f
δ
is the split factor as defined in
equation 2 [7].
ginOHEW
inOHEW
s
gw
f
ZZ
Z
z
z
+
⎟
⎟
⎠
⎞
⎜
⎜
⎝
⎛
−
=
−
−
1
δ
(2)
where:
gw
z is the mutual impedance between the faulted phase and the auxiliary path,
s
z is the auxiliary
path self-impedance,
g
Z is the faulted substation earth grid resistance,
inOHEW
Z
−
the input impedance of
the auxiliary path.
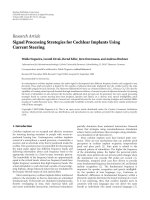
Figure 3 shows the split current circuit under the presence of the OHEW. The input impedance of the
OHEW depends on its condition:
• Finite or Infinite Line
• Continuous or non-continuous line
Under a finite system, the source substation grid resistance is taken into consideration during the
calculations of the input impedance. Based on existing research, the infinite length of the OHEW can be
found using equation 3 [8].
2
p
s
z
z
l
(3)
where:
s
z
is defined by
s
s
s
L
Z
z =
,
p
z
is defined by
spp
LZz =
,
p
Z
is the pole grid resistance in ohms,
s
Z is the OHEW self-impedance per span length in ohms.
International Journal of Energy and Environment (IJEE), Volume 6, Issue 4, 2015, pp.347-356
ISSN 2076-2895 (Print), ISSN 2076-2909 (Online) ©2015 International Energy & Environment Foundation. All rights reserved.
349
Figure 1. Current injection test diagram
International Journal of Energy and Environment (IJEE), Volume 6, Issue 4, 2015, pp.347-356
ISSN 2076-2895 (Print), ISSN 2076-2909 (Online) ©2015 International Energy & Environment Foundation. All rights reserved.
350
Figure 2. Current injection test layout for grid resistance determination
Figure 3. HV transmission main with return path
Under the finite continuous condition, the second substation grid system is part of the input impedance.
Equation 4 can be used to calculate Z-neec and the input impedance can be found using equation 5.
International Journal of Energy and Environment (IJEE), Volume 6, Issue 4, 2015, pp.347-356
ISSN 2076-2895 (Print), ISSN 2076-2909 (Online) ©2015 International Energy & Environment Foundation. All rights reserved.
351
()
()
Ps
PPs
NEECe
NZZ
NN
ZZZNN
Z
+
−
++
=
−
6
1
15.0
2
2
(4)
(
)
22
//
gsneeceinput
ZZZZ +=
−
(5)
where:
N is the number of poles,
2s
Z is the OHEW self-impedance for the last span before the
substation in ohms,
2g
Z is the source substation earth grid resistance in ohms.
Under the finite non-continuous condition, equation 4 can be used to compute the input impedance.
Under the infinite system, the fault at the substation cannot see the earth grid of the source; it can only
see a section of the OHEW system. Equation 6 can be used to compute the input impedance.
ps
ss
ZZ
ZZ
Z ++=
∞
42
2
(6)
In practice,
Ps
ZZ ≺≺
therefore, the input impedance of an infinite line can be expressed in equation (7).
ps
s
ZZ
Z
Z +=
∞
2
(7)
Based on equations 1 to 7, the substation current can be estimated, and the path for the worst case
scenario can be finalised.
2.2 Transmission pole current
The fault current split into the OHEW input system as shown in the previous section. Figure 4 shows the
fault current distribution along the transmission line OHEW.
Figure 4. Fault current distribution along the OHEW system
According to [9, 10], the current remaining in the OHEW and doesn’t discharge to the ground at the pole
grid is found using equation 8:
s
gw
fremainOHEW
z
z
II =
−
(8)
According to [11], the pole grid current can be found using equations 9 and 10 for an infinite condition:
International Journal of Energy and Environment (IJEE), Volume 6, Issue 4, 2015, pp.347-356
ISSN 2076-2895 (Print), ISSN 2076-2909 (Online) ©2015 International Energy & Environment Foundation. All rights reserved.
352
f
PinOHEW
inOHEW
s
gw
e
P
I
ZZ
Z
z
z
I
+
⎟
⎟
⎠
⎞
⎜
⎜
⎝
⎛
−
=
−
−
1
1
δ
(9)
1
1
P
n
PinOHEW
P
Pn
I
ZZ
Z
I
−
−
⎥
⎦
⎤
⎢
⎣
⎡
+
=
(10)
where: n is the pole numbers where the line is still under infinite condition. It is noted that n cannot be
less than 1.
e
δ
is the OHEW split factor [12],
P
Z
is the pole grid resistance in ohms.
Please note: equations 8, 9 and 10 are for the case where the fault is on the line where OHEW is present
and infinite. The discharge current under this condition can be found using equation 11:
ginOHEW
s
gw
g
fedisch
ZZ
z
z
Z
II
+
⎟
⎟
⎠
⎞
⎜
⎜
⎝
⎛
−
=
−
1
arg
(11)
For a substation that has one line with OHEW and another line without OHEW, a fault at the substation
due to the line with no OHEW forces the current magnitude to be discharged on the line with the OHEW
as per equation 12:
ginOHEW
g
fedisch
ZZ
Z
II
+
=
−
arg
(12)
Based on equations 11 and 12, the worst case scenario on transmission poles is presented for a fault
located on the other feeding line with no OHEW. For example, 110/11kV zone substation, the 110kV has
a return OHEW (continuous) with 7kA SLG fault current. The 11kV in the field has no Return Path and
3kA fault current.
During the 11kV fault, the substation grid current is 3kA. However, under 110kV fault, the substation
grid current is 7kA multiplied by the Split Factor. For split factor of 0.4, the substation grid current is
2.8kA which is lower than the 11kV fault contribution. However, if the split factor is 0.6, the substation
grid current under the 110kV fault is 4.2kA which is higher than the 11kV fault contribution.
It should be noted, where the substation Grid current for the 110kV fault is 4.2kA, the 11kV fault
contribution which is presented by the 3kA, could represents the worst case scenario for the transmission
poles located within the finite length of the substation. Furthermore, the route location of the 11kV and
the location of the fault play an important part to determine the behavior of the fault current under 11kV
fault.
3. Theoretical study discussion
From the theoretical study, it is identified that the worst case scenario for substation can be different to
the transmission line. When a substation earth grid is commissioned with one of the fault sources has an
OHEW while the second one without the OHEW, equation 13 can be used to assist in determining the
worst case scenario:
⎟
⎟
⎠
⎞
⎜
⎜
⎝
⎛
−=
−−−−
s
gw
OHEWwithfOHEWnof
z
z
II 1
(13)
where:
OHEWnof
I
−−
is the fault current from the source without the OHEW,
OHEWwithf
I
−−
is the fault
current from the source with the OHEW.
International Journal of Energy and Environment (IJEE), Volume 6, Issue 4, 2015, pp.347-356
ISSN 2076-2895 (Print), ISSN 2076-2909 (Online) ©2015 International Energy & Environment Foundation. All rights reserved.
353
To determine
⎟
⎟
⎠
⎞
⎜
⎜
⎝
⎛
−
s
gw
z
z
1
, the following steps can be followed:
• Complete the current injection test using the line with the OHEW
• Measure the substation grid resistance and the input impedance of the OHEW
• Measure the substation earth grid current
• Use equations 1 and 2 to determine
⎟
⎟
⎠
⎞
⎜
⎜
⎝
⎛
−
s
gw
z
z
1
If equation 14 is valid, the worst case scenario for the transmission line under substation fault is
represented by the fault on the feeder without the OHEW. Otherwise the worst case scenario is presented
by the fault sourced by the transmission line with the OHEW.
⎟
⎟
⎠
⎞
⎜
⎜
⎝
⎛
−
−−−−
s
gw
OHEWwithfOHEWnof
z
z
II 1
(14)
The worst case scenario for the substation is represented by the fault on the feeder without the OHEW if
equation 15 is valid:
ginOHEW
inOHEW
s
gw
OHEWwithfOHEWnof
ZZ
Z
z
z
II
+
⎟
⎟
⎠
⎞
⎜
⎜
⎝
⎛
−
−
−
−−−−
1
(15)
Determining the worst case scenario ensures accurate measurement of the actual step, touch and transfer
voltages which leads to accurate comparisons with the allowable safety limits as detailed in section 4.
Furthermore, the enhanced diagram aid in determining the correct path when it comes to AC interference
study if applicable. The works in [5], contain more information regarding the diagram in Figure 1.
4. Safety requirements
The measured touch and step voltage shall be assessed against the allowable safety limits. The step and
touch voltage can be determined from the two equations 16 and 17. These two equations are calculated
using the resistance of a 50Kg person when assessing the public access area. Equations 18 and 19
calculate step and touch voltage using a 70Kg body weight [13, 14].
t
C
V
ss
touch
ρ
174.0116 +
=
(16)
t
C
V
ss
step
ρ
696.0116 +
=
(17)
t
C
V
ss
touch
ρ
236.0157 +
=
(18)
t
C
V
ss
touch
ρ
942.0157 +
=
(19)
09.02
109.0
1
+
⎟
⎟
⎠
⎞
⎜
⎜
⎝
⎛
−
−=
s
s
s
h
C
ρ
ρ
(20)
International Journal of Energy and Environment (IJEE), Volume 6, Issue 4, 2015, pp.347-356
ISSN 2076-2895 (Print), ISSN 2076-2909 (Online) ©2015 International Energy & Environment Foundation. All rights reserved.
354
where: Cs is the derating factor relating to surface layer thickness and resistivity,
s
ρ
is the top surface
layer, t is the primary clearance time.
Determining the soil structure can be done by measuring the soil conductivity using Wenner method [15,
16]
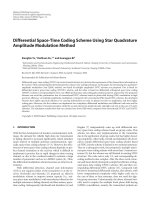
EPR contour can be determined using the maximum EPR and the measured voltage in Figure 5. Equation
21 represents the maximum EPR and equation 22 represents the EPR contour. This process can be
repeated for different directions to ensure that accurate data is obtained to draw the EPR contour of the
tested earth grid. Figure 5 represents the EPR contour computation; the EPR is high at the substation and
decreases as the distance from the tested grid increases.
gridGrid
ZIEPR ×=
(21)
5max figcontour
VEPREPR −=
(22)
Figure 5. EPR contour against the separation distance
5. Case study
A new zone substation “A” is being constructed. The zone substation is fed by a single 132kV
transmission line. Two distribution feeders are going out of the substation. Below are the characteristics
of the design:
• Transmission Single Line to Ground Fault Current is 6kA
• Distribution line Single Line To Ground Fault Current is 3.8kA
• Substation earth grid of 0.2 ohms
• Clearance times; both faults on transmission and distribution lines has 500ms clearance time
• Two Soil Resistivity structures is uniform; 100 ohm.m
• Delta configuration is used for the transmission pole conductor arrangement
Follow the paper works, the current injection test was arranged for the transmission line, the substation
grid resistance and the OHEW input impedance were measured, the magnitudes of these resistances are
shown below:
21.0=
g
Z
89.0=
OHEW
Z
International Journal of Energy and Environment (IJEE), Volume 6, Issue 4, 2015, pp.347-356
ISSN 2076-2895 (Print), ISSN 2076-2909 (Online) ©2015 International Energy & Environment Foundation. All rights reserved.
355
Substation grid current was measured to be 3.125kA
The following computation is obtained by using equations 1 and 2:
643.01 =
⎟
⎟
⎠
⎞
⎜
⎜
⎝
⎛
−
s
gw
z
z
Applying equation 13:
OHEWnof
I
−−
=
×
86.3643.06
Based on this analysis, the worst case scenario for the transmission pole under substation fault is
presented by the transmission line fault. However, the substation fault worst case scenario is shown by
the distribution fault. It is assumed that the entire distribution fault current only utilizes the substation
earth grid as a return path to the source transformer. This assumption represents a conservative approach.
For the substation analysis, the step and touch voltages as well as the EPR contour should be scaled to
reflect the distribution fault. In this case, the injection current is 8A, the substation grid current was
measured to be 4.17A. Therefore, the associated measured touch voltage should be multiplied by a factor
of 911 to simulate the distribution fault. Please note, for the transmission line fault, the factor is 750.
6. Conclusion
This paper proves the importance of choosing the right injection path when completing a CIT for HV
infrastructure. Depending on the HV feeding arrangement and its route surrounding infrastructure, the
CIT route shall be determined to ensure that the test represents the worst case scenario otherwise the
results are no accurate. This paper introduces the CIT diagram which aid in assessing and determining
the correct injection path. The case study shows the importance of using the proposed diagram and how
it leads to more accurate results
Acknowledgment
These works was supported by the National Electrical Engineering Consultancy (NEEC PTY LTD)
References
[1] IEEE guide to safety in AC substation grounding, 2000’ (IEEE, New York, 2000).
[2] AS2067 Substations and high voltage exceeding 1kV AC’ (Australian Standards, 2008)
[3] Ma Y., Karady G. and Kucuksari S. “Testing continuity of grounding grid using AC current
injection method” IEEE Power and Energy Sociery General Meeting, 2010
[4] IEEE 81-2012 guide for measuring earth resistivity, ground impedance and earth surface potential’
IEEE, New York, 2012
[5] Nassereddine M., Rizk J., Hellany A. and Nagrial M. “HV substation earth grid commissioning
using current injection test (CIT) method” The 8th IEEE Conference on Industrial Electronics and
Applications, Melb. Australia 2013.
[6] Nassereddine M, Hellany A, Rizk J, “How to design an effective earthing system to ensure the
safety of the people” International Conference on Advances in Computational Tools for
Engineering Applications, pp 416-421, 2009
[7] Verma, R. “Ground fault current distribution in substation, tower and ground wire” IEEE
transactions on power apparatus and systems, Vol. PAS-98, 1979
[8] Andrenyi J. “Analysis of Transmission Tower Potentials During Ground Faults” IEEE Transaction
on Power Apparatus and Systems, Vol. Pas-86, No. 10, 1967
[9] Nassereddine M., Rizk J., Hellany A. and Nagrial M. “Induced Voltage Behaviour on Pipelines
Due to HV AC Interference under Broken OHEW” The Australasian Universities Power
Engineering Conference. AUPEC 2013
[10] Nassereddine M., Rizk J., Hellany A. and Nagrial M. “AC Interference study on pipeline: OHEW
split factor impacts on the induced voltage” Journal of Electrical Engineering-Vol. 14. 2014
Edition:1 PP. 132-138
[11] Nassereddine M., Rizk J., Hellany A. and Nagrial M. “Transmission Mains pole earth potential
rise (EPR) under substation fault” International journal of emerging electric power systems-
Volume 14, Issue 5, Pages 449-507
[12] Nassereddine M, Rizk J, Nagrial M and Hellany A. “Transmission Mains Earthing Design and
Concrete Pole Deployments” 2012 World Academy of Science, engineering and Technology,
Perth Australia
International Journal of Energy and Environment (IJEE), Volume 6, Issue 4, 2015, pp.347-356
ISSN 2076-2895 (Print), ISSN 2076-2909 (Online) ©2015 International Energy & Environment Foundation. All rights reserved.
356
[13] IEEE guide for measuring earth resistivity, ground impedance and earth surface potential’ IEEE,
New York, 2012
[14] Nassereddine M, Hellany A, Nagrial M. Rizk J. “Soil Resistivity Structure and its implication on
the Earth Grid of HV substation” World Academy of Science, engineering and Technology, Vol
60, pp 1322-1326, 2011
[15] Nassereddine M, Hellany A, Nagrial M, “Analysis of the impact of the OHEW under full load and
fault current” International Jurnal of Energy and Environment (IJEE), Volume 1, Issue 4, pp. 727-
736. 2010
[16] Nassereddine M, Hellany A, “AC Interference Study on Pipeline: the Impact of the OHEW under
Full Load and Fault Current”, Proceeding in the 2009 International Conference on Computer and
Electrical Engineering, pp 497-501, 2009
M. Nassereddine is a Ph.D. researcher at University of Western Sydney. He obtained his BEng
(Electrical) and M. Eng.(Hons) from University of Western Sydney, Sydney, Australia.Mohamad is a
member of IEEE. He has many publications in the earthing and lightning design. He also published in
the field of Switched Reluctance Generator for wind energy a
p
plications. His research interests are in
the fields of earthing and lightning design for substations and transmission lines. Mohamad has acted as
reviewer for papers for national and international conferences and journals.
E-mail address:
Jamal Rizk is a member of the Research Group: “Intelligent and Sustainable Electrical Systems
(ISES)” research group. He has a Ph.D. from University of Western Sydney, Australia. Dr.Rizk is a
Senior Lecturer and Academic Course Advisor for Electrical Engineering in the school of Computing,
Engineering and Mathematics, University of Western Sydney. He has attended and presented results o
f
his research at different Australian and International Conferences and published the results of his
research in different Australian and International Journals. Dr Rizk has developed special expertise i
n
the magnetic analysis of different types of electrical machines. He has been involved in design,
fabrication and testing of electrical drives. He has also developed research interests in integrate
d
renewable energy systems and published extensively. He has supervised many Ph.D. and M.Eng.
(Hons) research candidates in his general area of research. Dr Rizk has acted as reviewer for papers for National an
d
International conferencesand journals.
E-mail address:
M. Nagrial obtained his Ph.D. from University of Leeds, UK. Dr Nagrial has extensive experience in
Power Electronics and Drive Systems, Renewable Energy Systems. He is Group Leader for Research
Group “Intelligent and Sustainable Electrical Systems”. He has conducted many short courses and
contributed refereed papers to many International conferences. Dr Nagrial has been a leading researche
r
in the area of renewable energy systems, permanent magnet, variable reluctance machines and drive
systems. He has provided leadership in the accreditation of various engineering degree programs from
I.E. Aust. He has been Head, Electrical & Computer Engineering. He has also been Chair, School o
f
Mechatronic, Computer& Electrical Engineering. He has also been responsible for initiating
postgraduate courses and higher degree research programs in Electrical & Computer Engineering. He
has supervised Ph.D. and M.Eng. (Hons) Research Theses and postdoctoral fellows in his general area of research. He had many
research grants to support his research activities.
E-mail address:
Ali Hellany holds a B.E. in Telecommunication, ME (Hons) in Electrical Engineering and a Ph.D in
Electrical Engineering from University of Western Sydney (Australia). He is a member of IEEE, Executive
member of IEEE NSW Section and Chairing the student activities. He is a senior lecturer in Electrical
Engineering, University of Western Sydney since 2002. He has published numerous papers i
n
electromagnetic compatibility, power quality, AC interference, teaching styles and digital forensics area i
n
journals and presented his research at many international conferences. Dr Hellanyis a member of the
Research Group: “Intelligent and Sustainable Electrical Systems (ISES)”.
E-mail address: