A green supply chain network design model for enhancing competitiveness and sustainability of companies in high north arctic regions
Bạn đang xem bản rút gọn của tài liệu. Xem và tải ngay bản đầy đủ của tài liệu tại đây (1.14 MB, 16 trang )
INTERNATIONAL JOURNAL OF
ENERGY AND ENVIRONMENT
Volume 5, Issue 4, 2014 pp.403-418
Journal homepage: www.IJEE.IEEFoundation.org
ISSN 2076-2895 (Print), ISSN 2076-2909 (Online) ©2014 International Energy & Environment Foundation. All rights reserved.
A green supply chain network design model for enhancing
competitiveness and sustainability of companies in high
north arctic regions
Hao Yu
1
, Wei Deng Solvang
1
, Chen Chen
2
1
Department of Industrial Engineering, Narvik University College, Postboks 385 Lodve gate 2, NO-
8505 Narvik, Norway.
2
Northern Research Institute Narvik AS.Postboks 250, NO-8504 Narvik, Norway.
Abstract
To survive in today’s competitive and ever-changing marketplace, companies need not only to engage in
their products and/or services, but also to focus on the management of the whole supply chain.
Effectively managing and balancing the profitability and interconnection of each player in the supply
chain will improve the overall supply chain surplus as well as individual profit. However, it is extremely
difficult to simultaneously optimize several objectives in design and planning of a supply chain, i.e.,
cost-minimization, risk-minimization, responsiveness-maximization, etc., which are somehow conflict
with one another. Furthermore, the natural and infrastructural challenges in high north arctic regions
make it become much more difficult and complicated to design and develop cost-efficient, highly
responsive, environmentally friendly, and sustainable supply chain network. In order to provide
companies in high north arctic regions with decision support tool for the design and planning of theirs
supply chain networks, a green supply chain network design (GrSCND) model is formulated in this study
based on multi-objective mixed integer programming (MIP). The optimal trade-off among several
conflicting objectives is the focus of this GrSCND model aiming to enhance both competitive
competence and sustainability of companies and supply chains operated in high north regions. In
addition, a numerical experiment is also given to present a deep insight of the GrSCND model.
Copyright © 2014 International Energy and Environment Foundation - All rights reserved.
Keywords: Green supply chain; Network model; Competitiveness; Sustainability; High north Arctic
regions.
1. Introduction
To survive in today’s competitive and ever-changing marketplace, companies need not only to engage in
their products and/or services, but also to focus on the management of the whole supply chain. A typical
supply chain includes raw material/component supplier, manufacturer, distributor, retailer, and customer
[1]. Effectively managing and balancing the profitability and interconnections of each player in the
supply chain will improve the overall supply chain surplus as well as individual profit. Conventionally,
the objective of supply chain network design is to maximize the overall profit generated through
balancing the total costs and responsiveness to customer needs. A poor responsiveness to meet the
customer needs will decrease customer satisfaction, and therefore increase the risk of losing sales. In
order to achieve high responsiveness to the rapid-changing market, a more flexible manufacturing system
International Journal of Energy and Environment (IJEE), Volume 5, Issue 4, 2014, pp.403-418
ISSN 2076-2895 (Print), ISSN 2076-2909 (Online) ©2014 International Energy & Environment Foundation. All rights reserved.
404
should be applied, which sacrifices economies of scale and results in high production and transportation
costs. The break-even point which optimizes the overall supply chain performance in terms of both cost
and responsiveness has been extensively addressed in previous studies through bi-objective
programming.
However, for the companies and supply chains operated in high north arctic regions, more challenges,
i.e., inhospitable and extreme climate, absence or poor infrastructure [2], and complicated terrain and
environment, make it very difficult to deliver high responsive products and/or services with low costs,
and relatively high supply chain risks are imposed as well. Besides, environmental issues, i.e., vulnerable
eco-environmental system and higher sensitivity to greenhouse gas emissions, must be taken into account
in the decisional process of supply chain network design (SCND) considering that CO
2
emissions have
increased rapidly over past decades. Furthermore, population density in high north arctic regions is
extremely low (For instance, the population density in three counties located in northern Norway is
7/km
2
in Nordland, 6/km
2
in Tromsø, and 2/km
2
in Finnmark [3]), hence, the transportation of small
amount of raw materials and/or finished products over very long distance is quite common in this
sparsely populated area, which dramatically increases the costs of transportation. Due to the
aforementioned reasons, the supply chain network faces more challenges than those which are operated
in densely populated areas [4].
In order to tackle those challenges and provide decision supporttool for the companies and supply chains
operated in high north arctic regions, we aim in our study to develop the theoretical framework and
computational model for green supply chain network design (GrSCND) in order to enhance both
competitive competence and sustainability of companies of this area. The proposed theoretical
framework and computational model aim to optimize the overall supply chain performance through
balancing the trade-off among costs, risks, and greenhouse gas (GHG) emissions. In addition, the
adopted methodology for model formulation is based on multi-objective mixed integer programming
(MIP), and an numerical experiment is also given to present a deep insight and applicability of the
GrSCND model developed in this research.
The rest of this article is organized as follows. Section 2 provides an extensive literature review of green
supply chain management (GrSCM) and GrSCND models. Section 3 formulates the theoretical
framework and computational model for GrSCND in high north arctic regions, and the method for model
solution is also given in this section. Section 4 presents the numerical experiment, and section 5
concludes this article with a future outlook.
2. Literature review
The concept of green supply chain management (GrSCM) has been introduced and extensively studied
for almost two decades. The first attempts to define GrSCM can be found in late 1990s (see ref. [5]), and
the most cited definition of GSCM [6] is given by Srivastava [7] which defines GrSCM as “Integrating
environmental thinking into supply-chain management, including product design, material sourcing and
selection, manufacturing processes, delivery of the final product to the end customers as well as end-of-
life management of the product after its useful life.” GrSCM is also referred as environmental logistics
[8], green logistics [9], sustainable supply chains [10], and sustainable supply network management [11,
12], and a number of review articles contributed to both theoretical and practical development of GrSCM
are recently published by Seuring and Muller [13], Carter and Rogers [14], Sarkis et al. [15], Ali and
Searcy [6], and Ashby et al. [16]. To achieve GrSCM, two types of “greenness” are divided by
researchers [7]: green product design [17] and green operations, and the green operations, i.e., network
design problem [18-20], sustainable waste management [20-22], and material flow [22] of a supply
chain, are the focus of this research.
Network design is the logical place at which strategic decisions should be made for GrSCM [23].
Designing the physical network structure of a supply chain is called supply chain network design
(SCND) [24]. Due to its significant influence on supply chain’s performance, resilience, profits, and
competitive competence [25], SCND is believed to be one of the most important strategic decisions in
supply chain management, which affects the long-term profitability and sustainability of a supply chain.
To take into account environmental or “green” thinking in SCND, a large number of articles have
contributed to develop both theoretical and computational models for green supply chain network design
(GrSCND). Wang et al. [26] develop a bi-objective optimization model for GrSCND, which aims to
balance the trade-off between overall costs and environmental influence in terms of CO
2
emissions. The
“Pareto optimal” solutions are employed for model computation, and a comprehensive numerical
International Journal of Energy and Environment (IJEE), Volume 5, Issue 4, 2014, pp.403-418
ISSN 2076-2895 (Print), ISSN 2076-2909 (Online) ©2014 International Energy & Environment Foundation. All rights reserved.
405
experiment is also conducted in this study. Elhedhli and Merrick [23] propose a mathematical model for
reducing carbon emissions in GrSCND. The carbon emissions are monetized and converted into
environmental pollution costs, and the model aims to minimize the overall system costs including fixed
and variable facility costs, production costs, as well as environmental pollution costs. Govindan et al.
[27] introduce a two-stage bi-objective location-routing model with time-windows for GrSCND, and the
optimal balance of costs and greenhouse gas emissions is the goal of this model. The optimal supply
chain network configuration is determined through selecting appropriate number and locations of
facilities as well as the route within each stage. A large number of GrSCND models and practices
incorporating cost objective with emission objective of greenhouse gas (GHG) can also be found in Yu
and Solvang [20], Quariguasi-Frota-Neto et al. [28], Harris et al. [29], Ulbeda et al. [30], and Adballah et
al. [31].
To consider different influencing factors in GrSCND other than GHG emissions, Jamshidi et al. [32]
develop a bi-objective mathematical model for GrSCND, which simultaneously minimizes the overall
system costs and environmental impacts. The environmental impacts in this study are measured by the
amount of hazardous gases, i.e., CO, NO
2
and volatile organic particles, generated by facility operations
and transportation of goods within the supply chain. Latha Shankar et al. [33] pose a bi-objective
optimization model for strategic planning and material flow decisions of a three-echelon supply chain
network. The focus of this model is the optimal balance between system operating costs and the fill rate
of customer demands. Sheu and Lin [34] incorporate multi-objective mixed integer programming (MIP)
and hierarchical cluster analysis method to configure and optimize global logistics network. The
proposed model aims to minimize the network investments, while maximize the total profits generated
by the supply chain and satisfaction rate of customer demands, and the weighted sum utility method is
employed in this research for model computation.
To take into account of the changes in input parameters with time horizon, Yu et al. [22] formulate a
multi-period dynamic model for managing and operating the reverse network of waste management
system in an environmentally friendly manner. The proposed model aims to simultaneously minimize the
system operating costs and environmental risks imposed by waste recycling and disposal through
optimally managing the material flow between different facilities at each time period. A three-stage
dynamic model for open-loop reverse supply chain and logistics network planning is developed by Ene
and Ozturk [35], which aims to maximize the overall network costs of product recovery and disposal.
Zeballos et al. [36] propose a multi-product and multi-period mathematical model for optimal planning
of closed-loop supply chains through the minimization of net costs (expected costs minus expected
revenue through recycling and remanufacturing), and both forward flows and reverse flows are
formulated in this model. It is noted that the input parameters in this model are assumed to be stochastic
in nature and therefore exist great uncertainties, and a reduced scenario tree is applied to achieve a
reasonable representation of the original problem so that the model can be resolved.
Dealing with uncertainties in input parameters is another focus in GrSCND. Pishvaee and Razmi [37]
formulate a fuzzy mathematical programming for GrSCND. This model aims to balance the trade-off
between costs and environmental impact, and the environmental impact is measured by eco-indicator 99
which is a life cycle assessment-based (LCA-based) method. Further, an interactive fuzzy solution
approach is also established for model computation. Ramezani et al. [38] develop a multi-stage, multi-
period and multi-product optimization model for closed-loop SCND with fuzzy environment, and the
goal of this model is to simultaneously minimize the costs, delivery time, and defects of raw materials
acquired from suppliers. Amin and Zhang [39] propose a bi-objective model for closed-loop SCND with
inexact input information on demands and return, and the balance between the minimization of costs and
maximization of the use of environmentally friendly materials is the focus of this research.
Through the extensive literature review of GrSCND models and practices, two characteristics can be
identified. One is most previous researches use bi-objective optimization approach in order to balance the
trade-off between costs and environment impacts, and the other is the indicator of environmental impacts
is most frequently measured by GHG emissions. Besides, other objectives i.e., amount of hazardous
gases, customer satisfaction rate, etc., are formulated as well in some previous models, and the time-
varying and uncertain parameters have also been extensively focused in GrSCND. There is no denying
the fact that costs and GHG emissions are the most crucial influencing factors in GrSCND, but more
focus and emphasis have to be attached to the risks and reliability of the supply chains operated in high
north arctic regions where natural and infrastructural challenges, i.e., poor and limited transport access
(e.g. railway transportation is unavailable in most arctic regions), significant influence of inhospitable
International Journal of Energy and Environment (IJEE), Volume 5, Issue 4, 2014, pp.403-418
ISSN 2076-2895 (Print), ISSN 2076-2909 (Online) ©2014 International Energy & Environment Foundation. All rights reserved.
406
and extreme climate (e.g. the road transportation may be closed for several days due to avalanche), etc.,
bring more complexities in GrSCND. A poorly planned supply chain network without considering
supply chain risks in this area will result in extremely high costs, high risks, high GHG emissions and
poor responsiveness, which will then lead to the failure of a company or a supply chain in pursuing long-
term profitability and sustainability. Therefore, it is of significant importance to account supply chain
risks in the decisional process of GrSCND in high north arctic regions, however, it is extremely difficult
to find such an instance from previous researches. Therefore, in order to fill the literature gap, the
theoretical framework and mathematical model for GrSCND of a three-stage supply chain operated in
high north arctic regions are formulated in this paper so that the supply chain costs, GHG emissions and
risks are simultaneously considered in GrSCND.
3. Model
3.1 Theoretical framework
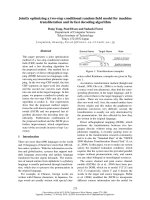
In this section, the theoretical framework of a general three-stage forward supply chain is first formulated
in Figure 1. As shown in the figure, the proposed theoretical supply chain network is comprised of four
levels of entities: supplier, producer, warehouse and customer, and those entities are communicated and
connected through three flows: material flow, information flow and capital flow. The material flow in
this supply chain network starts from upstream raw material suppliers and moves via intermediate
production plants and warehouses towards end customers, and the information and capital flow in
opposite direction from end customers towards suppliers.
Figure 1. Theoretical framework of GrSCND of a three-stage supply chain operated in high north arctic
regions
Conventionally, the focus of GrSCND is to simultaneously minimize the costs and GHG emissions of a
supply chain, however, it is also of great significance to decrease the risks and increase reliability of a
supply chain operated in high north arctic regions due to the complex natural and infrastructural
challenges discussed in previous section. Therefore, in order to tackle this challenge, the optimal trade-
off among cost-minimization, risk-minimization and GHG emission-minimization will be focused in this
research so that long-term competitive competence, profitability and sustainability can be achieved.
3.2 Mathematical model
The proposed MIP model aims to determine, in an optimal manner, the number and locations of potential
facilities, selection of suppliers, and the inter-facility material flow in each stage of a supply chain. The
indices, input parameters and decision variables are first given as follows:
International Journal of Energy and Environment (IJEE), Volume 5, Issue 4, 2014, pp.403-418
ISSN 2076-2895 (Print), ISSN 2076-2909 (Online) ©2014 International Energy & Environment Foundation. All rights reserved.
407
Indices
s
The set of suppliers (s=1, 2, 3,…, S)
p
The set of candidate locations for production plants (p=1, 2, 3,…, P)
w
The set of candidate locations for warehouses (w=1, 2, 3,…, W)
c
The set of customers (c=1, 2, 3,…, C)
Input parameters
PC
s
The unit purchasing costs for raw materials and components at supplier s
FC
p
, FC
w
The fixed costs for production plant p and warehouse w
C
p
, C
w
The unit operational costs (e.g. production costs, inventory costs, packaging
costs, etc.) of production plant p and warehouse w
TC
sp
, TC
pw
, TC
wc
The unit transportation costs between supplier s and production plant p,
production plant p and warehouse w, warehouse w and customer c
EMS
sp
, EMS
pw
, EMS
wc
The GHG emission factor between supplier s and production plant p,
production plant p and warehouse w, warehouse w and customer c
DIS
sp
, DIS
pw
, DIS
wc
The transport distance between supplier s and production plant p, production
plant p and warehouse w, warehouse w and customer c
LD
sp
, LD
pw
,LD
wc
The average load of transport vehicles between supplier s and production
plant p, production plant p and warehouse w, warehouse w and customer c
RK
s
The risk index of suppler s
RK
sp
, RK
pw
, RK
wc
The risk index of the transportation between supplier s and production plant
p, production plant p and warehouse w, warehouse w and customer c
CD
c
The demands of customer c
IF
An infinite positive number
MPR
p
The material-to-product rate at production plant p which specifies how many
materials are needed for producing one product
ITR
w
The inventory turnover rate at warehouse w which specifies the ratio of
outgoing products and incoming products
CAP
s
, CAP
p
, CAP
w
The capacity of supplier s, production plant p, and warehouse w
Decision variables
S
s
If S
s
=1, supplier s is selected, and if S
s
=0, otherwise
X
p
If X
p
=1, candidate location p is selected for opening production plant, and if
X
p
=0, otherwise
X
w
If X
w
=1, candidate location w is selected for opening warehouse, and if X
w
=0,
otherwise
AT
sp
, AT
pw
, AT
wc
The amount of raw materials or finished products transported between
supplier s and production plant p, production plant p and warehouse w,
warehouse w and customer c
Min OBJ1=
(
)
=1
=1
+
(
+
=1
)
=1
+
(
+
=1
)
=1
+
=1
=1
+
=1
=1
+
=1
=1
(1)
Min 2=
=1
=1
+
=1
=1
+
=1
=1
(2)
International Journal of Energy and Environment (IJEE), Volume 5, Issue 4, 2014, pp.403-418
ISSN 2076-2895 (Print), ISSN 2076-2909 (Online) ©2014 International Energy & Environment Foundation. All rights reserved.
408
Min 3 =
(
)
=1
=1
+
=1
=1
+
=1
=1
+
=1
=1
(3)
Eqs.(1), (2) and (3) are objective functions of this multi-objective MIP model for GrSCND in high north
arctic regions. Eq. (1) is the cost-minimization objective function which takes into account the costs for
supplier selection. The first part of this equation represents the purchasing costs of the raw materials
from suppliers, and the second and third parts represent the fixed and operational costs of potential
production plant and warehouse, and the last three parts represent the transportation costs in each stage.
The purchasing costs and operational costs are directly proportional to the amount of raw materials and
components purchased, and the transportation costs are directly proportional to the quantity transported
in each stage. Eq. (2) is the GHG emission-minimization objective function. GHG emissions are very
important environmental indicator especially for high north arctic regions where the GHG emissions
have more negative influence on the ozone. In this model, the GHG emissions are directly proportional
to the distance and amount transported, and it is inversely proportional to the load of transport vehicle. It
is noted that the emission factor is applied for quantifying the equivalent GHG emissions, and it is
determined by the type of transport vehicle, road condition as well as other influencing factors. Eq. (3) is
the risk-minimization objective function in which the methodology developed by Yu and Goh [40] to
quantify supply chain risks is employed and adapted accordingly. The first part of this equation
represents the potential risks of supplier in fulfilling the demands of producer, and the other parts
represent the potential transportation risks. The risk index of supplier is determined by inherent risks,
supplier’s capacity, supplier’s reliability and reputation, and the risk index of transportation is influenced
by transporter’s reliability, probability of infrastructural risks, probability of natural disaster, etc.
Besides, in order to fulfill the requirement for material flow, facility capacity as well as other restrictions,
thirteen sets of model constraints are also formulated as follows.
Subject to:
=
=1
, For = 1, ,
(4)
=1
=
=1
, For = 1, ,
(5)
=1
=
=1
, For = 1, ,
(6)
=1
, For = 1, ,
(7)
=1
, For = 1, ,
(8)
=1
, For = 1, ,
(9)
International Journal of Energy and Environment (IJEE), Volume 5, Issue 4, 2014, pp.403-418
ISSN 2076-2895 (Print), ISSN 2076-2909 (Online) ©2014 International Energy & Environment Foundation. All rights reserved.
409
=1
, For = 1, ,
(10)
=1
, For = 1, ,
(11)
=1
, For = 1, ,
(12)
, For = 1, , , = 1, .
(13)
, For = 1, , , = 1, .
(14)
, For = 1, , , = 1, .
(15)
,
,
0, 1
, For = 1, , , = 1, , , = 1, ,
(16)
Eq. (4) restricts the demands of each customer must be fulfilled. Eqs. (5) and (6) are the requirements of
material flow balance, which specify the relationship between the amount of incoming raw materials and
the quantity of outgoing finished products at production plant p and warehouse w. It is noted that the
defect rate should be taken into consideration in determining the value of MPR at production plant p.
Eqs. (7), (8) and (9) are capacity constraints, which restrict the maximum quantity served by supplier s,
production plant p, and warehouse w cannot exceed their corresponding capacities. Eq. (10) restricts
supplier s will not be selected if it doesn’t supply raw materials or components to any producers. Eqs.
(11) and (12) ensure the candidate locations for production plant p and warehouse w will not be selected
if they do not perform any functions. Eq. (13) guarantees the producer p can be served by supplier s only
when both supplier sand candidate location p for opening production plant are selected. Eq. (14) restricts
the finished products from producer p can be stored at warehouse w only when both candidate location p
for opening production plant and candidate location w for opening warehouse are chosen. Eq. (15)
ensures the demands of customer c can be served by warehouse w only when candidate location w is
selected for building new warehouse. Eq. (16) is the binary constraint of decision variables. In addition,
all the indices and input parameters of this multi-objective MIP model for GrSCND belong to non-
negative domain.
3.3 Model solution
In order to composite multiple objective functions with different measures of units, the weighted sum
utility method developed by Sheu and Lin [34] is employed in this research to composite the three
objective functions of this GrSCND model, and similar practices of this method can also be found in Yu
et al. [22], Nema and Gupta [41], and Sheu [42]. Before the weighted sum utility method is formulated,
the notations of some adjustable parameters, benchmark parameters and response variables are first given
as follows.
Adjustable parameters
WT
OBJ1
, WT
OBJ2
, WT
OBJ3
The weight of cost-utility, GHG emission-utility, and risk-utility
Benchmark parameters
OBJ1
min
, OBJ2
min
, OBJ3
min
The individual minimum achievable value of cost-minimization objective,
GHG emission-minimization objective, and risk-minimization objective
OBJ1
max
, OBJ2
max
, OBJ3
max
The individual maximum achievable value cost-minimization objective,
GHG emission-minimization objective, and risk-minimization objective
International Journal of Energy and Environment (IJEE), Volume 5, Issue 4, 2014, pp.403-418
ISSN 2076-2895 (Print), ISSN 2076-2909 (Online) ©2014 International Energy & Environment Foundation. All rights reserved.
410
Response variables
OBJ1, OBJ2, OBJ3
The actual value of cost-minimization objective, GHG emission-
minimization objective, and risk-minimization objective
UT
OBJ1
, UT
OBJ2
, UT
OBJ3
The individual cost-utility, GHG emission-utility, and risk-utility
UT
The composite utility
Min =
1
1
+
2
2
+
3
3
(17)
Eq. (17) is the objective function of the weighted sum utility method and aims to minimize the weighted
sum utility of each objective function. The weight of each individual utility presents the relative
importance of each objective function determined by decision-makers. Eqs. (18), (19) and (20) illustrate
the method for calculating the individual utility of each objective function. In Eq. (18), OBJ1
max
minus
OBJ1
min
denotes the theoretically maximum deviation between the maximum achieve costs and the
minimum achievable costs, which can be used as the benchmark for calculating the individual utility, and
OBJ1 minus OBJ1
min
represents the deviation between actual value and minimum achievable value. The
numerator and denominator in this equation share the same unit, and the unit can then be eliminated, and
this method also applies for Eqs. (19) and (20).Therefore, the individual utility of each objective function
becomes unit less and can be directly summed by giving the corresponding weights. The summation of
the weights of those three objectives in this model is regulated to 1, so the theoretically minimum
achievable individual utility is 0 when the actual value OBJ equals to the minimum achievable value
OBJ
min
, and the theoretical achievable maximum individual utility is 1 when the actual value OBJ equals
to the maximum achievable value OBJ
max
.
1
=
1 1
1
1
(18)
2
=
2 2
2
2
(19)
3
=
1 1
1
1
(20)
4. Numerical experiment
In this section, a numerical experiment is given to present a deep insight of the proposed multi-objective
MIP model for GrSCND in high north arctic regions. The numerical experiment is performed based upon
a hypothetical case of a three-stage supply chain network, including supplier, producer, warehouse and
customer, operated in high north arctic regions, and the producer sources from domestic and international
suppliers, and it mainly serves local customers. In order to design and maintain an efficient and
sustainable supply chain with relatively low risks, the supply chain manager has to make several crucial
decisions, i.e., the number and locations of production plants and warehouses to be opened, selection of
suppliers, the amount purchased from each selected supplier, the amount of finished products stored in
which warehouse, and the customer demands are served from which warehouse. The proposed GrSCND
model is applied for decision support in this case.
The hypothetical supply chain network is comprised of 7 raw material suppliers, 5 candidate locations
for production plant, 5 candidate locations for warehouse, and 4 end customers. Table 1 gives the unit
purchasing costs, capacity and risk index of each supplier s, and the fixed costs, unit operational costs
and capacity of the candidate locations for production plant p and warehouse w are presented in this table
as well. The material-to-production rates MPR
p
of candidate location p1, p2, p3, p4, p5 are 0.8, 0.7, 0.8,
0.6 and 0.7, respectively. The inventory turnover rate ITR
w
of each potential warehouse is assumed to be
equal, and it is 0.8. It is noted that the units of input parameters are given as unit cost (uc), unit weight
(uw) and unit distance (ud) to represent the genericity, and they can easily and accordingly specified into
a certain measure of units in a real world case study.
Tables 2, 3 and 4 present the unit transportation costs, distance and risk index of the 1
st
stage inter-
facility transportation between supplier s and producer p, the 2
nd
stage inter-facility transportation
between producer p and warehouse w, and the 3
rd
stage inter-facility transportation between warehouse w
and customer c, respectively. The transportation of raw materials from suppliers to producers is
International Journal of Energy and Environment (IJEE), Volume 5, Issue 4, 2014, pp.403-418
ISSN 2076-2895 (Print), ISSN 2076-2909 (Online) ©2014 International Energy & Environment Foundation. All rights reserved.
411
suppliers’ responsibility in this supply chain. Because the same type of vehicles are used for transporting
raw materials from one supplier to all the producers, the GHG emission factor EMS
sp
and average load
LD
sp
are assumed to be equal in all the outbound transportation of supplier s, where EMS
s1p
=0.7 1/ud,
EMS
s2p
=0.81/ud, EMS
s3p
=0.8 1/ud, EMS
s4p
=0.7 1/ud, EMS
s5p
=0.9 1/ud, EMS
s6p
=0.75 1/ud, EMS
s7p
=0.6
1/ud, and LD
s1p
=4 uw, LD
s2p
=6 uw, LD
s3p
=8 uw, LD
s4p
=6 uw, LD
s5p
=12 uw, LD
s6p
=8 uw and LD
s7p
=12
uw, respectively. The transportation of finished products in stages 2 and 3 is outsourced to a 3
rd
party
logistics (3PL) company, and the same type of transport vehicles are used to perform the transportations,
so all the GHG emission factors and average load in 2
nd
and 3
rd
stage inter-facility transportation are
assumed to be equal, where EMS
pw
=EMS
wc
=0.8 1/ud and LD
pw
=LD
wc
=4 uw, respectively. It is noted that
the GHG emission-minimization objective function OBJ2 and risk-minimization objective function
OBJ3 are quantified through calculating the emission index and risk index, which are relative value. The
optimal solution of objective function OBJ2 and OBJ3 are achieved through comparing different
scenarios, and the absolute value of individual scenario is meaningless. Furthermore, objective function
OBJ2 and OBJ3 are unitless, and the unit 1/ud of emission factors EMS
sp
, EMS
pw
and EMS
wc
, and 1/uw of
risk index RK
sp
, RK
pw
and RK
wc
are applied in order to eliminate the units of Eqs. 2 and 3, respectively.
Table 1. Input parameters of supplier s, candidate locations for production plant p, and candidate
locations for warehouse w
Supplier
Parameters
Producer
Parameters
Warehouse
Parameters
PC
s
[uc]
a
CAP
s
[uw]
b
RK
s
FC
p
[uc]
C
p
[uc]
CAP
p
[uw]
FC
w
[uc]
C
w
[uc]
CAP
w
[uw]
s
1
760
500
0.2
p
1
500000
750
300
w
1
220000
80
250
s
2
320
100
0.5
p
2
480000
870
250
w
2
290000
65
350
s
3
400
140
0.4
p
3
515000
745
400
w
3
175000
95
200
s
4
80
500
0.3
p
4
450000
960
350
w
4
240000
75
350
s
5
102
350
0.7
p
5
475000
905
325
w
5
310000
60
450
s
6
115
450
0.3
s
7
110
400
0.5
a
uc=unit currency, the same abbreviation is also applied in subsequent parts of this section.
b
uw=unit weight, the same abbreviation is also applied in subsequent parts of this section.
Table 2. The unit transportation costs, distance and risk index of the 1
st
stage inter-facility transportation
between supplier s and producer p
Supplier
Parameter TC
sp
[uc]
Parameter DIS
sp
[ud]
c
Parameter RK
sp
[1/uw]
d
p
1
p
2
p
3
p
4
p
5
p
1
p
2
p
3
p
4
p
5
p
1
p
2
p
3
p
4
p
5
s
1
80
75
95
45
60
8
7.5
9
3
5.5
0.8
0.6
0.85
0.5
0.55
s
2
102
90
75
40
65
9.2
7
6
3.5
5
0.95
0.8
0.7
0.5
0.55
s
3
55
60
70
65
65
4.5
5
6.5
5.5
5.7
0.45
0.75
0.6
0.65
0.55
s
4
80
90
95
40
75
8.2
8.7
9
3.2
9
0.65
0.85
0.9
0.5
0.65
s
5
55
105
95
45
75
4.5
9.7
8.8
3.2
6.5
0.45
0.95
0.8
0.55
0.8
s
6
58
90
75
102
70
5.9
8.8
7.2
9.8
6.4
0.6
0.7
0.8
0.95
0.65
s
7
75
45
60
95
55
7.1
3.8
6.2
10.1
6.7
0.7
0.5
0.75
0.85
0.6
c
ud=unit distance, the same abbreviation is also applied in subsequent parts of this section.
d
1/uw=1/unit weight, the same abbreviation is also applied in subsequent parts of this section.
Table 3. The unit transportation costs, distance and risk index of the 2
nd
stage inter-facility transportation
between producer p and warehouse w
Producer
Parameter TC
pw
[uc]
Parameter DIS
pw
[ud]
Parameter RK
pw
[1/uw]
w
1
w
2
w
3
w
4
w
5
w
1
w
2
w
3
w
4
w
5
w
1
w
2
w
3
w
4
w
5
p
1
65
55
40
50
55
7
6
5.5
6.5
6
0.8
0.6
0.5
0.5
0.55
p
2
45
75
55
50
45
5
5.5
4.5
5
4.5
0.4
0.9
0.6
0.6
0.5
p
3
75
45
50
55
65
7.5
5
5.3
6
6.5
0.8
0.5
0.5
0.5
0.7
p
4
70
55
45
65
75
7.2
6
4.8
6.2
7.3
0.8
0.7
0.5
0.6
0.7
p
5
45
75
55
60
50
5
5.7
5.5
5.5
5
0.5
0.75
0.6
0.6
0.5
International Journal of Energy and Environment (IJEE), Volume 5, Issue 4, 2014, pp.403-418
ISSN 2076-2895 (Print), ISSN 2076-2909 (Online) ©2014 International Energy & Environment Foundation. All rights reserved.
412
Table 4. The unit transportation costs, distance and risk index of the 3
rd
stage inter-facility transportation
between warehouse w and customer c
Warehouse
Parameter TC
wc
[uc]
Parameter DIS
wc
[ud]
Parameter RK
wc
[1/uw]
c
1
c
2
c
3
c
4
c
1
c
2
c
3
c
4
c
1
c
2
c
3
c
4
w
1
80
82
75
65
9
9.5
8
7.5
0.9
0.8
0.7
0.6
w
2
55
90
95
45
6
9.5
10
4.5
0.6
0.85
0.9
0.55
w
3
75
60
55
65
7.5
5.5
5
6
0.7
0.6
0.6
0.6
w
4
65
70
75
95
7
6.5
7.2
9
0.65
0.65
0.7
0.85
w
5
45
55
85
80
5
6
9.5
9
0.5
0.55
0.9
0.85
In order to test the performance of the proposed multi-objective GrSCND model, the model is coded and
resolved by using Lingo solver, and all the model computations are performed on a Inter(R) Core(TM)2
2.13 GHz computer with 2 GB RAM and 150 GB hard drive capacity under Windows 7 operating
system. The tested weights of cost utility, GHG emission utility and risk utility are set to 0.4, 0.3 and 0.3,
respectively. The time consumed and iterations performed to calculate individual maximum and
minimum costs, individual maximum and minimum GHG emissions, individual maximum and minimum
risks, and minimum overall utility are presented in Table 5, and the objective value of those scenarios are
also given in this table. It is illustrated from the result, the calculation of individual cost-minimization
objective and overall utility are much more complicated and time consuming than the calculation of
GHG emission-minimization objective and risk-minimization objective due to the larger number of
integer variables and nonlinear variables. Besides, it is also shown from the table that, in this GrSCND
model, the calculation of maximum achievable value is much easier and less time consuming than the
calculation of minimum achievable value.
Table 5. The objective value, time consumed and iterations performed of each scenario
Scenario
Objective value
Time (s)
Iterations
Maximum individual costs
5246727 uc
4
1421
Minimum individual costs
2859436 uc
8
58513
Maximum individual GHG emissions
3010.529
1
549
Minimum individual GHG emissions
1462.585
1
332
Maximum individual risks
2320.375
1
437
Minimum individual risks
1335.4
1
1247
Minimum weighted sum utility
0.0914942
14
32474
Table 6 presents the selection of suppliers, selection of candidate locations for production plants and
warehouses, as well as the value of corresponding weighted sum utility of four selected scenarios:
individual minimum costs, individual minimum GHG emissions, individual minimum risks and
minimum overall sum weighted utility. It is noted that the maximum value of each individual scenario is
not taken into consideration in this comparison, because they are introduced in weighted sum utility
method as bench mark parameters to represent the “worst solution” and determine maximum achievable
deviation between the “best solution” and the “worst solution” of each scenario, and the independent
comparison of the “worst solutions” is therefore meaningless to achieve the optimal solution in this case
study. As shown in the table, the individual minimum costs objective has the best weighted sum utility
comparing with the other two individual scenarios, and suppliers s4, s5, s7, candidate locations p1, p3,
p5, w3 and w5 are chosen in this scenario. The increase of the overall sum weighted utility are mainly
contributed by the individual risk utility which equals to 0.3149, and this is caused by the relatively high
risk index in 1
st
stage transportation of this scenario. When the optimal value of individual GHG
emission objective is achieved, suppliers s3, s4, s5, s7, candidate locations p1, p2, p3, p4, w2, w3 and w5
are selected. In this scenario, both costs and GHG emissions are increased, the significant increase in cost
utility (0.3749) due to more suppliers selected and more facilities opened is the main contributor in the
increase of overall weighted sum utility, besides, the individual risk utility is relatively high as well.
When the individual risk objective function reaches its optimal value, suppliers s1, s3, s6, and candidate
locations p1, p2, p3, w3 and w5 are selected. In this scenario, both cost utility and GHG emission utility
increase significantly. In order to have higher reliability and lower risks of suppliers, the purchasing costs
International Journal of Energy and Environment (IJEE), Volume 5, Issue 4, 2014, pp.403-418
ISSN 2076-2895 (Print), ISSN 2076-2909 (Online) ©2014 International Energy & Environment Foundation. All rights reserved.
413
of raw materials are increased dramatically, and the value of cost utility will then be increased to 0.3831
which takes the largest share of the overall weighted utility. Furthermore, the GHG emission utility
increases to 0.3594 due to the increased numbers of transportation of raw materials and finished products
in this scenario. If the system performance of optimal overall weighted sum utility is converted to 100%,
the system performance of individual minimum costs, individual minimum GHG emissions and
individual minimum risks can accordingly be converted to 71.6%, 40.7% and 25.5%, respectively, which
is illustrated in Figure 2.
Table 6. The value of weighted sum utility, and selection of suppliers and candidate locations of the
four selected scenarios
Scenario
Weighted
sum utility
Supplier
Producer
Warehouse
s
1
s
2
s
3
s
4
s
5
s
6
s
7
p
1
p
2
p
3
p
4
p
5
w
1
w
2
w
3
w
4
w
5
MinIC
e
0.127762
■
■
■
■
■
■
■
■
MinIGE
f
0.223926
■
■
■
■
■
■
■
■
■
■
■
MinIR
g
0.359397
■
■
■
■
■
■
■
■
■
■
■
MinWSU
h
0.0914942
■
■
■
■
■
■
■
e
MinIC=minimum individual costs, the same abbreviation is also applied in subsequent parts of this section.
f
MinIGE=minimum individual GHG emissions, the same abbreviation is also applied in subsequent parts of this
section.
g
MinIR=minimum individual risks, the same abbreviation is also applied in subsequent parts of this section.
h
MinWSU=minimum weighted sum utility, the same abbreviation is also applied in subsequent parts of this section.
Figure 2. Comparison of the overall system performance of the four selected scenarios
When the overall weighted sum utility objective function achieves its optimal value, suppliers s6, s7,
candidate locations p1, p2, p3, w3 and w5 are chosen. Table 7 illustrates the amount of raw materials
and/or finished products transported between different facilities at each stage of the supply chain. It is
noted that the result achieved in this scenario is mostly influenced by the cost utility due to its relatively
large weight, and the result also compromises with the GHG emission utility and risk utility in order to
balance the trade-off among those objectives. For instance, the selection of suppliers in optimal overall
weighted scenario is achieved through balancing the cost utility and risk utility associated with the
purchase and transportation of raw materials. Supplier s4 has the lowest unit purchasing price and
relatively low risk index, however, it is not chosen due to its high unit costs and risk index with respect
to the transportation of raw materials, and suppliers s6 and s7 are therefore selected to maximize the
overall system performance.
International Journal of Energy and Environment (IJEE), Volume 5, Issue 4, 2014, pp.403-418
ISSN 2076-2895 (Print), ISSN 2076-2909 (Online) ©2014 International Energy & Environment Foundation. All rights reserved.
414
The optimal number, locations and inter-facility transportation of raw materials and/or finished products
are determined by using the proposed GrSCND model, and the result is achieved through balancing the
trade-off among cost utility, GHG emission utility and risk utility. The result is quite convincing, and
further sensitive analysis can also be performed, if necessary, to test how and to what extend the optimal
supply chain network configuration can be affected by different objectives.
Table 7. The amount of raw materials and/or finished products transported between different facilities
at each stage
`
s6
s7
p1
p2
p3
w3
w5
AT
sp
[uw]
p1
300
p2
250
p3
143.75
150
AT
pw
[uw]
w3
200
w5
240
175
35
AT
wc
[uw]
c1
120
c2
10
240
c3
40
c4
110
5. Conclusion
This work has presented a novel research on GrSCND model for companies and supply chains operated
in high north arctic regions, where natural and infrastructural challenges bring more complexities in
GrSCND than other regions, in order to enhance both competitive competence and sustainability.
Compared with previous researches, the formulation and minimization of supply chain risks and
reliability are taken into consideration in this study, which is an extremely important influencing factor
accounted in the design and planning of supply chains operated in this region. The proposed
computational model is formulated based upon multi-objective MIP method which aims to determine the
number, locations and inter-facility transportation of raw materials and/or finished products through
simultaneously minimizing the overall supply chain costs, GHG emissions and risks, and weighted sum
utility method is employed to composite those objectives with different measures of units. A numerical
experiment is performed as well to explicitly present the applications of the proposed multi-objective
MIP model for GrSCND in high north regions, and Lingo solver is applied in coding and resolving the
computational optimization problems.
The model is developed primarily for the design and planning of supply chains operated in high north
regions, however, it is also perfectly applicable for the supply chains operated in other regions where the
consideration of supply chain risks plays an important role. Besides, the selection of suppliers is also
taken into account in this model, which is another crucial influencing factor for GrSCND. For example,
in a global supply chain network, the reliability and safety of suppliers in some countries or regions may
be significantly affected by some influencing factors, i.e., political stability, tax and tariff, infrastructure,
etc., so it is of great importance to account the selection of suppliers in the decisional process of
GrSCND so as to minimize the supply chain risks.
The mathematical model is formulated and developed under certain input parameters, however, the
design and planning of supply chain network is always a strategic decision which has significant
influence on long-term profitability, competitiveness and sustainability of a supply chain, and some input
parameters may have great changes within its life span, furthermore, some parameters are stochastic in
nature and impossible to be quantified accurately, and this will dramatically increase the level of
difficulty in dealing with uncertainties. Therefore, the appropriate treatment of uncertain and stochastic
input parameters are suggested for further improvement of the multi-objective MIP model for GrSCND
in high north arctic regions.
Acknowledgements
This research was supported by EU-Sustainable Manufacturing and Engineering (SMaE) project (Grand
No. 38005) for delivering cross-disciplinary solutions for enhancing competitive competence and
sustainability of small and medium sized enterprises (SMEs) in high north arctic regions.
International Journal of Energy and Environment (IJEE), Volume 5, Issue 4, 2014, pp.403-418
ISSN 2076-2895 (Print), ISSN 2076-2909 (Online) ©2014 International Energy & Environment Foundation. All rights reserved.
415
References
[1] Brooks, M.R., Frost, J.D. Providing freight services to remote arctic communities: Are there
lessons for practitioners from service to Greenland and Canada’s northeast? Research in
Transportation Business & Management 2012, 4, 69-78.
[2] Chopra, S., Meindl, P. Supply chain management-Strategy, planning and operation (5th edition).
Pearson, 2013.
[3] Solvang, W.D., Hakam, M.H. Sustainable logistics network in sparsely populated areas. Journal of
Service Science & Management 2010, 3, 72-77.
[4] Statistical yearbook of Norway. SSB, 2013. Available from: />og-publikasjoner/statistical-yearbook-of-norway-2013 (Accessed on: 14. 03. 14).
[5] Handfield, R.B., Walton, S.V., Swwgers, L.K., Melnyk, S.A. “Green” value chain practices in the
future industry. Journal of Operations Management 1997, 15 (4), 293-315.
[6] Ali, P., Searcy, C. A comparative literature analysis of definitions for green and sustainable supply
chain management. Journal of Cleaner Production 2013, 52, 329-341.
[7] Stivastava, S.K. Green supply-chain management: a state-of-the art literature review. International
Journal of Management Reviews 2007, 9 (1), 53-80.
[8] Gonzalez-Benito, J., Gonzalez-Benito, O. The role of stakeholder pressure and managerial values
in the implementation of environmental logistics practices. International Journal of Production
Research 2006, 44 (7), 1353-1373.
[9] Murphy, P.R., Poist, R.F. Green logistics strategies: an analysis of usage patterns. Transportation
Journal 2000, 40 (2), 5-16.
[10] Linton, J.D., Klassen, R., Jayaraman, V. Sustainable supply chains: an introduction. Journal of
Operations Management 2007, 25 (6), 1075-7082.
[11] Young, A., Kielkiewicz-Yong, A. Sustainable supply chain network management. Corporate
Environmental Strategy 2001, 8 (3), 260-268.
[12] Cruz, Z.M., Matsypura, D. Supply chain networks with corporate social responsibility through
integrated environmental decision-making. International Journal of Production Research 2009, 47
(3), 621-648.
[13] Seuring, S., Muller, M. From a literature review to a conceptual framework for sustainable supply
chain management. Journal of Cleaner Production 2008, 16 (15), 1699-1710.
[14] Carter, R.C., Rogers, D.S. A framework of sustainable supply chain management: moving toward
new theory. International Journal of Physical Distribution & Logistics Management 2008, 38 (5),
360-387.
[15] Sarkis, J., Zhu, Q., Lai, K H. An organizational theoretic review of green supply chain
management literature. International Journal of Production Economics 2011, 130, 1-15.
[16] Ashby, A., Leat, M., Hudson-Smith, M. Making connections: a review of supply chain
management and sustainability literature. Supply Chain Management: An International Journal
2012, 17 (5), 497-516.
[17] Kuo, T.C., Huang, S., Zhang, H. Design for manufacture and design for “X”: concepts,
applications and perspectives. Computers & Industrial Engineering 2001, 41, 241-260.
[18] Zhu, Q., Sarkis, J., Lai, K.H. Green supply chain management implications for closing the loop.
Transportation Research Part E 2008, 44 (1), 1-18.
[19] Fleischmann, M., Beullens, P., Bloemhof-Ruwaard, J.M., Van Wassenhove, L.N. The impact of
product recovery on logistics network design. Production & Operations Management 2001, 10,
156-173.
[20] Yu, H., Solvang, W.D. A reverse logistics network design model for sustainable treatment of
multi-sourced waste of electrical and electronic equipment (WEEE). Proceeding of the 4
th
IEEE
International Conference on Cognitive Infocommunications. Budapest, Hungary, 2013, pp: 595-
600.
[21] Cheng, S., Chan, C.W., Huang, G.H. An integrated multi-criteria decision analysis and inexact
mixed integer linear programming approach for solid waste management. Engineering
Applications of Artificial Intelligence 2003, 16, 543-554.
[22] Yu, H., Solvang, W.D., Yuan, S. A multi-objective decision support system for simulation and
optimization of municipal solid waste management system. Proceeding of the 3
rd
IEEE
International Conference on Cognitive Infocommunications. Kosice, Slovakia, 2012, pp: 193-199.
International Journal of Energy and Environment (IJEE), Volume 5, Issue 4, 2014, pp.403-418
ISSN 2076-2895 (Print), ISSN 2076-2909 (Online) ©2014 International Energy & Environment Foundation. All rights reserved.
416
[23] Elhedhli, S., Merrick, R. Green supply chain network design to reduce carbon emissions.
Transportation Research Part D 2012, 17, 370-379.
[24] Farahani, R.Z., Rezapour, S., Drezner, T., Fallah, S. Competitive supply chain network design: An
overview of classification, models, solution techniques and applications. Omega 2014, 45, 92-118.
[25] Shen, Z.J. Integrated supply chain models: a survey and future research directions. Journal of
Industrial Management and Optimization 2007, 3 (1), 1-27.
[26] Wang, F., Lai, X.F., Shi, N. A multi-objective optimization for green supply chain network design.
Decision Support System 2011, 51, 262-269.
[27] Govindan, K., Jafarian, A., Khodaverdi, R., Devika, K. Two-echelon multiple-vehicle location-
routing problem with time windows for optimization of sustainable supply chain network of
perishable food. International Journal of Production Economics 2014,
[28] Quariguasi-Frota-Neto, J., Bloemhof-Ruwaard, J.M., Van Nunen, J.A.E.E., Van Heck, E.
Designing and evaluating sustainable logistics networks. International Journal of Production
Economics 2008, 111, 195-208.
[29] Harris, I., Naim, M., Palmer, A., Potter, A., Mumford, C. Assessing the impact of cost
optimization based on the infrastructure modelling on CO
2
emissions. International Journal of
Production Economics 2011, 131, 313-321.
[30] Ubeda, S., Arcelus, F.J., Faulin, J. Green logistics at eroski: a case study. International Journal of
Production Economics 2011, 131, 44-51.
[31] Abdallah, T., Farhat, A., Diabat, A., Kennedy, S. Green supply chains with carbon trading and
environmental sourcing: formulation and life cycle assessment. Applied Mathematical Modelling
2012, 36, 4271-4285.
[32] Jamshidi, R., FatemiGhomi, S.M.T., Karimi, B. Multi-objective green supply chain optimization
with a new hybrid memetic algorithm using the Taguchi method. ScientiaIranica E 2012, 19 (6),
1876-1886.
[33] Latha Shankar, B., Basavarajappa, S., Kadadevaramath, R.S., Chen, J.C.H. A bi-objective
optimization of supply chain design and distribution operations using non-dominated sorting
algorithm: A case study. Expert Systems with Applications 2013, 40, 5730-5739.
[34] Sheu, J B., Lin, A.Y S. Hierarchical facility network planning model for global logistics network
configuration. Applied Mathematical Modelling 2012, 36, 3053-3066.
[35] Ene, S., Ozturk, N. Open loop reverse supply chain network design. Procedia – Social and
Behavioral Sciences 2014, 109, 1110-1115.
[36] Zeballos, L.J., Mendez, C.A., Barbosa-Povoa, A.P., Novais, A.Q. Multi-period design and
planning of closed-loop supply chains with uncertain supply and demand. Computers and
Chemical Engineering 2014,
[37] Pishvaee, M.S., Razmi, J. Environmental supply chain network design using multi-objective fuzzy
mathematical programming. Applied Mathematical Modelling 2012, 36, 3433-3446.
[38] Ramezani, M., Kimiagari, A.M., Karimi, B., Hejazi, T.H. Closed-loop supply chain network
design under a fuzzy environment. Knowledge-Based Systems 2014, 59, 108-120.
[39] Amin, S.H., Zhang, G.Q. A multi-objective facility location model for closed-loop supply chain
network under uncertain demand and return. Applied Mathematical Modelling 2013, 37, 4165-
4176.
[40] Yu, M C., Goh, M. A multi-objective approach to supply chain visibility and risk. European
Journal of Operational Research 2014, 233, 125-130.
[41] Nema, A.K., Gupta, S.K. Optimization of regional hazardous waste management systems: an
improved formulation. Waste Management 1999, 19, 441-451.
[42] Sheu, J B. A coordinated reverse logistics system for regional management of multi-source
hazardous wastes. Computers & Operations Research 2007, 34, 1442-1462.
International Journal of Energy and Environment (IJEE), Volume 5, Issue 4, 2014, pp.403-418
ISSN 2076-2895 (Print), ISSN 2076-2909 (Online) ©2014 International Energy & Environment Foundation. All rights reserved.
417
Hao Yu received his B.Eng degree in Environmental Engineering from Beijing Institute of
Petrochemical Technology, P.R. China, in 2008, and his M.Sc degree in Industrial Engineering from
Narvik University College, Norway, in 2012. He is currently working as a research assistant at
Department of Industrial Engineering, Narvik University College. His research interests include
computational optimization, operational research, mathematical modelling as well as their applications
in supply chain management, transportation and logistics network design, and waste management.
E-mail address:
Wei Deng Solvang received her M.Sc. in the field of Production Engineering at Narvik University
College, Norway in 1997. In 2001, she received her Ph.D. from Norwegian University of Science and
Technology, Norway, in the field of performance measurement in managing supply chains. Dr. Solvang
is currently working as Associated Professor at Narvik University College, Norway. She has over
extensive publications at peer-reviewed international conferences and journals. Her main interest fields
are supply chain management and sustainable logistics. She is a member of the Nordic Logistics
Research Network (NOFOMA), Production and Operations Management Society (POMS) and the
Association of European Operational Research Society as well as the Supply Chain Council. Dr.
Solvang is also the Department Head of Industrial Engineering at Narvik University College, Norway.
E-mail address:
Chen Chen received her Bachelor degree in Biology from Faculty of Life Science in Hubei University,
P.R. China, in 2008, and her M.Sc degree in Energy and Environmental Technology from Telemark
University College, Norway, in 2011. She started a PhD work at Norut Narvik AS since then. The main
task of her PhD work is to optimize a conceptual designed integrated chemical complex with natural gas
and locally sourced minerals as the main raw materials.
E-mail address:
International Journal of Energy and Environment (IJEE), Volume 5, Issue 4, 2014, pp.403-418
ISSN 2076-2895 (Print), ISSN 2076-2909 (Online) ©2014 International Energy & Environment Foundation. All rights reserved.
418


![enterprise network testing [electronic resource] the role and applications of testing in pre-peployment, migration, and post-deployment, network operations](https://media.store123doc.com/images/document/14/y/oy/medium_bedjLstRkh.jpg)