Design, fabrication and characterization of thin film materials for heterojunction silicon wafer solar cells
Bạn đang xem bản rút gọn của tài liệu. Xem và tải ngay bản đầy đủ của tài liệu tại đây (2.1 MB, 182 trang )
DESIGN, FABRICATION AND
CHARACTERISATION OF THIN-FILM
MATERIALS FOR HETEROJUNCTION SILICON
WAFER SOLAR CELLS
LING ZHI PENG
(B. Eng.(Hons.), NUS)
A THESIS SUBMITTED
FOR THE DEGREE OF DOCTOR OF
PHILOSOPHY
DEPARTMENT OF ELECTRICAL AND
COMPUTER ENGINEERING
NATIONAL UNIVERSITY OF SINGAPORE
2014
i
DECLARATION
I hereby declare that this thesis is my original work and it
has been written by me in its entirety. I have duly
acknowledged all the sources of information which have
been used in the thesis.
This thesis has also not been submitted for any degree in
any university previously.
Gordon Ling
LING Zhi Peng
8 November 2014
ii
ACKNOWLEDGMENTS
I would like to express indebted gratitude to my supervisor Prof Armin
G. Aberle. He was always fast in providing useful feedback and suggestions to
improve the quality of the technical work. I am also deeply grateful to my
co-supervisors Dr Thomas Mueller and Dr Rolf Stangl for the valuable
scientific discussions on solar cell related topics, and for providing the funds
to present selected research work in reputable local and international
conferences, and a chance to meet peers with similar interests in the photo-
voltaic field.
For the first two years of my experimental work, I would like to thank
Dr Per Widenborg for the usage of the clustertool which was undoubtedly the
most-used tool during my research programme. I would also like to thank
Dr Prabir Kanti Basu for the training on the wet-bench procedures, and being
so accommodating to the students’ request for usage time despite the multiple
industry projects on-going at that time. I would also like to thank various
mentors (including Dr Lin Jiaji, Dr Lin Fen, Dr Felix Law, Dr Long Jidong,
Pooja Chaturvedi, and Jason Avancena) for their training on essential
characterisation tools such as photoluminescence, UV-VIS-IR spectro-
photometry, ellipsometry, micro-Raman spectroscopy, quasi-steady-state/
transient photoconductance decay, four-point probe, FTIR spectroscopy,
scanning electron microscopy (SEM), stylus profilometry, optical profilometry
and ECV profiling. Their willingness to share their time and knowledge has
made my work easier and much more enjoyable.
For the last two years of my work, more focus was placed on device
modelling, and I would like to thank Dr Ma Fajun for sharing his technical
expertise and some of his developed simulation programmes using Sentaurus
TCAD. I am also grateful to Shubham Duttagupta for sharing a lot of the
intensity dependent effective carrier lifetime data for wafers under different
passivation schemes. His work on silicon nitride and aluminium oxide surface
passivation provided a strong support for our hybrid heterojunction solar cell
concepts utilizing rear point contacts scheme.
iii
I also like to acknowledge the contributions of several PhD students in
our group, including Ge Jia for his work on the intrinsic amorphous silicon
buffer layers, Ankit Khanna for his work on metallization, Tang Muzhi for his
work on surface texturing, and Huang Mei for her work on transparent
conductive oxide films. The synergy and mutual support within the team
helped to make the process more manageable.
iv
Table of Contents
List of Tables x
List of Figures xi
List of publications xvii
CHAPTER 1 : Introduction 1
1.1 Overview of today’s solar cell market 1
1.2 Heterojunction silicon wafer solar cells 3
1.2.1 Motivation and key advantages 3
1.2.2 Key limitations to cell performance 5
1.2.3 Alternative concept: Conductive distributed Bragg reflector suppressing
rear optical losses 7
1.2.4 Alternative concept: Hybrid silicon solar cell with rear-side heterojunction
point contacts suppressing front side optical losses 8
1.3 Thesis motivation 9
1.4 Thesis outline 11
CHAPTER 2 : Background 14
2.1 History of heterojunction silicon wafer solar cells 14
2.2 Working principles of heterojunction silicon solar cells 15
2.3 Loss mechanisms in the solar cells 18
2.4 PECVD process and considerations 21
2.5 Distributed Bragg reflector (DBR): working principle 25
2.6 Hybrid heterojunction silicon wafer solar cells: working principle 31
2.7 Basics of semiconductor device modelling 32
CHAPTER 3 : Design, fabrication and characterisation of doped silicon thin films 38
3.1 Methodology 38
3.2 Results and discussion 42
3.2.1 Investigation of doped film uniformity 42
3.2.2 Effect of film thickness on crystallinity and electrical properties 45
3.2.3 Effect of film thickness on optical properties 51
3.2.4 Effect of doping gas concentration on film conductivity and crystallinity . 53
3.3 Integration of doped thin-film layers in device precursors 60
3.3.1 Investigation of doped film on intrinsic a-Si:H substrates 60
3.3.2 Combined passivation quality using doped/intrinsic silicon thin-film stacks .
66
3.3.3 Comparison with previous work 71
3.4 Chapter summary 74
v
CHAPTER 4 : Three-dimensional numerical modelling of heterojunction silicon
wafer solar cells 77
4.1 Different heterojunction silicon solar cell designs to be investigated 77
4.2 Basic numerical models 79
4.3 Calibration of diffusion profiles 82
4.4 Calibration of thin films deposited on diffused and undiffused wafers 83
4.5 Calibration of interface properties 87
4.5.1 Interface towards dielectric passivation layers 87
4.5.2 Interface towards thin-film silicon layers 88
4.6 Influence of interface defect density on device performance 89
4.7 Chapter summary 93
CHAPTER 5 : Evaluating heterojunction solar cells using a conductive distributed
Bragg reflector (DBR) with µc-Si:H(n) and ZnO:Al 95
5.1 Methodology 95
5.2 Results and discussion 98
5.2.1 Optical constants of the deposited thin films 98
5.2.2 Calculation of the peak reflectance using a conductive DBR 99
5.2.3 Conductive DBR on glass substrates 101
5.2.4 Conductive DBR on metal substrates 104
5.2.5 Evaluating heterojunction solar cell performance using a conductive DBR
108
5.2.5.1 Reflectance, Absorptance, Transmittance 110
5.2.5.2 Optical generation / photogeneration current density 113
5.2.5.3 Current-voltage characteristics 114
5.2.6 Comparison with state-of-the-art concepts 117
5.3 Chapter summary 118
CHAPTER 6 : Evaluating hybrid heterojunction solar cells with rear heterojunction
point contacts 120
6.1 Methodology 120
6.2 Results and discussion 122
6.2.1 Band diagrams 122
6.2.2 Comparison of hybrid solar cells to diffused solar cells 125
6.2.2.1 Analysis of open-circuit voltage 129
6.2.2.2 Analysis of short-circuit current 132
6.2.2.3 Analysis of fill factor 137
6.2.3 Comparison of hybrid cells to conventional heterojunction cells 140
6.3 Chapter summary 143
vi
CHAPTER 7 : Summary and further work 146
BIBLIOGRAPHY 151
APPENDIX A 161
vii
SUMMARY
This thesis focuses on the development of doped silicon thin films
suitable for device integration into heterojunction silicon wafer solar cells and
subsequently the modelling of heterojunction and hybrid heterojunction silicon
wafer solar cells that utilize these films. Three key research areas were
investigated: 1) development of doped silicon films that exhibit low parasitic
absorption loss, high conductivity, and low damage to underlying intrinsic
buffer layer; 2) reducing rear optical losses by adopting a conductive
distributed Bragg reflector using the developed conductive films; and 3)
reducing front optical losses by using a novel hybrid heterojunction silicon
wafer solar cell concept. The key findings are listed below:
Firstly, the optimised doped silicon films are found to exhibit a film
microstructure in the transition of amorphous to microcrystalline phase, and
exhibit the desired high optical transparency, high electrical conductivity, and
do not degrade the underlying intrinsic buffer layer responsible for the surface
passivation of the silicon wafer. The feasibility of the developed doped silicon
films for device integration was also demonstrated from the measured
intensity dependent effective carrier lifetime curves of heterojunction carrier
lifetime structures [p
+
/i/c-Si(n)/i/p
+
] and solar cell structures [p
+
/i/c-Si(n)/i/n
+
]
as compared to [i/c-Si(n)/i] structures alone. Simulation studies suggest that
the optimal deposition condition of the doped silicon films coupled with a
post-deposition hydrogen annealing step achieves both efficient field effect
passivation, as well as further improvement to the a-Si:H(i)/c-Si interface
quality (~2 orders of magnitude reduction in the interface defect density).
viii
Secondly, given the cost motivations for thinner silicon wafers, and the
importance of light trapping for such wafers, a novel conductive distributed
Bragg reflector (DBR) consisting of the in-house developed doped micro-
crystalline silicon films μc-Si:H(n) and an additional transparent conductive
oxide film ZnO:Al has been developed for increasing the rear interface optical
reflectance for near-infrared photons. Although these conductive films exhibit
non-zero extinction coefficients, resulting in a certain degree of parasitic
absorption, it is demonstrated in this thesis that the advantages far outweigh
the disadvantages in which an increasing number of DBR unit blocks lead to
(a) an increased peak reflectance and (b) an increased conductivity of the
combined stacks. For the target peak reflectance wavelength range of 900 ±
200 nm, a peak reflectance of over 90% and a sheet resistance of less than
10 Ω/□ have been achieved for 5 DBR unit blocks on a glass substrate.
Simulation studies further demonstrate the feasibility of the proposed
conductive DBR for device integration, given that heterojunction silicon solar
cells using 5 DBR unit blocks delivers an efficiency improvement of 7.3%
(relative), i.e., from 21.9 to 23.5 % (absolute) as compared to the standard film
thicknesses.
Finally, to reduce the front optical losses (in particular the parasitic
absorption losses by the front TCO/silicon layers), a novel hybrid hetero-
junction silicon wafer solar cell concept utilizing a diffused front surface and
heterojunction rear point contacts was proposed and numerically analysed.
Hybrid heterojunction solar cells utilizing a diffused front surface are
evaluated to exhibit higher J
SC
potential (> 40 mA/cm
2
), and improved fill
factor exceeding that of the conventional heterojunction silicon solar cells.
ix
Rear point contacts are shown to improve the cell efficiency, although an
independent optimisation of the point-contact size is required for both front
and rear emitter devices in order to balance the gain in V
OC
and J
SC
with the
drop in FF with shrinking rear contact area fractions, which will determine the
optimum contact geometry for the highest solar cell efficiency. In particular,
using the diffusion profiles and heterojunction layers as processed in SERIS, a
simulated cell efficiency of 23.4 % for the hybrid(a-Si) solar cell is predicted
(as compared to a diffused solar cell efficiency of 22.7 % and a heterojunction
solar cell efficiency of 23.0 %).
x
List of Tables
Table 2.1. Cell efficiencies for heterojunction silicon solar cells from various
institutes / companies depending on wafer material and cell area. 15
Table 3.1. Overview of p-doped silicon thin film PECVD process parameters. A
design of experiment varying deposition pressure, substrate temperature, and
hydrogen dilution ratio is investigated. 41
Table 3.2. Overview of n-doped silicon thin film PECVD process parameters. A
design of experiment varying deposition pressure, substrate temperature, and
hydrogen dilution ratio is investigated. 42
Table 3.3. The recorded DC bias for the p-doped silicon thin film samples according
to Table 3.1. A high DC bias (> 900 V) occurs for deposition pressures of 500 mTorr,
independent of the choice of temperature or dilution ratio. 44
Table 3.4. Variation of hydrogen dilution ratio for p-doped silicon thin-film layers
deposited on a-Si:H substrates. 61
Table 3.5. Deposition conditions for the carrier lifetime samples. 68
Table 4.1. 3D modelling of conventional heterojunction solar cells, as sketched in
Figure 4.1(c). D
it
is the interface defect density at the a-Si:H(i)/ c-Si(n) interface. The
simulated results of this thesis (labelled “SIM(this work)”) are compared to
experimental results by Taguchi et al. [133] (labelled “EXP”), and to the
corresponding 1D simulation results as reported by Rahmouni et al. [127] (labelled
“SIM(literature)”). 81
Table 4.2. Simulation input parameters for modelling the bulk properties of the c-Si
wafer and of the a-Si and µc-Si thin-film layers, based on [127] as well as on the
fitting of the lifetime samples of Figure 4.4. The activation energy (i.e. position of the
Fermi level relative to the majority carrier band) is included based on the chosen
simulation parameters. 85
Table 4.3. Extracted interface parameter towards the c-Si wafer from fitting the
[SiN
x
/AlO
x
/c-Si(n)/AlO
x
/SiN
x
] and [SiN
x
/c-Si(n)/SiN
x
] effective lifetime curves for
both un-diffused and diffused wafers 88
Table 4.4. Assumed interface defect density D
it
for lifetime structures, symmetrically
passivated by a-Si:H(i), a-Si:H(i)/a-Si:H(p) or a-Si:H(i)/a-Si:H(n) respectively, in
order to get a decent fit as seen in Figure 4.4, and used in all further simulations to
model the heterojunction contacts of the solar cells. The interface defect distribution
is defined as two Gaussian dangling bond distributions with correlation energy of 0.2
eV situated at 0.46 eV and 0.66 eV from the valence band edge. 88
Table 4.5. Influence of a-Si:H(i)/c-Si interface defect density D
it
on simulated
effective carrier lifetime curves and standard heterojunction solar cell performance.
Improving D
it
directly improves the one-sun solar cell performance. 93
Table 5.1. Overview of process parameters for the μc-Si:H(n) and the ZnO:Al thin-
film layers. 97
Table 5.2. Calculated thicknesses for the μc-Si:H(n) and ZnO:Al films to achieve a
peak reflectance at 900 nm. 101
Table 5.3. Simulation input parameters for the µc-Si:H(n) thin films. 109
Table 5.4. Simulated solar cell performance of the heterojunction silicon wafer solar
cells as sketched in Figure 5.11. 116
xi
List of Figures
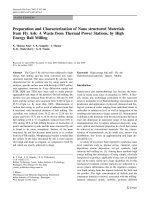
Figure 1.1. Average annual growth rates of renewable energy capacity and biofuel
production, End-2008 to 2013 [2]. 1
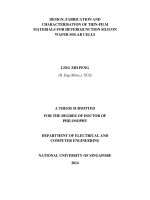
Figure 1.2. Evolution of global photovoltaic cumulative installed capacity (MW)
from 2004 to 2013 [2]. 2
Figure 1.3. Schematic of a conventional diffused silicon wafer solar cell structure. 4
Figure 1.4. Schematic of a heterojunction silicon wafer solar cell architecture
(Panasonic “HIT” solar cell structure, as reported in [8, 9]). 4
Figure 1.5. Illustration of losses that occur in HET solar cells (from Ref. [12]). 6
Figure 1.6. Schematic of a heterojunction Si wafer solar cell with a conductive
“Distributed Bragg Reflector” (DBR) placed at the rear of a silicon wafer. Over here,
3 DBR unit blocks consisting of alternating layers of n-doped microcrystalline Si
films and Al-doped zinc oxide TCO films are utilized. 7
Figure 1.7. Schematic of a hybrid heterojunction silicon solar cell (adopting a front-
side full-area diffused homojunction emitter / FSF and rear-side heterojunction point
contacts) for both the (a) front emitter and (b) rear emitter configuration respectively.
9
Figure 2.1. (a) Schematic of a typical heterojunction silicon wafer solar cell. (b)
Corresponding band diagram [31]. Note: The lateral dimensions are not to scale, i.e.
the thin-film layer thicknesses are greatly exaggerated, in order to sketch the band
bending in these ultra-thin films. 15
Figure 2.2. Schematic representation of a PECVD processing chamber of the
clustertool. . 22
Figure 2.3. Typical reaction sequence in PECVD [47]. 22
Figure 2.4. Schematic of a heterojunction silicon wafer solar cell with a conductive
“distributed Bragg reflector” (DBR) placed at the rear of a silicon wafer. In the case
shown here, 3 DBR unit blocks consisting of alternating layers of n-doped
microcrystalline silicon films and Al-doped zinc oxide TCO films are utilized. 26
Figure 2.5. Schematic of a one-dimensional photonic crystal (‘distributed Bragg
reflector’, DBR). The DBR consists of several DBR unit blocks. Each DBR unit
block consists of alternating layers of two materials with different dielectric constants,
with a period a. From Ref. [70]. 27
Figure 2.6.Gap-midgap ratio Δ0/0 of a DBR unit block as a function of the
refractive index contrast R = n
1
/n
2
. 29
Figure 2.7. Calculated peak reflectance of a DBR at the peak reflectance wavelength
λ
0
with respect to the number of DBR unit blocks used, assuming air as ambient (n
0
=
1), glass as substrate (n
s
= 1.51), and using R = n
1
/n
2
. Two hypothetical scenarios are
shown: (i) DBR unit blocks with a refractive index contrast R=1.5 and (ii) a refractive
index contrast R=3.5 30
Figure 2.8. Schematic of a hybrid rear-side heterojunction point contacted solar cell,
as proposed in [14]. 31
Figure 3.1. Photograph of the clustertool used for this work. The clustertool consists
of four separate radio frequency (RF) 13.56 MHz excitation parallel-plate PECVD
chambers, and one sputtering chamber for TCOs. 39
Figure 3.2. Cross-sectional view of doped silicon film optimisation on a planar glass
substrate. A film thickness of ~40 nm is utilized for initial characterisation purposes.
41
xii
Figure 3.3. Doped silicon thin film uniformity as a function of substrate temperature
and deposition pressure. 42
Figure 3.4. Doped silicon thin film uniformity as a function of dilution ratio
R=H
2
/SiH
4
and deposition pressure. 43
Figure 3.5. Correlation of DC bias with (a) doped silicon thin film uniformity and (b)
deposition pressure. Low deposition pressure is associated with high DC bias and
increased ion bombardment, resulting in poor film uniformity. 44
Figure 3.6. Raman spectra of a typical in-house developed p-doped microcrystalline
silicon thin film. The black, green and red lines correspond to the measured Raman
spectra, the Gaussian fits for the three silicon phases, and the resulting fit respectively.
The peak position of the crystalline silicon TO spectral band ω
TO(silicon)
corresponds to
519.17 cm
-1
for this sample. 46
Figure 3.7. Raman spectra of five p-doped silicon thin films of different thicknesses
on a glass substrate. Deposition conditions: pressure 1.9 Torr, substrate temperature
180 ºC, dilution ratio R = 32. The Raman spectrum of the p-doped silicon film is
observed to shift towards 520 cm
-1
with increasing thickness, indicating increasing
crystallinity. 48
Figure 3.8. Impact of p-doped silicon thin-film thickness on film crystallinity and
conductivity. 48
Figure 3.9. Variation of bond angle disorder Δθ on increasing p-doped silicon film
thicknesses on a glass substrate. The line serves as a guide to the eye. 49
Figure 3.10. Variation of amorphous TO Raman peak ω
TO(a-Si)
on increasing p-doped
silicon film thicknesses on a glass substrate. The line serves as a guide to the eye. 50
Figure 3.11. Variation of crystalline TO Raman peak ω
TO(silicon)
on increasing p-doped
silicon thin film thicknesses on a glass substrate. The line serves as a guide to the eye.
50
Figure 3.12. Measured absorption coefficients of the deposited p-doped a-Si:H/μc-Si
films of different thicknesses in comparison to the absorption coefficient of intrinsic
c-Si. 52
Figure 3.13. Impact of B
2
H
6
flow on film crystallinity and conductivity of a 40 nm
thick p-doped silicon thin film on a glass substrate. 55
Figure 3.14. Impact of PH
3
flow on film crystallinity and conductivity of a 40 nm
thick n-doped silicon thin film on a glass substrate. 56
Figure 3.15. Comparison of the Raman spectrum for both 25 nm and 40 nm thick n-
doped silicon films deposited on a glass substrate with a PH
3
gas flow of 2 sccm. 56
Figure 3.16. Impact of the diborane (B
2
H
6
) gas flow on the amorphous TO Raman
peak ω
TO(a-Si:H)
for a 40 nm thick p-doped silicon thin film on a glass substrate. The
line serves as a guide to the eye. 57
Figure 3.17. Impact of the diborane (B
2
H
6
) gas flow on the crystalline TO Raman
peak ω
TO(silicon)
as extracted from the peak fitting of respective Raman spectra of a 40
nm thick p-doped silicon thin film on a glass substrate. The line serves as a guide to
the eye. 57
Figure 3.18. Impact of the phosphine (PH
3
) gas flow on the crystalline TO Raman
peak ω
TO(silicon)
as extracted from the peak fitting of respective Raman spectra. The
line serves as a guide to the eye. 59
Figure 3.19. Cross-sectional view of a p-doped silicon thin film on an intrinsic a-Si:H
thin film on a planar glass substrate. 61
xiii
Figure 3.20. Influence of the hydrogen dilution ratio on the deposition rate of p-doped
films on two different substrates. 62
Figure 3.21. Film crystallinity as a function of the hydrogen dilution ratio R. The
squares represent ~10 nm thick p-doped Si films deposited on intrinsic a-Si:H
substrates. The star represents an intrinsic a-Si:H film (~5 nm) on a glass substrate. 63
Figure 3.22. Impact of the hydrogen dilution ratio R on the Raman spectra of p-doped
silicon/intrinsic a-Si:H stacks on glass substrates. At high dilution ratio R = 60, an
additional TO Raman peak starts to appear near 520 cm
-1
, indicative of an
increasingly crystalline phase. 63
Figure 3.23. Impact of hydrogen dilution ratio R on the bond angle disorder Δθ for p-
doped silicon thin film (~10 nm) deposited on a thin intrinsic a-Si:H (5 nm) layer.
The squares represent the p-doped silicon/intrinsic a-Si:H stacks on glass. The star
represents the intrinsic a-Si:H layer (5 nm) on glass. 64
Figure 3.24. Injection level dependent effective carrier lifetime curves of bifacial
heterojunction structures symmetrically passivated with intrinsic a-Si:H layers only
(circles) and complete layer stacks (squares). 70
Figure 3.25. Implied V
oc
of the bifacial heterojunction lifetime structure as a function
of light intensity. The implied V
oc
at one sun is 725 mV. 70
Figure 3.26. Implied V
oc
of the heterojunction solar cell structure. An improvement of
~100 mV in implied V
oc
is observed upon application of the p-doped and n-doped
silicon thin-film layers. The implied V
oc
at 1 sun for the solar cell structure p
+
/i/c-
Si(n)/i/n
+
is 650 mV. The corresponding minority carrier lifetime improves by a
factor of ~12 at the injection level of 10
15
cm
-3
. 71
Figure 4.1. Schematic of the investigated cell types used in this thesis. (a) Diffused
homojunction cells, (b) hybrid (homojunction/heterojunction) cells, (c) conventional
full-area heterojunction cells, (d) full-area heterojunction cells that utilize conductive
distributed Bragg reflector (DBR) stacks. All cells are sketched in a front-emitter
configuration. 79
Figure 4.2. Schematic of the simulated solar cell structure, including the 3D
symmetry element used within the simulations (“simulated structure”). 80
Figure 4.3. Measured B and P diffusion profiles developed in-house (symbols), and
the corresponding simulated fit (lines). For the phosphorus profile, an additional etch-
back profile is adopted and simulated. 83
Figure 4.4. Measured (symbols) and simulated (lines) carrier lifetime curves of un-
diffused and symmetrically diffused n-type Cz Si wafers, passivated by various
passivation layers, representing the contact regions and the passivated regions of the
various solar cell architectures mentioned in Section 4.1. The measured diffusion
profiles of Figure 4.3 as well as the measured interface charge and interface defect
distribution of Figure 4.6. serve as input parameters for the lifetime simulation. The
reverse saturation current densities J
o
of the various solar cell regions are additionally
stated. The intrinsic lifetime limit of the wafer according to the model by Richter et
al. [138] is also indicated (i.e. assuming ideal surfaces with zero surface
recombination). 84
Figure 4.5. Graphical representation of the bulk defect distribution of the calibrated a-
Si and µc-Si films for subsequent simulation. The activation energy E
ac
is indicated as
well. 86
xiv
Figure 4.6. Measured energetic distribution of interface defects D
it
(E) and fixed
charge density Q
f
of an n-type c-Si substrate symmetrically passivated by either SiN
x
or an AlO
x
/SiN
x
stack. 87
Figure 4.7. Simulated effective carrier lifetime curves of differently passivated
structures. The a-Si:H(i)/c-Si(n) interface defect density D
it
is assumed to be fixed at
4.6
10
12
cm
-2
eV
-1
for all lifetime structures with passivation layer stacks. The
application of doped silicon thin-film layers provides field effect passivation, evident
from the improved effective lifetimes at low injection levels as compared to the i/c-
Si(n)/i structure. The c-Si(n) substrate is assumed to have a bulk lifetime of 10 ms
and to have only a single-level defect at midgap. 90
Figure 4.8. Influence of increasing interface defect density on the simulated injection
level dependent effective carrier lifetime curves for [i/c-Si/i] structures. 91
Figure 5.1. Schematic of a modified heterojunction silicon solar cell, using a rear-side
conductive distributed Bragg reflector, consisting of multiple stacks of µc-Si:H(n)
and ZnO:Al, in order to achieve a high internal optical reflectance. The rear interface
optical reflectance is calculated within the boxed region, as will be elaborated in
Section 5.2.5.1. 96
Figure 5.2. Measured (a) refractive index n and (b) extinction coefficient k of the
investigated n-type hydrogenated microcrystalline silicon film and TCO film
(ZnO:Al). Also shown, for comparison, are the corresponding values for high-quality
monocrystalline silicon [12] and PECVD amorphous silicon [46]. 99
Figure 5.3. Calculated upper and lower peak reflectance limits as a function of the
peak reflectance wavelength based on the wavelength dependent refractive indices of
μc-Si:H(n) and ZnO:Al. 100
Figure 5.4. Cross-sectional SEM image of a fabricated distributed Bragg reflector
consisting of 142 nm thick ZnO:Al and 69 nm thick μc-Si:H(n) films, deposited on a
glass substrate. The white dashed lines show the DBR unit blocks. 101
Figure 5.5. Measured optical reflectance as a function of wavelength for
air/DBR/glass samples with 5 different numbers of DBR unit blocks. The samples
were illuminated from the film side. 102
Figure 5.6. Comparison of measured (M) and simulated (S) results for (a) one DBR
unit block on a glass substrate and (b) 3 DBR unit blocks on a glass substrate. Each
DBR unit block consist of optimised thicknesses for μc-Si:H(n) and ZnO:Al. 103
Figure 5.7. Influence of the number of DBR unit blocks on the measured sheet
resistance and peak reflectance at the target wavelength of 900 nm. 104
Figure 5.8. Simulated (S) reflectance of the optimised DBR on an Al-coated substrate
with different numbers of DBR unit blocks. 105
Figure 5.9. Measured (M) and simulated (S) reflectance of the optimised DBR on an
Al-coated substrate for (a) one double-layer unit block and (b) two double-layer unit
blocks. 106
Figure 5.10. Comparison of simulated reflectance of (i) optimised DBR stack
thickness on a Al-coated substrate and (ii) standard μc-Si:H(n) and ZnO:Al thickness
on an Al-coated substrate. For the DBR stack, the μc-Si:H(n) and ZnO:Al layer
thickness is chosen as 69 nm, and 142 nm respectively. For the standard, the μc-
Si:H(n) and ZnO:Al thickness is chosen as 20 nm and 80 nm, respectively. 107
Figure 5.11. Schematic of a modified heterojunction silicon wafer solar cell structure
with a planar rear surface using either (a) standard thicknesses for the a-Si:H(n) BSF
xv
and ZnO:Al thin films or (b) optimised layer thicknesses for µc-Si:H(n) BSF and
ZnO:Al in order to achieve high internal optical reflectance at a peak wavelength of
900 nm. 110
Figure 5.12. (a) Calculated internal interface reflectance, (b) combined absorbance by
the conductive DBRs and (c) transmittance through the conductive DBRs for a
heterojunction silicon wafer solar cell sketched in Figure 5.11(b), i.e., a
c-Si/a-Si:H(i)/DBR(µc-Si/TCO)/air configuration. The thicknesses for the intrinsic a-
Si:H, µc-Si:H(n) and ZnO:Al are 3, 69 and 142 nm, respectively, for the conductive
DBR. For the standard case, the thicknesses for a-Si:H(n) and ZnO:Al are 20 and 80
nm, respectively. 112
Figure 5.13. (a) Simulated optical generation profile for the non-contacted regions in
the schematic of Figure 5.11; (b) Corresponding integrated photogeneration current
density as a function of the position within the wafer. 113
Figure 5.14. Simulated J-V characteristics of heterojunction silicon wafer solar cells
as sketched in Figure 5.11, using variable numbers of DBR unit blocks. The insets
show a zoom-in at the short-circuit current density and near the maximum power
point regions. 115
Figure 5.15. Comparison of the simulated J-V characteristics of the heterojunction Si
solar cell in Figure 5.11 with the standard rear a-Si:H(n)/ZnO:Al film thicknesses or
the 5 DBR unit blocks [µc-Si:H(n)/ZnO:Al] for both thick (220 µm) and thin (50 µm)
substrates. 117
Figure 6.1. Schematic of the 8 investigated cell types, investigating both front and
rear emitter configuration, using either diffused homojunction cells, hybrid
(homojunction/heterojunction) cells, or full-area heterojunction cells. 121
Figure 6.2. Band diagrams of hybrid(a-Si), hybrid(μc-Si), diffused and full-area
heterojunction solar cells under thermal equilibrium conditions, for both front- and
rear-emitter configuration. 123
Figure 6.3. Band diagram for hybrid(a-Si) solar cells using either a front emitter or a
rear emitter configuration under short-circuit and open-circuit conditions. In each
graph, two band diagrams are shown: (i) at the a-Si:H rear contact region and (ii) at
the centre of the rear passivated region. 125
Figure 6.4. Simulated solar cell J-V parameters (efficiency, open-circuit voltage,
short-circuit current, fill factor) under a variation of the rear point contact area
fraction for front emitter cells (left) and for rear emitter cells (right). Four solar cell
structures are compared: hybrid(a-Si) cells, hybrid(µc-Si) cells, conventional diffused
cells, and conventional full-area heterojunction cells. The solid, open, and half-open
symbols within the plot refer to the a-Si contacts, diffused contacts and µc-Si contacts
respectively. The symbols outside of the plot area refer to the full-area heterojunction
cells. 127
Figure 6.5. Comparison of (a) the carrier densities and (b) the total recombination
rates for a hybrid(a-Si) solar cell and a conventional diffused solar cell, using a full-
area rear contact in a front emitter configuration under open-circuit conditions. 131
Figure 6.6. Calculated internal optical reflectance at the rear-side of the c-Si wafer,
for the contact regions (i.e. c-Si/metal in case of diffused solar cells and c-Si/a-
Si/metal in case of hybrid heterojunction solar cells) and for the passivated regions
(i.e. c-Si/SiN
x
/metal). 133
Figure 6.7. A breakdown of the recombination current losses under short-circuit
conditions for hybrid(a-Si), hybrid(μc-Si) and diffused solar cells with a full-area rear
xvi
contact, in a front- or rear-side emitter device configuration, respectively. The
contribution percentage as well as the absolute value of the recombination current
loss is indicated. 135
Figure 6.8. Breakdown of the series resistance contributions for hybrid(a-Si) cells in a
front-emitter configuration, using rear-side a-Si:H(n
+
) heterojunction BSF layers
(coloured in red) and in a rear-emitter configuration, using rear-side a-Si:H(p
+
)
heterojunction emitter layers (coloured in green). 138
Figure 6.9. Comparison of the photogeneration current density (integrated photon
absorption rate over the thickness of the wafer) for diffused and hybrid cells as well
as for full-area heterojunction cells. Assuming a wafer thickness of 150 μm, the
photogeneration current density is 40.9 mA cm
-2
for diffused and hybrid cells, and
38.4 mA cm
-2
for heterojunction cells. 141
Figure 6.10. Simulated two-dimensional current flow of conventional heterojunction
silicon wafer solar cells under maximum power conditions, exhibiting a front-emitter
device configuration (left) or a rear-emitter device configuration (right). Under the
rear-emitter device configuration, additional lateral transport within the c-Si wafer is
observed. 142
Figure A-1. The percentage differences of the calculated gap-midgap ratio as a
function of wavelength for two scenarios (i) no absorption from the conductive thin
films (zero extinction coefficient) and (ii) with absorption. The difference is
significant for short wavelengths (λ 400 nm) due to the increasing extinction
coefficient of the μc-Si:H(n) film as it approaches the optical gap (absorption band
edge) [see Fig. 4]. 163
Figure A-2. Comparison of the calculated reflectance and absorbance of an air/5 DBR
unit blocks/air structure for two scenarios (i) no absorption from the conductive thin
films (zero extinction coefficient) and (ii) with absorption. The harmonics of the
reflectance spectra matches for both scenarios, while the lower peak reflectance at the
target wavelength of 900 nm for the practical case can be attributed mainly to
absorption in the conductive thin films. 163
xvii
List of publications arising from this thesis
Journal papers
[1] Ling Z.P., Mueller T., Aberle A.G., and Stangl R., “Development of a
conductive distributed Bragg reflector for heterojunction solar cells
using n-doped microcrystalline silicon and aluminium-doped zinc oxide
films”, IEEE Journal of Photovoltaics 4(6) (2014) 1320-1325.
[2] Ling Z.P., Ge J., Stangl R., Aberle A.G., and Mueller T., “Micro Raman
spectroscopy analysis of doped amorphous and microcrystalline silicon
thin film layers and its application in heterojunction silicon wafer solar
cells”, Trans. Mat. Res. Soc. Japan 39(1) (2014) 11-18.
[3] Ling Z.P., Ge J., Stangl R., Aberle A.G., and Mueller T., “Detailed
micro Raman spectroscopy analysis of doped silicon thin film layers and
its feasibility for heterojunction silicon wafer solar cells”, Journal of
Materials Science and Chemical Engineering 1 (2013) 1-14.
[4] Ge J., Ling Z.P., Wong J., Stangl R., Aberle A. G., and Mueller T.,
“Analysis of intrinsic hydrogenated amorphous silicon passivation layer
growth for use in heterojunction silicon wafer solar cells by optical
emission spectroscopy”, J. Appl. Physics 113 (2013) p. 234310.
In preparation:
[5] Ling Z.P., Duttagupta S., Ma F.J., Mueller T., Aberle A.G., and Stangl
R., “Three-dimensional numerical analysis of hybrid heterojunction
silicon wafer solar cells with heterojunction rear point contacts”, Sol.
Energy Mat. Sol. Cells (2014, under preparation).
Conference papers
[6] Ling Z.P., Ma F.J., Duttagupta S., Tang M., Ge J., Khanna A., Mueller
T., Aberle A.G., and Stangl R., “Three-dimensional numerical analysis
of hybrid heterojunction silicon wafer solar cells with front-side locally
diffused emitter and rear-side heterojunction BSF point contacts”, Proc.
28th European Photovoltaic Solar Energy Conference and Exhibition,
Paris, France, 2013, pp. 800-805.
[7] Ling Z.P., Ge J., Mueller T., Wong J., and Aberle A.G., “Optimisation
of p-doped μc-Si:H emitter layers in crystalline-amorphous silicon
heterojunction solar cells”, Energy Procedia 15 (2012) 118-128.
[8] Ge J., Ling Z.P., Tang M., Wong J., Huber M., Dippell T., et al.,
"Surface passivation properties of hydrogenated intrinsic amorphous
silicon thin films fabricated using a remote inductively coupled plasma
source”, Technical Digest of the 23rd International Photovoltaic Science
and Engineering Conference, Taipei, Taiwan, 2013, pp. 79.
xviii
[9] Ge J., Ling Z.P, Wong J., Stangl R., Aberle A.G., and Mueller T.,
“Optimisation of thin intrinsic amorphous silicon buffer layers for use in
heterojunction silicon wafer solar cells”, Technical Digest of the 22nd
International Photovoltaics Science and Engineering Conference,
Hangzhou, China, 2012, p. 85.
[10] Ge J., Ling Z.P., Wong J., Mueller T., and Aberle A.G., “Optimisation
of intrinsic a-Si:H passivation layers in crystalline-amorphous silicon
heterojunction solar cells”, Energy Procedia 15 (2012) pp. 107-117.
[11] Khanna A., Ling Z.P., Shanmugam V, Boreland M.B., Hayashi I., Kirk
D., Akimoto H., Aberle A.G., and Mueller T., “Screen printed metalli-
sation for silicon heterojunction solar cells”, Proc. 28th European Photo-
voltaic Solar Energy Conference and Exhibition, Paris, France, 2013, pp.
1336-1339.
1
CHAPTER 1 : Introduction
1.1 Overview of today’s solar cell market
Today’s society is highly energy dependent due to demands from
industrialization, urbanization and an increasing population. Based on the
world energy outlook report by the International Energy Agency (IEA) [1], the
world population is predicted to increase from 7 billion in 2011 to 8.7 billion
in 2035, which is a fundamental driver of energy demands, and the continued
dominance of fossil fuel usage will lead to dwindling reserves leading to
increased costs, further detrimental impacts to climate change and increased
CO
2
emissions. To address this issue, renewable energy sources are actively
pursued, and now exceed 19% of the global final energy consumption as of
recent reports [2]. In particular, solar photovoltaic experienced the fastest
capacity growth rates as compared to other energy technologies like
geothermal power, hydropower, wind or biofuels production (see Figure 1.1).
Figure 1.1. Average annual growth rates of renewable energy capacity and
biofuel production, End-2008 to 2013 [2].
2
In our context, it is estimated that the Earth receives an annual energy
of 10
18
kWh from the Sun which is about 20,000 times more than mankind’s
present annual energy consumption, and efforts to tap this inexhaustible
energy has grown tremendously [3] over the past decade (Figure 1.2). At the
end of the year 2013, the total photovoltaic (PV) installed capacity in the
world has reached 139 GW.
Different types of solar cell designs have already been demonstrated
[4], ranging from monocrystalline/multicrystalline solar cells, thin-film solar
cells, organic solar cells, tandem cells, concentrator cells and varying choice
of materials such as silicon, gallium arsenide (GaAs), copper indium selenide
(CIS), copper indium gallium selenide (CIGS), to cadmium telluride (CdTe).
It is appropriate to highlight that the dominant technology is presently based
on crystalline silicon, although thin-film technologies (in particular CIGS and
CdTe) are predicted to gain market share in the future [3, 5]. The focus of this
thesis is on heterojunction silicon wafer solar cells which utilize both,
crystalline silicon as well as thin-film silicon technologies.
Figure 1.2. Evolution of global photovoltaic cumulative installed capacity
(MW) from 2004 to 2013 [2].
3
1.2 Heterojunction silicon wafer solar cells
Crystalline silicon based photovoltaics [6] has dominated the global
market (present share ~90 %) over the past decade. Based on the crystalline
silicon technology, various high-efficiency solar cell architectures have been
reported [7], aiming to improve on the “standard” diffused solar cell archi-
tecture, in which the heterojunction silicon wafer solar cell concept is one of
the promising candidates with cell efficiencies exceeding 24 %. In the
following sections, a brief review of the conventional diffused solar cell
architecture is provided, and compared to the standard heterojunction solar
cell architecture. Furthermore, additional concepts to further improve on the
standard heterojunction solar cell architecture are briefly outlined, which will
be evaluated in the course of this thesis.
1.2.1 Motivation and key advantages
Meaningful photovoltaic action requires a structure in which symmetry
is broken. For a typical diffused solar cell structure depicted in Figure 1.3, the
boron-diffused emitter at the front and the phosphorus-diffused back surface
field (BSF) at the rear of the solar cell give rise to this required break in
symmetry. The photogenerated holes and electrons are collected at the front
emitter and rear BSF regions, respectively. Suitable dielectric passivation
films (i.e. SiN
x
layers in this schematic) are also deposited on the un-contacted
regions of the diffused solar cells, to serve two main purposes; firstly to
passivate the wafer surface, and secondly to act as an anti-reflection coating,
4
usually for a wavelength of 0.6 µm, which is close to the peak power of the
solar spectrum.
Figure 1.3. Schematic of a conventional diffused silicon wafer solar cell
structure.
In comparison, for a typical heterojunction silicon wafer solar cell
(HET) as shown in Figure 1.4, the deposition of various thin-film silicon
layers that exhibit different doping, different electron affinities and different
band gap energies onto the crystalline silicon substrate give rise to this
required break in symmetry instead.
Figure 1.4. Schematic of a heterojunction silicon wafer solar cell architecture
(Panasonic “HIT” solar cell structure, as reported in [8, 9]).
5
Compared to a homojunction silicon wafer solar cell that utilizes
diffused emitter and back surface field regions, heterojunction silicon wafer
solar cells present several unique features. The asymmetric band offsets of the
deposited layers can lead to an improved open-circuit voltage (V
OC
) due to
reduced recombination at interfaces and metal contacts. In the HET solar cell
concept, most thin film depositions are performed in the range of 150 - 250 ºC,
making the usage of thin wafers possible given the reduced thermal budget. It
is also reported that HET solar cells have a low temperature coefficient for
V
OC
, indicating high photovoltaic output in both cold and warm climates [10].
A good example is Panasonic’s “HIT” (Heterojunction with Intrinsic Thin
layer) cell which, in 2013, achieved a very high efficiency of 24.7% for a
bifacial structure (see Figure 1.4) based on a heterojunction stack of TCO/
doped/intrinsic amorphous silicon thin films on a thin crystalline silicon
substrate (< 100 μm) [8, 9]. Very recently, Panasonic also demonstrated a new
world record efficiency of 25.6 % for an all-back-contact “HIT” cell [11].
1.2.2 Key limitations to cell performance
Despite the high efficiency reported for the bifacial “HIT” cells, there
are still some key limitations to cell performance. These include optical losses
(i.e. at both the front and rear surfaces), recombination losses, and resistance
losses as illustrated in Figure 1.5. Novel concepts to overcome the optical
losses will be further elaborated in Chapter 2 and will be investigated within
this thesis.
6
Figure 1.5. Illustration of losses that occur in HET solar cells (from Ref. [12]).
The main losses can be summarized as follows:
(i) A good a-Si(i)/c-Si interface quality is a fundamental requirement to
reduce interface recombination losses, and to achieve high solar cell efficiency.
In this aspect, the optimization of the deposition conditions of subsequent
layers following the intrinsic a-Si:H buffer layer is also important, as the non-
optimum deposition conditions of the doped silicon films or TCO films can
degrade the underlying intrinsic buffer layer and consequently the interface
quality, leading to increased recombination losses.
(ii) The optical losses can be differentiated into the front and rear optical
losses. Given the cost motivations with thinner silicon wafers [13], reducing
rear optical losses becomes increasingly important, particularly for near-
infrared photons due to their much higher absorption depth as compared to
short-wavelength photons. On the other hand, a significant amount of the front
optical losses is contributed by the front TCO and the doped silicon films.
These heterojunction films need to be optimised for high conductivity in order