A decision support model for product end of life planning
Bạn đang xem bản rút gọn của tài liệu. Xem và tải ngay bản đầy đủ của tài liệu tại đây (10.38 MB, 237 trang )
A DECISION-SUPPORT MODEL
FOR PRODUCT END-OF-LIFE PLANNING
JONATHAN LOW SZE CHOONG
B.Eng. (Hons.), UNSW
M.Eng.Sc., UNSW
A THESIS SUBMITTED
FOR THE DEGREE OF DOCTOR OF PHILOSOPHY
NUS GRADUATE SCHOOL FOR INTEGRATIVE
SCIENCES AND ENGINEERING
NATIONAL UNIVERSITY OF SINGAPORE
2014
i
Declaration
I hereby declare that this thesis is my original work and it has been written by me in
its entirety. I have duly acknowledged all the sources of information which have been
used in the thesis.
This thesis has also not been submitted for any degree in any university previously.
Signed,
Jonathan Low Sze Choong
ii
Summary
Due to growing concern for the environment, legislations such as extended
producer responsibility (EPR) are increasingly being adopted around the world. In
order to comply with EPR laws, manufacturers have begun to embrace sustainable
production (manufacturing) strategies to seek the goal of the triple bottom line: social
integrity, environmental responsibility and profitability. One such strategy, which has
been mulled as the ultimate solution to sustainable production, is closed-loop
production. However, the adoption of closed-loop production is not straightforward.
In order for system engineers and managers to know where, how and when to close
the resource loops in production systems, models and tools are needed to provide
decision-support for product end-of-life (EoL) planning with an integrated perspective
of entire product life cycle.
With this in mind, a decision-support model for product EoL planning for
closed-loop production was developed. In this method, a complex (closed-loop)
production system is decomposed into smaller and simpler subsystems, and modelled
based on the product structure. This enables different resource flows, EoL options and
interdependencies between the mainstream production (MP) and EoL phases to be
isolated to the individual subsystems to be modelled. And through a seamless
application of dynamic programming (DP), the model enables us to determine the
optimal product EoL plan to close the product life cycle loop in the production system
based on the economic performance (i.e. net present value), environmental
performance (i.e. carbon emissions) or eco-efficiency improvement (i.e. balance or
trade-off between economic and environmental performance). In addition, to consider
iii
uncertainty and incorporate robustness in the product EoL planning, Monte Carlo
Simulation was also applied for a stochastic optimisation of the product EoL plan.
To demonstrate the application of the method, two case studies were carried out.
In the first case study, the application of the method to mechanical and industrial
products was demonstrated on a turbocharger. In the second case study, a flat-panel
display (FPD) monitor was used to demonstrate the application of the method to
consumer electronic products. The results from these case studies show that the
decision-support model is able to generate optimal product EoL plans depending on
the objective function set out by the user – i.e. maximise NPV, minimise carbon
emissions, or maximise eco-efficiency improvement. The results also show that the
model is able consider the risk attitude of the user (i.e. conservative, neutral or
optimistic) and generate optimal product EoL plans that are robust to the uncertainties
considered. Most importantly, the results of the case studies validate the effectiveness
of the model in providing decision-support for product EoL planning so as to optimise
production systems for robust closed-loop production.
iv
Acknowledgements
I would like to take this opportunity to express my gratitude to the people who have
given me help, support and motivation throughout the course of this thesis. First and
foremost, I would like to thank my thesis advisors Associate Professor Lu Wen Feng
and Dr. Song Bin for all their guidance and patience, and for keeping faith in me
throughout the years. I would also like to thank my ex-colleague and friend, Dr. Lee
Hui Mien for sharing her invaluable knowledge especially during the initial stages of
this thesis; my TAC chairperson, Dr. Lin Wei for taking time out from his busy
schedule and providing feedback on my work; the Executive Director of SIMTech,
Dr. Lim Ser Yong for his support; and Mr. Eric Li Zhengrong for his dedicated
assistance during the data collection stage. I would also like to extend my gratitude to
Professor Christoph Hermann for his insightful comments, which played an important
part in helping me improve the quality of the work done in this thesis. In addition, I
cannot forget to thank Professor Sami Kara, who in the first place, gave me the
opportunity and inspiration to do research in the area of life cycle engineering. Last
but not least, I am extremely grateful to my family for all their love and support. For
without them, I would not have had the strength and resilience to persevere and
overcome all the challenges I faced during the course of this thesis.
v
Table of Contents
Declaration i
Summary ii
Acknowledgements iv
Table of Contents v
List of Tables x
List of Figures xiii
List of Abbreviations xix
Chapter 1: Introduction 1
1.1 Background 1
1.2 Motivations 3
1.3 Objective and Research Questions 5
1.3.1 Research Question 1 6
1.3.2 Research Question 2 6
1.3.3 Research Question 3 7
1.4 Thesis Outline 7
Chapter 2: Literature Review 10
2.1 Extended Producer Responsibility – A Driving Factor for
Product End-of-Life Planning 10
2.1.1 EPR in Europe 10
2.1.2 EPR in North America 11
vi
2.1.3 EPR in Asia and Oceania 11
2.2 End-of-Life Options – The Enablers of Closed-Loop
Production 13
2.2.1 Reuse or Refurbishment 14
2.2.2 Remanufacturing 14
2.2.3 Recycling 15
2.2.4 Energy Recovery and Disposal 15
2.3 Sustainability Indicators – The Measure for Sustainable
Production 16
2.3.1 Environmental Indicators 17
2.3.2 Economic Indicators 19
2.3.3 Social Indicators 20
2.3.4 Composite Indicators 21
2.4 State-of-the-Art in Product End-of-Life Planning 22
2.4.1 Criteria for Product End-of-Life Planning 22
2.4.2 Evaluation of Existing Methods 27
2.4.3 Comparison of Evaluation Results 41
2.5 Research Gap in Product End-of-Life Planning 43
2.6 Summary 44
Chapter 3: Concept for Product End-of-Life Planning 46
3.1 Requirements of the Concept for Product End-of-Life
Planning 46
vii
3.2 Framework for Product End-of-Life Planning 49
3.3 Summary 53
Chapter 4: Development of Model for Product End-of-Life Planning 54
4.1 Capture of Product Structure Information 54
4.2 Identification of End-of-Life Options 56
4.3 Mapping of Integrated Life Cycle 60
4.4 Modelling of Integrated Life Cycle Performance 67
4.4.1 Development of Cost Model 71
4.4.2 Development of Carbon Footprint Model 79
4.5 Summary 83
Chapter 5: Simulation and Analysis for Product End-of-Life Planning 85
5.1 Simulation and Analysis of Integrated Life Cycle Performance 85
5.1.1 Computation of Eco-Efficiency 86
5.1.2 Stochastic Simulation and Analysis 88
5.2 Optimisation of Product End-of-Life Plan 91
5.2.1 Deterministic Optimisation 93
5.2.2 Stochastic Optimisation 102
5.3 Summary 107
Chapter 6: Implementation of System 109
6.1 Architecture of Software Tool 109
6.2 Prototype of Software Tool 110
viii
6.2.1 Data Layer 111
6.2.2 Logic Layer 113
6.2.3 Presentation Layer 116
6.3 Summary 118
Chapter 7: Case Studies 120
7.1 Turbocharger Case Study 120
7.1.1 Developing the Model for End-of-Life Planning of the
Turbocharger 121
7.1.2 Simulating and Analysing the Results for End-of-Life
Planning of the Turbocharger 130
7.2 Flat-Panel Display Monitor Case Study 145
7.2.1 Developing the Model for End-of-Life Planning of the
Flat-Panel Display Monitor 147
7.2.2 Simulating and Analysing the Results for End-of-Life
Planning of the Flat-Panel Display Monitor 153
7.3 Summary 165
Chapter 8: Conclusion 167
8.1 Summary of Work 167
8.2 Main Contributions of Work 170
8.3 Limitations and Recommendations for Future Work 171
References xvii
Appendix A: Raw Data for Case Studies xxxix
ix
Appendix B: Cumulative Distribution Function Plots of Monte Carlo
Simulation Results of Case Studies xliii
x
List of Tables
Table 2-1: An overview of the OECD sustainable manufacturing indicators. 18
Table 2-2: Criteria for product end-of-life planning. 23
Table 2-3: Evaluation scores for life cycle assessment. 29
Table 2-4: Evaluation scores for the process-based cost model by Kirchain et.
al. 31
Table 2-5: Evaluation scores for the stochastic dynamic programming by Krikke
et al. 33
Table 2-6: Evaluation score for the end-of-life design advisor and end-of-life
strategy environmental impact model by Rose et al. 35
Table 2-7: Evaluation score for the quotes for environmentally weighted
recyclability by Huisman. 37
Table 2-8: Evaluation scores of the multi-life cycle assessment and analysis by
Caudill et al. 39
Table 2-9: Evaluation scores for the life cycle simulation by Umeda et al. 41
Table 2-10: Summary of evaluation of research approaches based on the criteria
for product end-of-life planning. 42
Table 3-1: Conversion from criteria to requirements for product end-of-life
planning 49
Table 4-1: Product structure information captured from the bill of materials. 56
xi
Table 4-2: Product structure information with identified end-of-life options. 59
Table 5-1: Deterministic product end-of-life plans for optimising the production
system for economic performance, environmental performance and eco-
efficiency improvement. 101
Table 5-2: Optimality analysis of product end-of-life plan with respect to
changes in product recovery volume. 102
Table 5-3: Stochastic optimal product end-of-life plans for the conservative,
neutral or optimistic approaches to product end-of-life planning. 107
Table 7-1: Product structure information of the turbocharger captured with end-
of-life options identified in the Microsoft Excel model 123
Table 7-2: Keys parameters and assumptions for the turbocharger case study. 131
Table 7-3: Deterministic end-of-life plans for optimising the turbocharger
production system for economic performance, environmental performance and
eco-efficiency improvement. 133
Table 7-4: Optimality analysis of the eco-effieincy end-of-life plan for the
turbocharger with respect to changes in product recovery volume. 138
Table 7-5: Stochastic end-of-life plans for optimising the turbocharger
production system for eco-efficiency improvement. 143
Table 7-6: Product structure information of the flat-panel display monitor
captured with end-of-life options identified in the Microsoft Excel model 148
xii
Table 7-7: Keys parameters and assumptions for the flat-panel display monitor
case study. 154
Table 7-8: Deterministic end-of-life plans for optimising the flat-panel display
monitor production system for economic performance, environmental
performance and eco-efficiency improvement. 155
Table 7-9: Optimality analysis of the (eco-efficiency) end-of-life plan for the
flat-panel display monitor with respect to changes in the price of resale
monitors. 160
Table 7-10: Stochastic end-of-life plans for optimising the flat-panel display
monitor production system for eco-efficiency improvement 163
xiii
List of Figures
Figure 1-1: The role of product end-of-life planning in the design and
management of closed-loop production systems. 4
Figure 1-2: Outline of thesis. 8
Figure 2-1: Hierarchy of end-of-life options. 13
Figure 2-2: Remanufacturing as a superset of other end-of-life options. 14
Figure 2-3: The four phases in life cycle assessment. 28
Figure 2-4 : Mapping process information to technical cost details to build up
production cost. 30
Figure 2-5: Two-phase optimisation procedure for the stochastic dynamic
programming method 32
Figure 2-6: End-of-life design advisor method 34
Figure 2-7: Calculating quotes for environmentally weighted recyclability
scores 36
Figure 2-8: Screenshot of the multi-life cycle assessment and analysis
framework. 38
Figure 2-9: Architecture of life cycle simulation system 40
Figure 3-1: The process of specifying criteria from objective and conversion
into requirements for product end-of-life planning. 47
xiv
Figure 3-2: Framework for product end-of-life planning. 50
Figure 4-1: Scope of Section 4.1 – capture of product structure information. 55
Figure 4-2: Scope of Section 4.2 – identification of end-of-life options. 57
Figure 4-3: Flowchart for the capture of product structure information and
identification of end-of-life (EoL) options. 58
Figure 4-4: Scope of Section 4.3 – mapping of integrated life cycle. 60
Figure 4-5: Integrated life cycle map with the nested subtree of end-of-life
option E for Part 5 of the generic example. 63
Figure 4-6: Integrated life cycle map with the nested subtree of end-of-life
option F for Part 5 of the generic example. 64
Figure 4-7: Integrated life cycle submaps for parts 1 to 4 of the generic example. 65
Figure 4-8: Integrated life cycle submaps for parts 5 to 8 of the generic example. 66
Figure 4-9: Scope of Section 4.4 – modelling of integrated life cycle
performance. 67
Figure 4-10: Generic plot for the product order volume and recovery volume. 68
Figure 5-1: Scope of Section 5.1 – simulation and analysis of integrated life
cycle performance. 86
Figure 5-2: Illustration of the eco-efficiency improvement indicator used in the
dynamic programming optimisation of the product EoL plan. (a) Eco-efficiency
improvement of a system. (b) Eco-improvement of a subsystem. 88
xv
Figure 5-3: Generic example of uncertainty in product recovery volume. 89
Figure 5-4: Approximation of the sample size for Monte Carlo Simulation to
achieve near steady-state mean of integrated life cycle performance. 90
Figure 5-5: Generic example of the cumulative distribution function plot of the
Monte Carlo Simulation of the integrated life cycle performance under
uncertainty generated from the RiskSim add-in for Microsoft Excel. 90
Figure 5-6: Scope of Section 5.2 – product end-of-life planning 92
Figure 6-1: Software architecture of decision-support model for product end-of-
life planning. 110
Figure 6-2: Product structure information captured in the data layer of the Excel
tool. 111
Figure 6-3: Cost data stored in the data layer of the Excel tool. 112
Figure 6-4: Carbon emission data stored in the data layer of the Excel tool. 113
Figure 6-5: Data-logic interface programmed for the submodel of part 1 with
EoL option B in the Excel tool. 114
Figure 6-6: Integrated life cycle (cost and carbon footprint) model programmed
in the Excel tool. 115
Figure 6-7: Data table and cumulative distribution function plot of the Monte
Carlo Simulation for the stochastic optimisation of product end-of-life plans in
the Excel tool. 116
xvi
Figure 6-8: Data entry (user input) for integrated life cycle model in the Excel
tool. 117
Figure 6-9: Summary and visualisation of the deterministic product end-of-life
plans in the Excel tool. 117
Figure 6-10: Implementation of the optimality analysis in the Excel tool. 118
Figure 6-11: Summary and visualisation of the stochastic product end-of-life
plans in the Excel tool. 118
Figure 7-1: Parts and workings of a typical marine turbocharger. 121
Figure 7-2: Integrated life cycle map for the turbocharger case study (Part I of
II) 124
Figure 7-3: Integrated life cycle map for the turbocharger case study (Part II of
II) 125
Figure 7-4: Integrated life cycle submaps for the turbocharger case study (Part I
of V). 126
Figure 7-5: Integrated life cycle submaps for the turbocharger case study (Part II
of V). 127
Figure 7-6: Integrated life cycle submaps for the turbocharger case study (Part
III of V). 128
Figure 7-7: Integrated life cycle submaps for the turbocharger case study (Part
IV of V). 129
xvii
Figure 7-8: Integrated life cycle submaps for the turbocharger case study (Part
V of V). 130
Figure 7-9: Projections of the product order volume and recovery volume for
the turbocharger case study. 131
Figure 7-10: Sensitivity analysis of the eco-efficiency EoL plan for the
turbocharger. 137
Figure 7-11: Fluctuations of the turbocharger recovery volume. 140
Figure 7-12: Cumulative distribution function plot of the Monte Carlo
simulation of the NPV for the turbocharger EoL plan optimised for eco-
efficiency improvement based on the deterministic scenario. 141
Figure 7-13: Cumulative distribution function plot of the Monte Carlo
simulation results of the carbon footprint for the turbocharger EoL plan
optimised for eco-efficiency improvement based on the deterministic scenario. 141
Figure 7-14: Cumulative distribution function plot of the Monte Carlo
simulation of the NPV for the turbocharger EoL plans stochastically optimised
for eco-efficiency improvement. 142
Figure 7-15: Cumulative distribution function plot of the Monte Carlo
simulation of the carbon footprint for the turbocharger EoL plans stochastically
optimised for eco-efficiency improvement. 142
Figure 7-16: 21” Samsung FPD monitor used as the case study. 146
xviii
Figure 7-17: Integrated life cycle map for the flat-panel display monitor case
study. 149
Figure 7-18: Integrated life cycle submaps for the flat-panel display monitor
case study (Part I of III). 150
Figure 7-19: Integrated life cycle submaps for the flat-panel display monitor
case study (Part II of III). 151
Figure 7-20: Integrated life cycle submaps for the flat-panel display monitor
case study (Part III of III). 152
Figure 7-21: Projections of the product order volume and recovery volume for
the flat-panel display monitor case study 153
Figure 7-22: Sensitivity analysis of the eco-efficiency end-of-life plan for the
flat-panel display monitor. 159
Figure 7-23: Cumulative distribution function plot of the Monte Carlo
simulation of the NPV for the FPD monitor EoL plan optimised for eco-
efficiency improvement based on the deterministic scenario. 162
xix
List of Abbreviations
AW
-
Annual Worth
BOM
-
Bill of Materials
CART
-
Classification and Regression Tree
CDF
-
Cumulative Distribution Function
DBOM
-
Disassembly Bill of Materials
DP
-
Dynamic Programming
ELDA
-
End-of-Life Design Advisor
ELSEIM
-
End-of-Life Strategy Environmental Impact Model
ELV
-
End-of-Life Vehicles
EoL
-
End-of-Life
EPR
-
Extended Producer Responsibility
ERR
-
External Rate of Return
FPD
-
Flat-Panel Display
FW
-
Future Worth
GHG
-
Greenhouse Gas
GWP
-
Global Warming Potential
IRR
-
Internal Rate of Return
ISO
-
International Organization for Standardization
LCA
-
Life Cycle Assessment
LCC
-
Life Cycle Costing
xx
LCS
-
Life Cycle Simulation
MARR
-
Minimum Acceptable Rate of Return
MCDM
-
Multi-Criteria Decision Making
MLCA
-
Multi-Life Cycle Assessment and Analysis
MP
-
Mainstream Production
NGO
-
Non-Governmental Organisation
NPV
-
Net Present Value
OECD
-
Organisation for Economic Co-operation and Development
P10
-
10
th
Percentile; the value below which 10% of the simulated random
results fall in
P90
-
90
th
Percentile; the value below which 90% of the simulated random
results fall in
PBCM
-
Process-Based Cost Model
PW
-
Present Worth
QWERTY
-
Quotes for Environmentally Weighted Recyclability
RoHS
-
Restriction of the use of certain Hazardous Substances
UNEP
-
United Nations Environmental Programme
WBCSD
-
World Business Council for Sustainable Development
WEEE
-
Directive on Waste Electrical and Electronic Equipment
1
Chapter 1: Introduction
In recent years, closed-loop production has been garnering interest in the
industry and academia as the strategy towards achieving sustainable production. Like
in any other strategy, planning is critical in the development and implementation of an
effective closed-loop production system. One major and important aspect of the
planning, which is the focus of this thesis, is product end-of-life (EoL) planning to
determine the optimal configuration of EoL options for a product to effect closed-loop
production. In order to fully appreciate and understand the context of and the work
done in this thesis, this chapter presents the background and motivations behind the
work. From there, the objective leading to the research questions to frame the scope of
this thesis is discussed. Finally, an outline of the thesis is provided to give a
breakdown of the work done in this thesis.
1.1 Background
Climate change, natural resource depletion, overconsumption and waste
generation are some of the most pressing global environmental issues today. Effects
of climate change that scientists have predicted in the past, such as accelerated rise in
sea levels, longer period of droughts in certain regions and more intense tropical
storms, are already occurring [1]. Natural resources, according to the Inclusive Wealth
Report released at the United Nations Conference on Sustainable Development in Rio
de Janeiro in 2012, have depleted by 33% in South Africa, 25% in Brazil, 20% in the
United States, and 17% in China [2]. Studies on the effects of overconsumption have
shown that if everyone in the world consumes like a typical American, it will take
three more planet Earth to provide the resources to sustain them [3]. In a 2012 report
released by the World Bank on solid waste management, waste generation per capita
Chapter 1: Introduction
2
globally has risen by more than 87% in ten years [4]. On top of that, the organic
fraction of solid wastes in landfills is estimated to contribute about 5% of the total
greenhouse gas (GHG) emissions known to be responsible for climate change [5].
In light of these issues, there is a growing emphasis for environmental
sustainability. Efforts to promote and encourage environmental sustainability have
come in different forms and from different parties around the world. From enactment
of legislations and policies to public pressure and initiatives, governments, non-profit
organisations (NGOs) and even the community at large are playing a huge role in
these efforts. In Europe, product take-back legislations and the extended producer
responsibility (EPR) laws such as the Directive on Waste in Electrical and Electronic
Equipment (WEEE) and Directive on End-of-Life Vehicles (ELV) have been enacted
[6-8]. Japan is leading the way in Asia by setting up various EPR laws [9-13]. Over in
the U.S., EPR laws making e-waste recycling mandatory have been passed in 25
states with several more working on passing new laws or improving existing ones [14,
15]. Believed to be the most effective method, international non-profit organisations
like Greenpeace [16] and the United Nations Environmental Programme (UNEP) [17]
are pushing for more environmental related legislation and standards to drive global
sustainability.
Faced with these challenges of public pressure, legislative compliance and
expectations of various stakeholders, manufacturers have begun to embrace
sustainable production (manufacturing) to seek the goal of the triple bottom line:
social integrity, environmental responsibility and profitability [18, 19]. According to
the U.S. Department of Commerce, the aim of sustainable production is to produce
products through economically-sound processes that minimise negative
Decision-Support Model for Product End-of-Life Planning
3
environmental impacts while conserving energy and natural resources [20]. A strategy
which has been mulled as the solution for achieving sustainable production is closed-
loop production [21, 22].
Putting into the context of this thesis, a closed-loop production system can be
defined using the criteria for closed-loop supply chain as outlined by Asif, et al. [23]:
The EoL product or core is collected by the manufacturer or a third-party
remanufacturer who acts as the supplier to the manufacturer.
The EoL product or core is reutilised (either as a whole or in parts) in the
mainstream production (MP) as forward material flow.
The product manufactured (or remanufactured) from the reutilisation of the EoL
product or core is sold in the same way as the new one, i.e. there are no
differentiation in product variant or market segmentation, and the order and
supply is not handled separately.
1.2 Motivations
The field of ecology defines a closed-loop system as a system that does not rely
on exchanging matter with any part outside the system – i.e. a system that is self-
sustainable. Although a production system may not be truly closed-loop, this concept
nevertheless, serves as an ideal to inspire manufacturers towards sustainable
production [24]. Studies have shown the viability of closed-loop production systems
in improving the competitive advantage of manufacturing companies and its adoption
is expected to increase in the future [25-29]. Some examples of prominent companies
which have adopted closed-loop production are Xerox, IBM, Caterpillar and BMW
[30].
Chapter 1: Introduction
4
In closed-loop production systems, EoL products are mostly reutilised in their
partial forms (i.e. modules, components and/or materials) in the mainstream
production (MP) phase [31]. In other words, in a closed-loop production system,
resource loops may be closed at different parts of the system in the end-of-life (EoL)
phase through EoL options that ‘close the loop” such as the reuse or remanufacture of
modules and components, or the recycling of materials. However, closing the loop
does not guarantee the most efficient production system [32]. Therefore, system
engineers and managers must understand and plan where (which parts of the product),
how (which EoL options to select), and when (under what conditions) to close the
loop in the production system. This is why product EoL planning plays such an
important role in the design and management of closed-loop production systems.
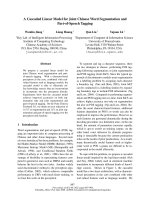
Figure 1-1 is an illustration of the role product EoL planning plays in the design and
management of a closed-loop production system.
Figure 1-1: The role of product end-of-life planning in the design and management of closed-loop
production systems.