Laser chemical processing (LCP) of poly silicon thin film
Bạn đang xem bản rút gọn của tài liệu. Xem và tải ngay bản đầy đủ của tài liệu tại đây (9.37 MB, 231 trang )
LASER CHEMICAL PROCESSING (LCP)
OF POLY-SILICON THIN FILM
SELVEN VIRASAWMY
NATIONAL UNIVERSITY OF SINGAPORE
2014
LASER CHEMICAL PROCESSING (LCP)
OF POLY-SILICON THIN FILM
SELVEN VIRASAWMY
(B. Eng. M. Eng, NUS)
A THESIS SUBMITTED
FOR THE DEGREE OF DOCTOR OF PHILOSOPHY
DEPARTMENT OF MECHANICAL ENGINEERING
NATIONAL UNIVERSITY OF SINGAPORE
2014
DECLARATION PAGE
DECLARATION
I hereby declare that this thesis is my original work and it has been written by me in
its entirety.
I have duly acknowledged all the sources of information which have been used in the
thesis.
This thesis has also not been submitted for any degree in any university previously.
____________
SIGNATURE
12
th
May 2015
Acknowledgements
i
Acknowledgements
It is without doubt that this has been a long, exhausting albeit a rewarding journey.
There are many to thank for this inspiring journey including my unlucky stars for
laying down the challenges on this rocky road. First and foremost, I would like to
thank Prof. Armin Aberle for giving me this exciting opportunity to learn about solar.
I also thank Prof. Andrew Tay for his guidance throughout the PhD programme and
for reviewing my thesis.
I also thank my co-supervisors, Dr Per Widenborg and Dr Natalie Mueller.
Thank you Per for sharing the knowledge about poly-Si thin film processing and
giving me the insights about poly-Si solar cells. I am indebted to Natalie for her
guidance in the laser processing, for the fun discussions and the encouragement
during the hard times. I also thank Dr Bram Hoex for his guidance and for making
time for discussions despite his busy schedule.
Of course, I have not forgotten the members of the poly-Si thin film group.
Special thanks go to Avishek Kumar, for his assistance in the post-fire
characterisation experiments. Also Cangming Ke for her help in the PC1D
simulations and the fruitful discussions about poly-Si solar cells. Then comes the rest
of the group members; Huang Ying, Felix Law and Hidayat for their insight about
other aspects of solar cell fabrication.
Then the unsung heroes who have shared their friendship and wisdom with me
in one way or the other. Thanks to Martin Heinrich for his help in some post-fire LCP
experiments.
I also extend my gratitude towards the people who have helped me in the post-
fire days. They gave me a glimmer of hope during those rainy days and encouraged
Acknowledgements
ii
me to pursue my quest even further. I am very grateful to Ms Li Yuan, Mr Lawrence
Chia and Mr Xiande Ding from Bruker Scientific for the access to Raman
spectroscopy equipment. My acknowledgments extend to Australia and I am very
indebted to the people from Australian National University (ANU) in particular Evan
Franklin and Nandor. Our collaboration may not have worked out but I am thankful
for the significant effort and good will that you have put in during the times when I
needed it the most.
I also would like to thank all my friends for their support. The beer sessions
freed my mind and rightfully provided the answer to my research and career paths.
The cycling friends offered a healthier outlet on the bike. Speed bursts along coastal
coupled with prata rides helped with mental strength, endurance and provided food
for thought.
These acknowledgments would definitely not be complete without the love
and support from my wife, Sharon Oh. She has been a pillar throughout my PhD years
and I would most likely have given up without her constant encouragement. She also
signed me up for the endurance events which taught me a whole lot about getting
through my PhD. I thank her for bearing with me during my PhD days.
Last, but not least, I would like to thank my parents and my brother for their
support, encouragement and their everlasting belief in me. This thesis is dedicated to
them.
Table of Contents
iii
Table of Contents
Abstract………………………………………………………………
vii
List of Publications………………………………………………………………
ix
List of Figures………………………………………………………………… ….
x
List of Tables……………………………………………………………………….
xvii
Nomenclature……………………………………………………………………….
xix
Chapter
1
Introduction
1.1
Thin film solar cells ……………………………………………
1
1.2
Doping of poly-silicon thin films………………………………
5
1.3
Application of Nd:YAG laser – a literature review ……………
7
1.4
Laser Chemical Processing (LCP)……………
10
1.5
Motivation ….……………………………………………………
12
1.6
Aim of the current work …………………………………………
13
1.7
Organization of thesis …………………………………………
15
References………………………………………………………
18
Chapter
2
Laser Chemical Processing (LCP)
2.1
Introduction……………………………………………………
21
2.2
Laser chemical processing………………………………………
21
2.3
Optics………………………………………………
23
2.4
Thermodynamics processes during LCP ………………………
27
2.5
Fluid dynamics ………………………………………………
35
2.6
Laser-material parameters used in the current work
37
2.7
Conclusion
39
References
41
Table of Contents
iv
Chapter
3
Experimental and Characterisation methods
3.1
Introduction
42
3.2
Poly-Si thin film on glass PV technology
42
3.3
Poly-Si thin film solar cell fabrication process…………………
49
3.4
Characterisation methods………………………………………
53
3.4.1
Electrical characterisation………………………………
53
3.4.1.1
Four point probe……………………………….
51
3.4.1.2
Electrochemical Capacitance-Voltage (ECV)
55
3.4.1.3
Quasi-steady state open-circuit voltage (Suns-
V
oc
)……………………………………………
58
3.4.2
Crystal characterisation…………………………………
64
3.4.2.1
Ultra-violet (UV) reflectance …………………
64
3.4.2.2
Raman spectroscopy ………………………….
65
3.4.2.3
Electron backscattered diffraction (EBSD)…
66
References………………………………………………………
68
Chapter
4
Laser Chemical Processing of p-type poly-silicon thin film on
glass
4.1
Introduction………………………………………………………
71
4.2
Experimental details……………………………………………
72
4.3
Results and Discussion…………………………………………
80
4.3.1
Sheet resistance measurements…………………………
80
4.3.2
Doping profiles (ECV and SIMS)………………………
86
4.4
Simulations of melt depth and melt lifetime …………………….
95
4.5
Sheet resistance modeling………………………………………
99
4.6
Optical characterisation…………………………………………
102
4.7
Conclusion………………………………………………………
105
References………………………………………………………
107
Table of Contents
v
Chapter
5
Laser Chemical Processing of p
-
/p
+
poly-silicon thin film on
glass
5.1
Introduction………………………………………………………
108
5.2
Experimental details……………………………………………
109
5.3
Results and Discussion…………………………………………
112
5.3.1
Sheet resistance measurements…………………………
112
5.3.2
Electrochemical Capacitance-Voltage (ECV)
measurements…………………………………………….
113
5.3.3
Suns-V
oc
measurements …………………………………
117
5.4
Hydrogenation …………………………………………
119
5.4.1
Sheet resistance measurements after hydrogenation …….
120
5.4.2
ECV profiling after hydrogenation ………………………
121
5.4.3
Suns-V
oc
measurements after hydrogenation……………
126
5.4.4
Superstrate and substrate measurements…………………
131
5.5
Modeling of silicon solar cells using PC1D……………………
138
5.6
Conclusion………………………………………………………
142
References………………………………………………………
144
Chapter
6
Structural properties of LCP-doped poly-Si thin film on glass
6.1
Introduction………………………………………………………
146
6.2
Structural defects in poly-silicon films………………
147
6.3
Study of structural properties using ultra-violet reflectance and
transmission electron microscopy (TEM) ……………………….
149
6.3.1
Experimental procedure……………………………
149
6.4
Characterization of structural properties using Raman
spectroscopy……………………………………………………
153
6.4.1
Experimental details……………………………
154
6.4.2
Results and Discussion…………………………
156
6.5
Study of structural disorder in LCP-doped samples…………
166
6.6
Electron backscattered diffraction (EBSD)………………………
169
Table of Contents
vi
6.7
Conclusion………………………………………………………
172
References………………………………………………………
174
Chapter
7
Electrically-active defects in LCP-doped poly-Si thin film on
glass
7.1
Introduction………………………………………………………
176
7.2
Effective ideality factor of hydrogenated LCP-doped samples …
176
7.3
Effective ideality factor of hydrogenated LCP-doped samples …
176
7.4
Investigation of the structural properties of LCP-doped solar
cells…………………
182
7.4.1
Experimental procedure……………………………
182
7.4.2
Results and Discussion…………………………
183
7.5
Investigation of electrically-active defects in LCP-doped poly-
silicon thin film solar cells………………………………………
184
7.5.1
Experimental procedure……………………………
185
7.5.2
Results and Discussion…………………………
185
7.6
Laser-induced defects in poly-silicon films… …………………
188
7.7
Impurity concentration in LCP-doped films……………………
192
7.8
Conclusion………………………………………………………
196
References………………………………………………………
198
Chapter
8
Summary, Conclusions and Future Work
8.1
Summary………………………………………………………….
200
8.2
Conclusion………………………………………………………
206
8.3
Future work……………………………………………………….
208
Abstract
vii
Abstract
Laser chemical processing (LCP), developed by Fraunhofer Institute for Solar Energy
Systems was successfully applied in fabricating n-type selective emitters and p-type
local back surface fields for bulk crystalline silicon wafer solar cells. In this thesis,
LCP is demonstrated as a straightforward technique for laser doping of poly-silicon
(poly-Si) thin films, thereby overcoming the process complexity related to laser
doping on thin films as well as supplying a practically infinite amount of dopants
during the doping process. Using a frequency-doubled (532 nm) tunable nanosecond
Nd:YAG laser coupled inside a phosphoric acid jet, LCP was successfully applied in
fabricating an n-type active layer for poly-silicon thin film solar cells on glass.
Different LCP parameters such as pulse energy, pulse overlap and pulse length
were investigated for n-type doping of boron-doped poly-Si films. The sheet
resistances (R
sh
) and active dopant concentration were assessed by four-point-probe
and electrochemical capacitance-voltage (ECV) profiling. The peak doping
concentrations and doping depth were influenced by the melt lifetime and number of
melt cycles per unit area, which were dependent upon the LCP conditions. Below the
ablation threshold, a longer melt lifetime increases impurity diffusion inside the
poly-Si until the liquid jet dominates the melt flow above a characteristic melt
expulsion time.
Dopant activation was performed by post-LCP annealing in a nitrogen-purged
oven using different temperatures and durations or by a rapid thermal process (RTP)
at 1000 °C for 1 min. The best structural quality and lowest R
sh
were obtained under
RTP conditions. LCP was then applied to fabricate an n-type emitter on a
p
-
/p
+
poly-Si thin film layer structure on glass. After dopant activation, the sheet
resistances were about 2-5 kΩ/□ and the active dopant concentration was about
Abstract
viii
8 x 10
18
cm
-3
to 1 x 10
19
cm
-3
at a doping depth of less than 350 nm (as measured by
ECV). Selected samples were then passivated by hydrogenation in a low pressure
chemical vapor deposition tool with an inductively-coupled remote plasma source.
The R
sh
was further reduced due to improved carrier mobility from passivation of
defects. Furthermore, the device performance was evaluated by quasi-steady-state
open-circuit voltage (Suns-V
oc
) measurements before and after hydrogenation. A
major improvement in open-circuit voltage (V
oc
)
(> 400 mV) and pseudo-fill factor
(pFF) (> 65%) was realized through hydrogenation whereby the best cell had an
average V
oc
of (446 ± 7) mV and a pFF of (68.3 ± 0.9)%. It was found that the post-
LCP anneal was the limiting factor for better device performance.
A detailed investigation of the electrically-active defects also indicated that the
V
oc
and pFF of the fabricated cells were limited by intra-grain defects generated from
excessive hydrogenation as well as recombination within the space-charge region. It is
expected that device performance can be improved by a rapid thermal processing step
(e.g. 1000 °C for 1 min) after LCP and by using optimized hydrogenation conditions.
Overall, this research has shown that LCP is practical for doping poly-Si thin films
and is further amenable towards other thin film technologies.
List of Publications
ix
List of Publications
1. S. Virasawmy, N. Palina, S. Chakraborty, P.I. Widenborg, B. Hoex and A.G.
Aberle, “Laser Chemical Processing (LCP) of Poly-Silicon Thin Film on Glass
Substrates”, Energy Procedia, vol. 33, pp. 137-142, 2013.
2. S. Virasawmy, N. Palina, P.I. Widenborg, A. Kumar, G.K. Dalapati, H.R. Tan,
A.A.O. Tay and B. Hoex, "Direct Laser Doping of Poly-Silicon Thin Films Via
Laser Chemical Processing," IEEE J. Photovoltaics, vol.3, pp.1259-1264, 2013.
3. S. Virasawmy, P.I. Widenborg, N. Palina, C. Ke, J. Wong, S. Varlamov, A.A.O.
Tay and B. Hoex, “Laser Chemical Processing of n-type Emitters for Solid Phase
Crystallised Poly-silicon Thin Film Solar Cells”, IEEE J. Photovoltaics, vol. 4,
pp. 1445-1451, 2014.
4. S. Virasawmy, N. Palina, P.I. Widenborg, A.A.O. Tay and B. Hoex,
“Investigation of the structural properties of poly-silicon thin films doped by
Laser Chemical Processing (LCP)”, in preparation.
5. S. Chakraborty, C. Ke, S. Virasawmy, A. Kumar, P.I. Widenborg and A.G.
Aberle, “Investigation of isotropic plasma etching processes for interdigitated
metallisation of poly-Si thin film solar cells”, submitted to Semiconductor Science
and Technology, 2014.
List of Figures
x
List of Figures
1.1
A schematic of a metallised poly-silicon thin film solar cell on
planar glass in superstrate configuration [i.e. light enters the solar
cell through the supporting structure].
4
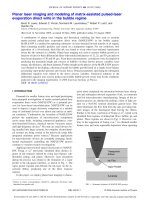
1.2
Laser/jet coupling inside one of the Synova Microjet-Minihead
©
11
3.1
Schematic of cell structure using the high temperature approach
[15].
46
3.2
A schematic of a metallised poly-silicon thin film solar cell on
planar glass using the intermediate temperature approach
47
3.3
(a) Schematic representation of the layer structure of a CSG Solar
poly-Si thin film solar cell on glass technology (b) CSG Solar
metallisation scheme using their proprietary inkjet technology to
open contact vias [10].
49
3.4
A textured solar cell illustrating the inter-digitated metallisation
scheme developed at UNSW. The emitter fingers are the thin light
grey lines contacting the n
+
emitter layer (glass side of the solar cell)
while the air side fingers are in contact with the p
+
back surface field
(BSF).
52
3.5
Process details for fabrication of poly-Si thin film solar cells on
planar glass substrates at SERIS.
52
3.6
Schematic of the ECV measurement technique (not drawn to scale).
57
3.7
Illumination (from the Xenon lamp) against time and the measured
open-circuit voltage during a Suns-V
oc
measurement [27]
60
3.8
Illumination (from the Xenon lamp) against measured open-circuit
voltage (V
oc
) [on the left the scale is a logarithmic plot] and
illumination against the measured open-circuit voltage [on the right
the scale is a linear plot].
60
3.9
An example of the 1-Sun pseudo-IV curve extracted from the Suns-
V
oc
data
61
3.10
Customized thin film Suns-V
oc
tester for measuring poly-Si solar
cells. The glass stage holds the reference sample, the device under
test and a thermocouple for temperature measurements.
64
List of Figures
xi
4.1
Sample preparation before LCP doping
72
4.2
Screenshot of the parameter input window
74
4.3
LCP equipment and its process control
75
4.4
A schematic of the sample structure during LCP
77
4.5
Process steps for each batch of samples after LCP processing. All
samples were subjected to a 10% HF dip to remove any oxide layer
prior to sheet resistance measurements.
78
4.6
Sheet resistance of LCP samples processed using a 20 ns pulse
length and LCP parameters from Table 4.1. The samples were
annealed as described in Figure 4.4. Samples processed with 90%
pulse overlap yielded lower sheet resistances due to increased
dopant diffusion. Batches B1 and B2 showed almost similar sheet
resistances. The error bars reflect the standard deviation in the sheet
resistance measurements.
81
4.7
Sheet resistance of LCP samples processed using a 60 ns laser pulse
length and LCP parameters from Table 4.1. The samples were
annealed as described in Figure 4.4. For LCP at lower fluence, the
sheet resistance decreased upon annealing for longer durations or
annealing at a higher temperature (refer to B5 and B6). Samples
processed with 90% pulse overlap yield lower sheet resistances due
to enhanced dopant diffusion. The error bars represent the standard
deviation in the sheet resistance measurements.
83
4.8
Measured sheet resistance of two LCP samples (E3 and S4
processed using 20 ns and 60 ns laser pulse length respectively) as a
function of annealing temperature during an isochronal anneal. All
samples were annealed for 30 min and were subjected to the same
heating and cooling rate.
84
4.9
Active dopant concentration of poly-Si samples oven-annealed at
610 °C for 30 min and RTP-annealed at 1000 °C for 1 min after
LCP. The doping depth of the samples processed with 90% pulse
overlap was deeper due to a higher number of melt cycles per unit
area. Higher pulse energies lead to a deeper doping depth due to
longer melt lifetime and molten volume. The doping profiles of the
87
List of Figures
xii
RTP-annealed samples were closely matched to the corresponding
oven-annealed samples.
4.10
Active dopant profiles (as determined by ECV) of two selected LCP
samples (E5 and S3). The doping profiles of each LCP sample were
quite similar despite being annealed under different conditions.
89
4.11
Measured SIMS profiles of phosphorus (P) and boron (B) for
sample E5 from Table 4.1 for: (a) an as-doped sample (b) a sample
processed at 1000 °C for 1 min (RTP). The junction depth was
measured to be about 260 nm for the as-doped and 300 nm for the
RTP sample respectively. Within the LCP-processed area (the first
350 nm of the film), the as-doped and RTP profile are relatively
similar. The ECV data of sample E5 subjected to RTP (see open
blue triangles) is included for comparison in Figure 4.11(b).
90
4.12
(a) Measured active phosphorus doping concentration of poly-Si
samples that were oven-annealed at 610 °C for 30 min in a nitrogen-
purged oven. The LCP conditions are listed in Table 4.2 (b)
measured SIMS profiles of phosphorus (P) for as-doped samples D2
and D3 from Table 4.2. The ECV profile of sample D2 is included
for comparison purposes.
93
4.13
Influence of the laser fluence over the melt depth and melt lifetime
for (a) a 20 ns pulse length (b) a 60 ns pulse length. The simulations
were carried out using a square-shaped pulse.
97
4.14
Influence of the laser fluence and pulse length over the melt depth
and melt lifetime. The solid, dashed and dotted blue curves show the
effect of the pulse length over the melt depth at the same laser
fluence. The simulations were carried out using a square-shaped
pulse.
98
4.15
Calculated and measured sheet resistances of LCP-doped samples
annealed in a nitrogen-purged oven at 610 °C for 30 min (refer to
Figure 4.8).
101
4.16
(a)-(j) SEM micrographs of as-doped samples at a magnification of
550X. The scale bar is 10 µm. The inset in the pictures illustrates a
magnified view of the LCP-doped region at 2500X. Figure 4.16(e)
104
List of Figures
xiii
and (h) show the LCP-doped and undoped region (distinguished by
the dashed white line) for a 20 ns pulse length and 60 ns pulse
length.
5.1
Schematic of the sample structure used in LCP doping (not drawn to
scale)
109
5.2
(a) Active dopant profiles throughout the cell structure. The
background p-type (red symbols) dopant concentration was about
2 x 10
17
cm
-3
and the peak phosphorus (blue symbols) doping
concentration was ~10
19
cm
-3
(b) Influence of pulse energy/overlap
ratio over the doping depth. (c) Influence of pulse length over the
doping depth (d) Influence of repetition rate and pulse overlap over
the doping depth.
116
5.3
Average V
oc
of the oven-annealed samples in superstrate
configuration. The error bars represent the standard deviation in the
V
oc
measurements.
119
5.4
ECV profiles after annealing under different conditions (i.e. “LCP +
anneal”) (b) ECV profiles after the hydrogenation step (i.e. “LCP +
anneal + hydrogenation”).
123
5.5
Example of dopant smearing effect encountered in our non-
metallised poly-Si thin film solar cells on planar glass (i.e. non-
textured glass) after RTP and a hydrogenation step carried out at ~
480 °C for about 15 min (from Ref. [13]).
125
5.6
(a) Average V
oc
(b) average pFF after a hydrogenation process
performed at 600 ºC for 30 min in a LPCVD tool with an
inductively coupled plasma. The measurement uncertainty reflects
the standard deviation in the measurements. The best V
oc
(> 400
mV) and pFF (> 65%) were achieved for the samples that were
annealed at 700 ºC for 30 min prior to the hydrogenation process.
127
5.7
Average measured V
oc
of non-metallised poly-Si thin film solar cells
on glass fabricated by the process described in Chapter 3. The
sample structure is glass/70 nm SiN
x
/100 nm n
+
Si (emitter layer)/2
μm p
−
Si (absorber layer)/100 nm p
+
layer (BSF layer) [13].
128
5.8
Schematic illustration (not to scale) of carrier generation and
131
List of Figures
xiv
subsequent separation by the p-n junction for (a) a LCP-doped solar
cell (in this work) (b) a conventional poly-Si thin film solar cell on
glass superstrate. The n-type carriers are represented by the red
spheres while the p-type carriers are denoted by the green spheres.
5.9
Customized chuck used for the Suns-V
oc
measurements in substrate
and superstrate configuration.
133
5.10
Average V
oc
of the oven-annealed non-hydrogenated samples
measured in superstrate and substrate configuration. The error bars
represent the standard deviation in the V
oc
measurements.
134
5.11
Average measured (a) V
oc
(b) pFF of the oven-annealed
hydrogenated samples in superstrate and substrate configuration.
The error bars reflect the standard deviation in the measurements.
137
6.1
UV reflectance curves of two LCP samples processed using two
different pulse energies and annealed under different conditions –
(a) Y5, processed below the ablation threshold. The inset in Figure
6.1(a) is a magnified view between 360-370 nm. (b) Y1, processed
close to the ablation threshold. The as-doped curve (dashed blue
line) of Y1 is located further away from the undoped poly-silicon
(dashed black line) due to an increased defect density in the sample.
150
6.2
(a) XTEM of an as-doped sample (S5 from Table 6.1) showing the
LCP-doped and undoped area (b) SAD pattern gathered at the
surface of S5 (as-doped) showing the crystallinity of the LCP-doped
region (c) Corresponding LCP sample (S5) annealed at 610 °C for
30 min illustrating the LCP-doped and undoped area (d) SAD
pattern at the surface of S5 (annealed at 610°C for 30 min)
illustrating the crystallinity of the LCP-doped area.
152
6.3
Influence of the annealing conditions on FWHM and TO peak of
two bare (i.e. non-LCP doped) poly-Si samples. The error bars
reflect the standard deviation in the measurements. It is observed
that annealing at higher temperature (e.g. RTP at 1000 °C for 1 min)
lead to better structural quality (i.e. lower FWHM) and lower tensile
stress (i.e. Raman peak is less shifted and is closer to ~521 cm
-1
).
The lines are guides to the eye.
157
List of Figures
xv
6.4
Influence of laser fluence on (a) FWHM and (b) TO peak of as-
doped samples processed with 80% and 90% pulse overlap. The
samples were processed with a pulse length of 20 ns, a square-
shaped pulse and a repetition rate of 100 kHz. The error bars reflect
the standard deviation in the measurements.
158
6.5
Influence of laser fluence on (a) FWHM and (b) TO peak of as-
doped samples processed with 80% and 90% pulse overlap. The
samples were processed with a pulse length of 60 ns, a square-
shaped pulse and a repetition rate of 100 kHz. The error bars reflect
the standard deviation in the measurements.
162
6.6
Influence of thermal anneal on (a) TO peak and (b) FWHM of a
LCP-doped sample processed with a laser fluence of 1.5 J/cm
2
, 80%
pulse overlap and 20 ns pulse length (c) TO peak and (d) FWHM of
a LCP-doped sample processed with a laser fluence of 2.5 J/cm
2
,
90% pulse overlap and 60 ns pulse length. The error bars represent
the standard deviation in the measurements. The lines are guides to
the eye.
165
6.7
Influence of post-LCP annealing conditions on the structure disorder
degree of selected samples processed using a (a) 20 ns pulse length
(b) 60 ns pulse length. The LCP conditions are listed in Table 6.1.
The error bars reflect the standard deviation in the measurements.
The lines are guides to the eye.
167
7.1
(a) Extracted n
eff
(b) average V
oc
of the samples after a hydrogenation
process at 600 ºC for 30 min in a LPCVD tool with an inductively-
coupled remote plasma. The measurement uncertainty reflects the
standard deviation in the measurements.The best V
oc
(> 400 mV) and
pFF (> 65%) were achieved for the samples that were annealed at
700 ºC for 30 min prior to the hydrogenation process.
178
7.2
Effective ideality factor of the hydrogenated and non-hydrogenated
solar cells after LCP. The effective ideality factor of the non-
hydrogenated as-doped samples was not included because the
dopants were not activated.
180
7.3
Raman spectra of silicon-hydrogen bond for LCP-doped sample S1
187
List of Figures
xvi
after a hydrogenation process at 600 °C for 30 min in a LPCVD
reactor with an inductively-coupled remote plasma source. For
comparison purposes, the Raman spectrum acquired on a reference
poly-Si sample (Hyd. reference sample) hydrogenated at 450 °C for
15 min is also included.
7.4
Silicon-hydrogen Raman spectra of LCP-doped samples S1
annealed at 700 °C for 30 min and subsequently hydrogenated at
600 °C for 30 min in a LPCVD reactor with an inductively-coupled
remote plasma source.
188
7.5
Measured SIMS profiles of carbon and oxygen in (a) an as-doped
LCP sample and (b) a corresponding LCP sample subjected to RTP
at 1000 °C for 1 min. The oxygen level was ~8x10
20
cm
-3
and
~2x10
20
cm
-3
in the as-doped and annealed sample respectively. The
carbon content was ~5x10
18
cm
-3
and ~4x10
18
cm
-3
in the as-doped
and annealed sample respectively.
192
7.6
Measured SIMS profiles of carbon and oxygen in two as-doped LCP
samples processed with a fluence of 1.5 J/cm
2
and (a) a pulse
overlap of 94% and a pulse length of 60 ns (b) a pulse overlap of
96% and a pulse length of 80 ns.
194
List of Tables
xvii
List of Tables
2.1
Parameters used for the simulations in the current work
39
4.1
LCP parameters used for the experiments (pulse shape, repetion rate
and jet pressure were set to square-shaped, 100 kHz and 130 bar
respectively).
77
4.2
LCP parameters used for the LCP experiments (pulse shape and jet
pressure were set to square-shaped and 130 bar respectively).
79
4.3
Sheet resistance of LCP samples processed using LCP parameters
from Table 4.2. The samples were annealed at 610 °C for 30 min in a
nitrogen-purged oven. The error bars represent the standard deviation
in the sheet resistance measurements. A longer pulse length leads to
lower sheet resistances due to increased phosphorus diffusion.
86
5.1
LCP parameters used during LCP doping (pulse shape and jet
pressure were set to square- shaped and 130 bar respectively).
110
5.2
Sheet resistance measurements performed at several locations over
the LCP-doped samples. If applicable, the error bars reflect the
standard deviation in the measurements. All the samples were
annealed in a nitrogen-purged oven at different temperatures and
durations.
113
5.3
Average sheet resistances of the LCP-doped samples after
hydrogenation at 600 ºC for 30 min in a LPCVD tool with an
inductively coupled plasma source.
122
5.4
Measured Suns-V
oc
parameters from the batch “LCP +
hydrogenation”
129
5.5
Average V
oc
of the reference planar SPC sample measured in
superstrate and substrate configuration with a customized chuck. The
error bars reflect the standard deviation in the measurements.
133
5.6
Measured Suns-V
oc
parameters for the batch “LCP + hydrogenation”.
Measurements were performed in superstrate and substrate using the
customized jig.
136
5.7
Main parameters used in PC1D for a LCP-doped hydrogenated poly-
Si solar cell measured in superstrate.
139
List of Tables
xviii
5.8
Experimental and simulated V
oc
of the hydrogenated samples
measured in superstrate. The expected V
oc
values in the substrate
configuration were also calculated from the simulation model.
141
5.9
Expected V
oc
for the batch of poly-Si samples annealed at 610 °C for
30 min after hydrogenation. Simulations were carried out for a
superstrate configuration. The bulk lifetime was assumed to be 1.2
ns.
138
6.1
Parameters used for LCP. Unless otherwise mentioned, LCP
parameters were kept at a pressure of 130 bar, a pulse length of 20 ns,
a square-shaped pulse and a laser repetition rate of 100 kHz.
156
6.2
LCP parameters used in this work. LCP parameters were kept at a
pulse overlap of 80%, a repetition rate of 100 kHz and square-shaped
pulse.
162
6.3
Average measured grain sizes of two as-doped samples, sample Y3
processed with a 60 ns pulse length and sample S5 processed with 20
ns pulse length. Sample Y3 annealed at 610 °C for 30 min and
610 °C for 2 hours are also included to study the effect of the thermal
anneal on the grain size.
171
7.1
Measured and extracted Suns-V
oc
parameters from the batch “LCP +
hydrogenation”. The measurement uncertainty reflects the standard
deviation in the measurements.
181
7.2
Average TO peak and FWHM of the hydrogenated samples. The
error bars reflect the standard deviation in the measurements.
183
Nomenclature
xix
Nomenclature
a-Si - amorphous silicon
ABF - ammonium bi-fluoride
AIT - aluminium-induced texturing
BSF - back surface field
C-V - capacitance-voltage
CVD - chemical vapour deposition
EBSD - electron backscatter diffraction
ECV - electrochemical capacitance-voltage
HYD - hydrogenation
PECVD - plasma-enhanced chemical vapour deposition
Poly-Si - polycrystalline silicon
RTP - rapid thermal processing
SEM - scanning electron microscopy
SIMS - secondary ion mass spectroscopy
SPC - solid phase crystallisation
TEM – transmission electron microscopy
XTEM- cross-sectional transmission electron microscopy
INTRODUCTION
1
CHAPTER 1
INTRODUCTION
1.1 Thin film solar cells
Today’s commercially available bulk crystalline silicon wafer cells have solar cell
efficiencies in the range of 15% - 25%. At the forefront lies the notable SunPower
silicon solar cell - an all back-contact n-type silicon wafer solar cell with efficiency
~25% [1] followed by the Sanyo HIT cell featuring a thin mono-crystalline wafer
sandwiched between ultra-thin amorphous silicon layers, with a cell efficiency over
22% [1]. Despite these strong achievements, photovoltaic (PV) electricity is still far
behind other forms of green electricity such as hydroelectricity. The Renewable
Energy Policy Network for the 21
st
Century (REN21) 2013 reports that only ~19% of
our global energy consumption consists of renewable energy – out of which,
wind/solar/geothermal/biomass power generation altogether form a mere 1.1%.
Nevertheless, given these low numbers, the annual growth rate for PV is a staggering
42%, more so than any other forms of renewable technologies such as wind power
which is only about 19%. This is primarily due to economies of scale and constant
technological advancements that continuously drive down the price of PV
manufacturing [2].
The cost of modern-day PV module manufacturing is around US$ 0.5/Wp, and
there is still continuing effort to drive down the price by either decreasing production
cost or by increasing the efficiency of the solar cell. The cost of a silicon substrate
makes up ~50% of the overall fabrication cost [4]. One way to lower costs is to move
towards larger and thinner wafers to scale up production but at some stage the wafer
INTRODUCTION
2
breakage rate will limit the minimum achievable thickness [4]. Another consideration
is that the relative fraction of silicon loss due to sawing (kerf loss) increases as the
wafer gets thinner. Similarly, the fractional loss due to saw damage etch is likely to
increase. Thus, one possible way to decrease the dollar per watt and yet overcome
these issues is through thin film technology.
Thin film PV technology combines the advantages of using small amounts of
material with scalability. The thin film material is deposited by physical [4] or
chemical vapor deposition [3, 5] and by solution-based processing [6]. In addition,
batch scale manufacturing can be expanded towards larger and/or flexible substrates.
Leveraging off semiconductor technology, production time and cost can be decreased
significantly through monolithic integration and novel interconnection methods
involving laser scribing and inkjet printing.
To date, various thin film technologies have already found their way to the
market. For instance, First Solar is a leading industrial manufacturer of cadmium
telluride (CdTe) PV modules with average efficiency in the range of 12% - 13%.
Additionally, copper indium gallium selenide (CIGS) PV modules with efficiencies in
the range of 13% - 14% are already being commercialized [7]. Even though these
technologies seem promising, they rely heavily on scarce elements such as indium
and telluride and thus, may potentially limit their growth in the near future.
Additionally, cadmium is toxic and in this respect, CdTe PV is not quite symbolic for
‘green energy’. In contrast, silicon-based thin film PV technologies are non-toxic and
sustainable. Amorphous silicon (a-Si) solar cells have already been on the market for
years and can be found in calculators and watches, amongst others. Nevertheless, one
barrier to industrial production is the relatively low PV efficiency of amorphous
silicon. The latter technology also suffers from light-induced degradation (Staebler-
INTRODUCTION
3
Wronski effect) which decreases the efficiency by up to 30% of its initial value [8].
Thus, one effective way to exploit a-Si technology is to combine it with other silicon-
based material (e.g. micro-crystalline silicon) to form tandem solar cells. For
example, the team from Neuchatel, Switzerland demonstrated stable efficiencies
(~12%) with triple junction solar cells using this technology [9].
Another silicon-based technology is poly-silicon thin film. Poly-silicon (poly-
crystalline silicon or poly-Si) thin film is a common semiconductor material driving
numerous applications in the semiconductor industry (e.g. thin film transistor (TFT)
circuitry in active matrix liquid crystal display (AMLCD) [10]). Poly-Si can be
formed or deposited in multiple ways – for instance, by laser crystallisation of a-Si,
solid phase crystallisation of a-Si [11], physical vapor deposition methods such as e-
beam evaporation or chemical vapor deposition techniques as in low pressure
chemical vapor deposition (LPCVD) [12] or plasma-enhanced chemical vapor
deposition (PECVD) of poly-Si [4]. Depending upon the deposition conditions,
amorphous, poly- or micro-crystalline silicon may be formed for chemical vapor
deposition techniques such as PECVD. These three materials are typically classified
according to their grain size and range order. Amorphous silicon (a-Si) has no long
range order while poly-Si has relatively long range order and consists of grain sizes
varying between 1 and 1000 micrometers. In contrast, micro-crystalline silicon
consists of amorphous tissue and poly-Si altogether and is typically made up of grain
sizes less than 1 micrometer [4].
In the late 1980s, Sanyo Electric pioneered the first poly-Si solar cells made
by the solid phase crystallisation approach. Those were made on quartz substrates and
had solar cell efficiencies around 8.5% [13]. More details about this layer structure
will be described in Chapter 2. Despite these encouraging results, this type of solar