Mechanical characterization and modeling of polymerclay nanocomposites
Bạn đang xem bản rút gọn của tài liệu. Xem và tải ngay bản đầy đủ của tài liệu tại đây (4.63 MB, 157 trang )
MECHANICAL CHARACTERIZATION AND MODELING
OF POLYMER/CLAY NANOCOMPOSITES
SONG SHAONING
NATIONAL UNIVERSITY OF SINGAPORE
2014
MECHANICAL CHARACTERIZATION AND MODELING
OF POLYMER/CLAY NANOCOMPOSITES
SONG SHAONING
(B.ENG)
A THESIS SUBMITTED
FOR THE DEGREE OF DOCTOR OF PHILOSOPHY
DEPARTMENT OF MECHANICAL ENGINEERING
NATIONAL UNIVERSITY OF SINGAPORE
2014
Declaration
i
Declaration
I hereby declare that this thesis is my original work and it has been written by
me in its entirety. I have duly acknowledged all the sources of information
which have been used in the thesis.
This thesis has also not been submitted for any degree in any university
previously.
______________________________
Song Shaoning Date: 28/04/2014
Acknowledgement
ii
Acknowledgement
The author would like to express his sincere gratitude to all of the kind hearted
individuals for their precious advice, guidance, encouragement and support,
without which the successful completion of this thesis would not have been
possible.
Special thanks to the author’s supervisors A/Prof. Vincent Tan Beng Chye and
A/Prof. Quan Chenggen, whom the author has the utmost privilege and honor
to work with. Their profound knowledge on mechanics and strict attitude
towards academic research will benefit the author’s whole life.
The author would also like to thank Dr Chen Yu, Dr Su Zhoucheng, Dr Ren
Yunxia, Mr Joe Low Chee Wah, Dr Sun Xiushan, Dr Muhammad Ridha and
Dr Tan Longbin for their invaluable help. Many thanks to his friends Dr Andi
Haris, Dr Jiang Yong, Dr Chen Boyang, Dr Li Sixuan, and Mr Umeyr
Kureemun for making the research environment a lively place.
Last but not least, the author expresses his utmost love and gratitude to his
wife, Gao Yuan, for her understanding and support throughout his research.
Table of Contents
iii
Table of Contents
Declaration i
Acknowledgement ii
Table of Contents iii
Summary v
List of Tables viii
List of Figures ix
Nomenclature xiv
Chapter 1 1
Introduction and Literature Review 1
1.1 Introduction 1
1.2 Review of Studies on Mechanical Properties of PCNs 5
1.2.1 Experimental Work on PCNs 5
1.2.2 Analytical Studies of PCNs 9
1.2.3 Numerical Models of PCNs 15
1.3 Review of Studies on Fiber Reinforced Polymer/clay Nanocomposites
(FRPCNs) 24
1.4 Objectives and Significance of the Study 26
Chapter 2 31
Representative Volume Element (RVE) Model for Polymer/clay
Nanocomposites 31
2.1 Finite Element Clay Model and RVE Model 32
2.1.1 Finite Element Clay Model 32
2.1.2 RVE Model 34
2.2 Boundary Conditions 37
2.3 Dynamic Explicit Formulation 42
2.4 Summary 45
Chapter 3 47
Mechanical Characterization and Modeling of Epoxy/clay Nanocomposites . 47
3.1 Finite Element Clay Model for Epoxy/clay Nanocomposites 48
3.2 Traction-Separation Law 49
3.3 Brittle Cracking Criterion 53
3.4 Results and Discussion 55
3.4.1 RVE Size 57
3.4.2 Parametric Study 58
Table of Contents
iv
3.4.3 Damage Analysis 61
3.4.4 Effect of the Gallery Strength 64
3.4.5 Effect of Nano-clay/matrix Interphase 65
3.5 Conclusions 67
Chapter 4 69
Mechanical Characterization and Modeling of Nylon 6/clay Nanocomposites
69
4.1 Finite Element Clay Model for Nylon 6/clay Nanocomposites 70
4.2 Traction-Separation Law 71
4.3 Damage Models for Nylon 6 75
4.3.1 Progressive Ductile Damage Criterion for Nylon 6 77
4.3.2 GTN model 82
4.4 Results and Discussion 84
4.4.1 Parametric Study 85
4.4.2 Effect of Particle Size 85
4.4.3 Effect of Number of Silicate Layers 88
4.4.4 Damage Analysis 89
4.4.5 Effect of Interface Strength 91
4.4.6 Effect of Initial Stress Triaxiality on NCNs 93
4.5 Conclusions 96
Chapter 5 98
Mechanical Characterization of Fiber Reinforced Polymer/clay
Nanocomposites 98
5.1 Effective Clay Models 99
5.1.1 Quasi-Traction-Separation Law 101
5.1.2 Validation of Effective Clay Model 106
5.1.3 Damage Analysis 111
5.2 Mechanical Characterization of Fiber Reinforced Polymer/clay
Nanocomposites 115
5.2.1 Elastic Properties of FRECNs 119
5.2.2 Damage Analysis of FRECNs 120
5.3 Conclusions 123
Chapter 6 125
Conclusions and Recommendations 125
6.1 Conclusions 125
6.2 Recommendations for Future Work 130
References 132
Summary
v
Summary
Polymer/clay nanocomposites (PCNs) have drawn great attention both from
industry and academia due to their remarkable enhancement of mechanical,
thermal and barrier properties compared to traditional polymers. Although the
elastic properties of PCNs have been extensively studied and well documented,
their damage behavior has not yet been completely addressed. In this thesis,
the damage behavior of two typical PCNs systems, namely epoxy/clay
nanocomposites (ECNs) and nylon 6/clay nanocomposites (NCNs) were
characterized by a 3D representative volume element (RVE) model
implemented with a computational homogenization approach. Despite all the
advances in polymer nanocomposites, as discontinuous reinforcement,
nanoparticle filled polymer composites cannot achieve the strength and the
modulus comparable to that of the continuous fiber reinforced polymers
(FRPs). Fiber reinforced polymer/clay nanocomposites (FRPCNs) are
developed to harness both the advantages of the PCNs and FRPs. The damage
behavior of FRPCNs under transverse tensile loading was also studied to
highlight the application of PCNs.
For the PCNs systems, a 3D RVE model, which consists of the polymer
matrix, the clay platelets, the gallery layer and the interphase layer, was
developed to mimic the microstructure of actual PCNs. Different appropriate
damage criteria were used to describe the material behavior of these
constituents. The brittle cracking model was applied to epoxy, while
Summary
vi
deformation of nylon 6 was mimicked by the progressive ductile damage
(PDD) criterion or the Gurson-Tvergaard-Needleman (GTN) model. The
traction-separation law was used for the gallery layer and interphase layer.
Effects of parameters of constituents, such as structural parameters of the clay
particle, the strength of the interphase layer and the gallery layer, on the
constitutive relationship and the damage behavior of the PCNs were studied
by a computational homogenization approach implemented with explicit finite
element method (FEM). It was found that for both the ECNs model and the
NCNs model, the predicted constitutive relationship and fracture patterns are
close to the experimental data. Moreover, the clay particles with less number
of silicate layers or larger particle size could lead to an increase in elastic
stiffness and stress at engineering strain 0.1 for the NCNs model but a
decrease in tensile strength for the ECNs model. In addition, the damage
mechanisms of PCNs were found to be related to the strength of the gallery
layer and the interphase layer. A lower strength of the gallery layer or the
interphase layer could respectively cause damage to initiate as splitting of the
gallery layer or debonding of the interphase layer, leading to reduction in the
strength of PCNs. These results could be used as guidelines for manufacturing
PCNs with interfaces having high quality.
For the fiber reinforced PCNs (FRPCNs), an effective clay model was
proposed to reduce the computational time in explicit FEM. A corresponding
user defined material subroutine (VUMAT) was developed to describe the
material behavior of the effective clay in the commercial FEM software
Summary
vii
(Abaqus). The damage analysis of the FRPCNs under transverse tensile
loading was also conducted by computational homogenization. Results
indicate the interphase between the fiber and matrix is the key factor which
dominates the strength of the FRPCNs. The effect of adding nano-clay to
FRPs in order to increase interfacial strength, however, needs to be further
studied.
Overall, this study suggests the 3D RVE model implemented with
computational homogenization method and appropriate damage criteria could
successfully replicate the properties of ECNs/NCNs. To the best knowledge of
the author, this is the first 3D RVE model which takes into account the
damage behavior for both the interfacial layers and the polymer matrix in
polymer/clay nanocomposites. This method could be applied to other PCNs
provided material properties of their constituents are well characterized.
List of Tables
viii
List of Tables
Table 3.1 Cohesive law for gallery.
Table 3.2 Material properties in epoxy/clay nanocomposites.
Table 4.1 Stretches to generate different initial triaxiality.
Table 5.1 Boundary conditions to obtain the elastic constants of effective
clay.
Table 5.2 Elastic properties of effective clay in epoxy/clay
nanocomposites.
Table 5.3 Elastic properties of effective clay in nylon 6/clay
nanocomposites.
Table 5.4 Material properties of fiber.
List of Figures
ix
List of Figures
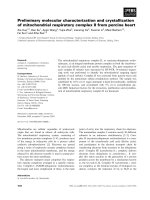
Figure 1.1 Schematic illustration of polymer/clay nanocomposites
morphologies. (a) Microcomposite (b) Intercalated
nanocomposites and (c) Exfoliated nanocomposites.
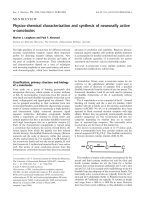
Figure 1.2 Schematic illustration of crack initiation and propagation in the
epoxy/clay nanocomposites.
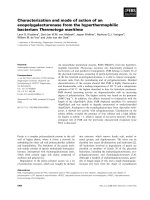
Figure 1.3 Mechanical properties of the epoxy/S-clays and the nylon
6/clay nanocomposites as a function of clay content.
Figure 1.4 Schematic illustration of a nanoparticle surrounded by
interphase layer and located in a subcell.
Figure 1.5 Von Mises stress comparison between models using an
unstructured mesh with tie constraints compared with
structured embedded elements.
Figure 1.6 Randomly distributed short fiber (RDSF) composites RVE and
its FE mesh.
Figure 1.7 Schematic view of the crack in ECNs.
Figure 1.8 Examples of RVEs used in FE simulations with randomly
distributed and oriented particles at different clay volume
fractions.
Figure 1.9 Scenario of mechanical properties improvement of CFRP by
incorporation of nano-fillers.
Figure 2.1 (a) Illustration of clay platelet in polymer/clay nanocomposites
and (b) FE model of the clay particle.
Figure 2.2 Schematic illustration of translation and rotation of a newly
generated clay particle.
Figure 2.3 Schematic illustrations of clay particles which cross the
boundary of the RVE cubic (a) clay particle crosses one face
and (b) clay particles crosses one edge only.
Figure 2.4 Finite element meshes of (a) Matrix (b) clay particles and (c)
RVE model of PCNs.
Figure 2.5 Schematic illustration of boundary conditions for RVE model.
List of Figures
x
Figure 2.6 Implementation of the multipoint constraint equations in
Abaqus.
Figure 2.7 Analysis flowchart for the whole PCN model.
Figure 3.1 Illustration of clay platelet in epoxy/clay nanocomposites.
Figure 3.2 Traction-separation law with linear degradation.
Figure 3.3 The normalized cohesive law of gallery in epoxy/clay
nanocomposites.
Figure 3.4 Post-failure stress-displacement curve for brittle cracking
model.
Figure 3.5 The dependency of elastic modulus on the number of clay
particles.
Figure 3.6 Effect of particle size on (a) elastic modulus and (b) tensile
strength of epoxy/clay nanocomposites; Effect of number of
silicate layers on (c) elastic modulus and (d) tensile strength of
epoxy/clay nanocomposites.
Figure 3.7 Comparison of internal and kinetic energy during loading
increases.
Figure 3.8 Stress-strain curve of epoxy/clay nanocomposites with 3%
weight fraction of nano-clay.
Figure 3.9 Numerical prediction of damage sequence of epoxy/clay
nanocomposites with 3% weight fraction of nano-clay.
Figure 3.10 Stress-strain curves of epoxy/clay nanocomposites with 3%
weight fraction of nano-clay and different gallery strength.
Figure 3.11 Combined effects of gallery layer and interphase on tensile
strength of epoxy/clay nanocomposites with 3% weight fraction
of nano-clay.
Figure 4.1 (a) Illustration of clay platelet in nylon 6/clay nanocomposites
(b) FE model of the clay particle and (c) RVE model of nylon
6/clay nanocomposites with 2.5% weight fraction of nano-clay.
Figure 4.2 (a) Molecular model of gallery layer and (b) Molecular
configuration of the gallery layer after total separation.
Figure 4.3 (a) Molecular model of interphase layer and (b) Molecular
configuration of the interphase layer after total separation.
Figure 4.4 Traction-separation law for gallery layer and interphase layer.
List of Figures
xi
Figure 4.5 Test specimens for generating different stress triaxiality.
Figure 4.6 Experimental set up for tensile test.
Figure 4.7 Fracture locus of nylon 6. Experiments vs. curve fitting.
Figure 4.8 Comparison between experimental results and numerical
prediction with implemented GTN model and PDD criterion.
Figure 4.9 Effect of particle size on (a) elastic modulus and (b) stress-
strain response; Effect of number of layers on (c) elastic
modulus and (d) stress-strain curve.
Figure 4.10 RVE model with 1% weight fraction of nano-clay (a) N=2 and
104nm
g i s
d d d
(b) N=2 and
208nm;
g i s
d d d
(c)
and (d) stress distribution on silicate layers, (c) and (d) are
extracted at the same tensile strain.
Figure 4.11 Comparison of stress-strain curves of nylon 6/clay
nanocomposites with 2.5% weight fraction of nano-clay
between numerical prediction and experiential data.
Figure 4.12 Comparison of stress-strain curves of nylon 6/clay
nanocomposites with 2.5% weight fraction of nano-clay
between numerical prediction (GTN) and experimental data.
Figure 4.13 Damage patterns of the numerical prediction. SDEG denotes
stiffness degradation factor. An element is regarded as totally
damaged and is deleted when its SDEG reaches 1.
Figure 4.14 Effect of strength of interface layers on stress-strain curve of
nylon 6/clay nanocomposites with 2.5% weight fraction of
nano-clay.
Figure 4.15 Damage caused by weak adhesion between polymer chains.
VVF denotes the void volume fraction.
Figure 4.16 Effect of initial triaxiality on stress-strain curve of NCNs.
Figure 5.1 Explicit clay model and Effective clay model.
Figure 5.2 Quasi-traction-separation law for effective clay models with
different number of silicate layers, (for the NCNs model).
Figure 5.3 (a) The explicit RVE and (b) the effective RVE.
Figure 5.4 Dependency of elastic modulus of explicit RVE and effective
RVE on the number of silicate layers, (for ECNs).
List of Figures
xii
Figure 5.5 Dependency of elastic modulus of explicit RVE and effective
RVE on diameter of clay particle, (for ECNs).
Figure 5.6 Dependency of elastic modulus of explicit RVE and effective
RVE on the number of silicate layer, (for NCNs).
Figure 5.7 Dependency of elastic modulus of explicit RVE and effective
RVE on diameter of clay particle, (for NCNs).
Figure 5.8 Schematic illustration of one clay particle in (a) explicit RVE
and (b) effective RVE.
Figure 5.9 Benchmark study showing the stress contour of matrix in (a)
explicit RVE and (b) effective RVE.
Figure 5.10 Numerical predictions by effective RVE model of damage
sequence of epoxy/clay nanocomposites with 3% weight
fraction of nano-clay.
Figure 5.11 Stress-strain curve of ECNs with effective RVE and explicit
RVE.
Figure 5.12 Stress distribution (in the Y direction,
Y
) along the diameter of
the clay particle.
Figure 5.13 Damage patterns of NCNs from numerical predictions using (a)
explicit RVE and (b) effective RVE models.
Figure 5.14 Stress-strain curve of NCNs with effective RVE and explicit
RVE.
Figure 5.15 Unit cell models for micromechanics analysis (a) square model
and (b) hexagonal model.
Figure 5.16 Illustration of fiber reinforced polymer/clay nanocomposites.
Figure 5.17 FRPCNs model with meshes.
Figure 5.18 Predicted transverse modulus of fiber/epoxy nanocomposites.
Figure 5.19 Transverse Modulus of glass fiber/epoxy nanocomposites with
various organoclay loadings.
Figure 5.20 Transverse tensile strength of glass fiber/epoxy nanocomposites
with various organoclay loadings.
Figure 5.21 SEM micrographics of glass fiber/epoxy nanocomposites
samples (a) pure epoxy and (b) 5% weight fraction of
organoclay.
List of Figures
xiii
Figure 5.22 Effect of strength of interface on the transverse tensile strength
of FRECNs.
Figure 5.23 Damage patterns of FRECNs with (a) weak interface and (b)
strong interface.
Nomenclature
xiv
Nomenclature
E
Elastic modulus
Possion’s ratio
G
Shear modulus
Volume fraction
Shape parameter
C
Stiffness tensor
N
Number of silicate layer of per nano-clay
d
Diameter of silicate, interphase, gallery layer
h
Thickness of silicate, interphase, gallery layer
r
Direction vector
Rotation angles
L
Length of the RVE
, , u v w
Displacement along
, and X Y Z
directions
Displacement variables
Stress variables
Stain variables
Volume
F
Reaction force
,b t
Body and surface force
M
Mass matrix
P, I Force vector
Nomenclature
xv
d
c
Dilatational wave speed
,
Lame’s constants
Density
,
ig
KK
Defect factor of gallery layer and interphase layer
D Degradation factor
1
G
Mode I fracture energy release rate
Triaxiality
r
Radius of notched samples
q
Effective Mises stress
p
Hydrostatic pressure
1
q
,
2
q
,
3
q
Material parameters in GTN model
f
Void volume fraction
, and
X Y Z
Stretch variables
PCNs Polymer/clay nanocomposites
ECNs Epoxy/clay nanocomposites
NCNs Nylon 6/clay nanocomposites
FRPCNs Fiber reinforced polymer/clay nanocomposites
PDD Progressive ductile damage criterion
GTN Gurson-Tvergaard-Needleman model
MD Molecular Dynamics
Chapter 1 Introduction and Literature Review
1
Chapter 1
Introduction and Literature Review
1.1 Introduction
Polymer nanocomposites are a novel class of materials where nanometer-sized
fillers are introduced into a distinct polymer matrix. In recent years, polymer
nanocomposites have drawn great attention both in academia as well as
industry. This is due to the fact that these nanocomposites exhibit significant
improvements in mechanical, thermal and barrier properties compared with
the traditional polymers [1-3]. A polymer nanocomposites system generally
contains two material phases - the polymer matrix and nanometer-sized fillers.
The polymer matrix could be either a thermoplastic polymer or thermoset
polymer. According to their shape, nanometer-sized fillers can be divided into
Chapter 1 Introduction and Literature Review
2
dot-like, tube-like and plate-like. Examples of these three types of nanometer-
sized fillers are nano-silica, nano-tube and nano-clay respectively. Among
various polymer nanocomposites, the polymer/clay nanocomposites (PCNs)
have been most widely used in automotive structures, aircrafts, infrastructure,
etc. Nano-clay is usually referred to as a natural mineral with a sandwich
structure consisting of silicate platelets and interlayers of galleries in between
[4]. The most commonly used mineral is montmorillonite (MMT) or its
modified form with organic treatment.
Various PCNs have been developed and characterized since the Toyota
research group (1993) produced the first type of PCNs, namely nylon 6/clay
nanocomposites (NCNs) [5]. The nylon 6 used in the NCNs is one typical
thermoplastic polymer. The most widely used thermoset PCNs is epoxy/clay
nanocomposites (ECNs). Both NCNs and ECNs exhibit remarkable
enhancements in mechanical properties compared with the pure polymers.
Massive research work has been carried out to address the microstructure-
property relationship of PCNs. That is because the mechanical properties,
especially the damage mechanisms of PCNs are strongly related to the
material microstructure. Although the damage mechanism of PCNs has been
studied, it is still an open problem for consideration in structural and practical
applications. Numerical modeling methods have been proven to be effective
approaches and are widely adopted to study the microstructure-properties
relationship of nanocomposites systems. Numerical models could explicitly
represent the heterogeneity of material of PCNs. Moreover, damage initiation,
damage propagation and the local deformation of PCNs could be characterized
Chapter 1 Introduction and Literature Review
3
and quantitatively collected in the numerical predictions. In sum, for the PCNs
systems, a fundamental task for a reliable prediction is establishing a
numerical model which should accurately reflect the morphologies of PCNs.
Traditionally, transmission electron microscopy (TEM) and X-ray diffraction
(XRD) are used to characterize nanocomposites at the nano-scale resolution
[6]. TEM and XRD provide essential information on the structure of the
nanocomposites. TEM is used to give qualitative information and extensive
imaging is required to ensure a representative view of the whole material,
whereas XRD allows quantification of changes in layered-platelet spacing.
Other methods such as small-angle X-ray scattering and rheological
measurements also serve to complement the XRD and TEM data. It should be
noted that although the polymer matrices could be different, the morphologies
of nanocomposites are almost the same in different PCNs systems.
There are three typical morphologies of nanocomposites depending on the
degree of exfoliation of the clay platelets [6]. They are microcomposites,
intercalated nanocomposites and exfoliated nanocomposites as shown in
Figure 1.1. In microcomposites, clay tactoids exist with no penetration of the
polymer into the clay platelet. In an intercalated nanocomposites, the insertion
of polymer into the clay structure occurs to swell the spacing between platelets
in a regular fashion. In exfoliated nanocomposites, the individual clay layers
are dispersed as single platelets into a continuous polymer matrix. Many of the
properties associated with PCNs are a function of the extent of exfoliation of
the individual clay sheets. The higher the degree of exfoliation, the better the
clay platelet can transfer load, leading to a higher stiffness. However, 100%
Chapter 1 Introduction and Literature Review
4
exfoliated condition is never achieved. From the view of continuum
mechanics, the damage mechanisms differ for different types of morphologies
of PCNs. For microcomposites of PCNs, damage usually occurs due to stress
concentration. For exfoliated PCNs, failure could easily form at the interface
area between the nano-clay and polymer because of weak cohesion. When it
comes to intercalated PCNs, the damage could start by splitting of the clay
platelets or debonding of the interface as in exfoliated PCNs. For all these
types of PCNs, the low adhesion force among polymer molecules could also
lead to void formulation. In the next sections, different modeling approaches
and studies on mechanical properties of PCNs will be discussed in detail.
Figure 1.1 Schematic illustrations of polymer/clay nanocomposites morphologies. (a)
Microcomposite (b) Intercalated nanocomposites and (c) Exfoliated nanocomposites,
reprinted from [6].
Chapter 1 Introduction and Literature Review
5
1.2 Review of Studies on Mechanical Properties of PCNs
Experimental work, analytical modeling and numerical modeling method are
widely used in material science to understand and explain microstructure
versus mechanical properties relationship. In this section, studies on PCNs
from these three approaches will be reviewed and discussed. The limitations of
these existing approaches will also be identified.
1.2.1 Experimental Work on PCNs
Toyota research group [5] produced the first PCNs-nylon 6/clay
nanocomposites (NCNs). They also performed tensile, flexural, impact and
heat distortion tests to estimate the mechanical properties of NCNs. It is found
that the strength and elastic stiffness of NCNs incorporating less than 5%
weight fraction of nano-clay are superior to that of pure nylon. Since the
pioneering work of the Toyota research group, various PCNs, which are
classified according to the polymer matrix, have been produced, such as epoxy
[7-13], polyimide [14], polystyrene [15] polyurethane [16], and polypropylene
[17]. These PCNs all exhibit improved mechanical performance.
Besides the NCNs, epoxy/clay nanocomposites (ECNs) are the next most
studied and used PCNs. While the elastic properties of PCNs have been well
documented, some research has also been carried out to characterize the
damage mechanism of PCNs. Yasmin et al. [12, 13] adopted the shear mixing
method to produce ECNs with 1-10% weight fraction of nano-clay and found
Chapter 1 Introduction and Literature Review
6
that both the Young’s modulus and storage modulus of ECNs increase as the
clay content increases. The results were consistent with most particulate-filled
systems. Zerda et al. [10] studied the crack propagation and roughness of the
fracture surface of ECNs. Zerda suggested that the creation of additional
surface area on crack propagation is the primary toughening mechanism.
Wang et al. [11] prepared highly exfoliated ECNs by using the so-called
slurry-compounding process. They characterized the ECNs by means of
transmission electron microscopy (TEM) and pointed out that most of the
microcracks initiate between clay layers. Figure 1.2 schematically illustrates
the deformation mechanisms in highly exfoliated but intercalated epoxy/clay
nanocomposites. When a load is applied, some microcracks initiate from the
gallery layer (Figure 1.2.a). Upon further loading, these microcracks develop
and extend into the matrix (Figures 1.2.b and 1.2.c). The microcracks tend to
penetrate matrix ligaments and coalesce to form macroscopic cracks (Figures
1.2.d, 1.2.e and 1.2.f). After macroscopic cracks form, the preformed
microcracks in the sub-fracture surface may also stop extending while the
neighbouring main crack propagates. This work is noteworthy in that it
provides a good process method to produce ECNs with high fracture
toughness. Furthermore, the author also provides an insightful view on the
damage propagation process of ECNs. He et al. [18] studied the damage
mechanism of NCNs. In that study, the crazing was claimed as the main
mechanism for the enhancement of toughness in NCNs. At higher clay
loadings the crazing was prevented from operating to its fullest possible extent,
thus resulting in low toughness. They also mentioned that the damage initiates
Chapter 1 Introduction and Literature Review
7
due to the weak adhesion among the polymer chains of nylon 6 not far from
the nano-clay.
Figure 1.2 Schematic illustration of crack initiation and propagation in the epoxy/clay
nanocomposites, reprinted from [11].
In order to understand the different mechanical performances between
thermoset/clay nanocomposites and thermoplastic/clay nanocomposites, the
comparison of mechanical properties between the epoxy/clay nanocomposites
and the nylon 6/clay nanocomposites as a function of clay content is indicated
in the Figure 1.3. As shown in Figures 1.3.a and 1.3.b, the elastic stiffness for
both ECNs and NCNs increase as the content of nano-clay increases. Figure
1.3.c shows the tensile strength of ECNs decreases as the clay content
increases. This is because the epoxy usually exhibits brittle behavior and more
nano-clay will increase the density of stress concentration around the nano-
clay particles which will lead to easier formation of macroscopic damage.
Chapter 1 Introduction and Literature Review
8
Adding more clay particles tends to make the NCNs be much stiffer, leading
to higher maximum strength of the NCNs, as presented in Figure 1.3.d. At the
same time, the fact that strain at maximum strength of NCNs decreases as the
content of nano-clay increases indicates that the addition of nano-clay will
Figure 1.3 Mechanical properties of the epoxy/clay nanocomposites and the nylon 6/clay
nanocomposites as a function of clay content. (a) elastic stiffness of epoxy/clay
nanocomposites (b) elastic stiffness of nylon 6/clay nanocomposites (c) tensile strength of
epoxy/clay nanocomposites (d) maximum strength and strain at maximum strength of
nylon 6/clay nanocomposites (e) Model I critical strain energy release rate of epoxy/clay
nanocomposites (f) Critical stress intensity factor of nylon 6/clay nanocomposites,
reprinted from [11, 18].