Interface studies of rare earth oxides on silicon and germanium substrates
Bạn đang xem bản rút gọn của tài liệu. Xem và tải ngay bản đầy đủ của tài liệu tại đây (4.32 MB, 232 trang )
INTERFACE STUDIES OF RARE EARTH OXIDES
ON SILICON AND GERMANIUM SUBSTRATES
LIU ZHIQIANG
(B. Eng.(Hons.), NUS)
A Thesis Submitted for the Degree of Doctor of
Philosophy
Department of Electrical and Computer Engineering
National University of Singapore
2012
i
Abstract
Abstract
In recent decades, the high-k/semiconductor interface is gaining much interest due to
miniaturization of devices. Rare earth based oxides are promising candidates to
succeed hafnium oxide as the second generation high dielectric constant (high-k)
dielectrics. The first part of this dissertation investigates the mechanisms behind
interface dipole formation which are responsible for appreciable flatband voltage
shifts commonly observed in capacitors involving rare earth oxides. Electron affinity
and band offsets are measured using photoemission and with the latter being corrected
for differential charging using a novel, time-resolved method. A dipole neutrality
concept/model is then introduced after careful evaluation of the use of
electronegativity in band alignment models. This novel model allows accurate
prediction of interface dipoles which will be beneficial for threshold voltage
adjustments in advanced gate stack engineering. The second part looks into
manipulation of the interface to improve device characteristics. An ultra-thin yttrium
interlayer is found to be able to improve interface trap density, leakage current and
thermal stability of lanthanum aluminate capacitors on silicon. Furthermore, an
interfacial-layer-free growth of yttrium oxide on germanium is demonstrated using a
layer-by-layer approach. This is particularly useful in terms of equivalent-oxide-
thickness scaling for next-generation devices.
ii
Acknowledgements
Acknowledgements
First and foremost, I would like to thank my thesis supervisors: A/Prof. Chim Wai
Kin for his support and guidance throughout this four years, and for allowing me
freedom to purse my area of interest in my Ph.D. studies; Dr. Pan Ji Sheng for
granting access (even after office hours) to the XPS equipment and the memorable
experience during the Poland conference trip. I am much indebted to my mentor, Dr.
Chiam Sing Yang for being an inspirational figure during these four years. The
engaging discussions we shared on XPS and band alignment theories have given me
useful insights to carry out my research. I am especially grateful for the countless
hours you have spent on correcting my reports and manuscripts, and the moral support
you have given me as a friend.
Next, I would like to thank Dr. Lap Chan for imparting his knowledge to us and
sharing his life experiences. Your teachings will no doubt be useful during my stay in
the industry. I would also like to show my appreciation to Dr. Ng Chee Mang and Mr.
Leong Kam Chew for organizing the lessons and Wednesday meetings, and Dr. Du
Anyan for helping me with TEM characterization. I would like to express my
gratitude to the staff in IMRE for graciously accommodating my presence: Dr. Wang
Shijie for kindly giving me some GaN and ZnO substrates, Dr. Zhang Zheng, Ms.
Doreen Lai Mei Ying, and Dr. Chai Jian Wei for allowing me to use his growth
chamber. I am also very grateful to Prof. Choi Wee Kiong, Walter, and Xiao Yun for
granting me access to the Microelectronics Laboratory equipment. I am also grateful
to have the companionship of Anna, Jinquan, Pi Can, Ren Yi, and Roger in CICFAR
iii
Acknowledgements
2 lab, and also my friends in GlobalFoundries: Jason, Shuping, Sumarlina, Raymond,
Xuanding, Duen Yang, Vanessa, Irvine, and many others. Also, special thanks go out
to Wenhu and Shurong for taking the time to help me with the low temperature
electrical measurements and TEM preparation in NTU.
I am eternally grateful to my family, especially my mother for treating me with
unconditional love and care. Last but not least, I am extremely grateful for all the
support and love from my fiancée, Cheryl, who gave me the strength and courage to
survive through the trying times. Thank you for always being by my side.
iv
Contents
Contents
Abstract i
Acknowledgements ii
Contents iv
List of Tables viii
List of Figures xi
1.Introduction and Motivation 1
1.1. MOS scaling: problems and solutions 1
1.2. Issues pertinent to the choice of high-k dielectrics 3
1.3. Importance of studying the high-k/semiconductor interface 4
1.4. Organization of thesis 6
2.Literature Review 8
2.1. Basic material properties 8
2.1.1. Rare earth oxides as second generation high-k dielectrics 8
2.1.2. Germanium as high mobility channel material 11
2.1.3. Passivation of the germanium interface 12
2.2. Physics of surfaces and interfaces 15
2.2.1. Deviation of surfaces from bulk 15
2.2.2. Electronic states at surfaces 16
2.2.3. Adatom induced surface band bending 18
2.2.4. Work function and electron affinity 21
2.3. Band alignment theories 22
2.3.1. Ideal Schottky-Mott lineup 23
2.3.2. Concept of charge neutrality: Metal-induced gap states 25
2.3.3. Calculation of branch point energies 27
2.3.4. Chemical trends: Interface-induced gap states 28
2.3.5. Other extrinsic mechanisms 33
2.4. Band offset measurement techniques 34
2.4.1. Electrical/transport based techniques 35
v
Contents
2.4.2. Photoemission based techniques 35
2.4.2.1. Core-level at interface 36
2.4.2.2. Valence band at interface 37
3.Experimental Setup and Theory 39
3.1. Growth setup 39
3.1.1. Sample preparation 39
3.1.2. Sputtering, thermal evaporation and annealing 40
3.1.3. UHV evaporation 42
3.2. Characterization techniques 46
3.2.1. Photoelectron spectroscopy 46
3.2.1.1. Instrumentation 49
3.2.1.2. Binding energy shifts 51
3.2.1.3. Spectral features 55
3.2.1.4. Peak fitting 58
3.2.1.5. Electron mean free path and quantification 59
3.2.1.6. Valence band and work function measurements 62
3.2.2. Transmission electron microscopy 64
3.2.2.1. Instrumentation 65
3.2.2.2. Sample preparation 66
3.2.3. X-ray diffraction and ellipsometery 67
3.2.4. Electrical measurements 69
3.2.4.1. High frequency capacitance-voltage measurements 69
3.2.4.2. Conductance measurements 71
3.2.4.3. Leakage current-voltage measurements 76
4.Challenges in interface dipole measurements: Corrections and
Implications 81
4.1. Accurate determination of relevant parameters 82
4.1.1. Band gap 83
4.1.2. Valence band offset 85
4.1.2.1. Differential charging effects 86
4.1.2.2. Extra-atomic relaxation effects 92
4.1.3. Electron affinity 95
vi
Contents
4.1.3.1. Effects of surface carbon contaminants 96
4.2. Importance of accurate measurements 100
4.2.1. Validation of the MIGS model 102
4.2.2. Comparison with existing V
FB
shifts 105
5.Dipole neutrality point: Re-evaluating the use of
electronegativity in band alignment 106
5.1. Evaluation of current band alignment models 107
5.1.1. Band offset measurement of LAO heterostructures 109
5.1.2. Derived slope parameters for MIGS and IFIGS models 112
5.1.3. Implications of negative slope parameter 117
5.2. Introduction of a novel dipole neutrality point model 118
5.2.1. Investigation of correlation for high-k oxides 121
5.2.2. Dipole neutrality point (DNP) model 127
5.2.3. Comparison with experimental interface dipoles 128
5.2.4. Comparison with flatband (V
FB
) voltage shifts 130
6.Improving the thermal stability of the LaAlO
3
/Si interface:
Band offset and other electrical properties 133
6.1. Improvement in the thermal stability of band offset 135
6.1.1. Photoemission method 135
6.1.2. Electrical method: V
FB
-EOT plots 138
6.1.2.1. EOT determination 138
6.1.2.2. V
FB
determination 141
6.1.2.3. V
FB
-EOT plots: Changes in effective metal work function 141
6.1.3. Changes in chemical profile investigated by XPS 146
6.1.4. Mechanism for interface dipole formation 149
6.2. Improvement of other electrical properties 151
6.2.1. Interface trap density 151
6.2.2. Leakage current 153
7.Control of the Y
2
O
3
/Ge interface by understanding of the
initial growth processes 159
7.1. Initial growth of yttrium on germanium 161
vii
Contents
7.1.1. Stage I: Adatom induced band bending 163
7.1.2. Stage II: Intermixing 165
7.1.3. Stage III: Formation of metallic yttrium 169
7.2. IL-free growth of Y
2
O
3
on Ge using a layer-by-layer method 171
7.2.1. Effects of different oxidation sources on IL formation 173
7.2.2. Novel layer-by-layer method to suppress IL formation 174
7.2.3. Effects of different substrate surfaces on IL formation 176
7.2.4. Discussion on pathways of IL formation 178
8.Summary and Conclusion 179
8.1. Summary of findings 179
8.2. Conclusion and future work 182
References 184
Appendix I: Derivation of MIGS equation 201
Appendix II: Calibration of Omicron EFM3 204
Appendix III: Attenuation equations 205
Appendix IV: Interpretation and selection of relevant core level peaks 207
Appendix V: Derivation of interface dipole using intrinsic gap states models210
List of Publications 211
viii
List of Tables
List of Tables
Table 2.1: Summary of the dielectric constant (k), band gap (E
g
), conduction (CBO)
and valence band offsets (VBO) on Si values for rare earth (RE) oxides and transition
metal (TM) oxides. The data marked with asterisks are obtained from this work while
the rest of the data are obtained from refs. 22 and 25 9
Table 2.2: Summary of important physical properties of Ge in comparison with Si and
other alternative semiconductor channel materials. 12
Table 4.1: Summary of the measured Auger parameter (AP) values. Units for binding
energy (BE) and kinetic energy (KE) values are in eV. Δα is the difference in the AP
between the bulk (15 nm) and thin (4 nm) LAO sample, where AP 1 = BE (La3d
3/2
) +
KE (M
4
N
4,5
O
1
) and AP 2 = BE (La3d
5/2
) + KE (M
5
N
4,5
O
2,3
) respectively. 94
Table 4.2: Measured electron affinity (χ) values and the spectrum width (W) for the
LAO/Ge heterostructure before (As Dep) and after various surface treatments. The
spectrum width (W) is defined as the difference between the valence band maximum
and the cutoff of the secondary electron spectrum measured using UPS. 98
Table 4.3: Ambiguity in magnitude and polarity of the derived interface dipole
potential (Δ) value should incorrect measurements of (a) χ or (b) valence band offset
(VBO) be used. The values outside the brackets are experimentally determined while
those within the brackets correspond to the predictions by the MIGS model. The
direction of Δ is as defined in Fig. 4.1 102
Table 5.1: A comparison of our experimental valence band offset (VBO) values
against those that are available in the literature. Note that the data in literature
obtained by both photoemission techniques using core level, XPS (ΔE
CL
), and valence
band, XPS (ΔE
V
), separation at the interface do not explicitly account for differential
charging. The VBO values obtained using internal photoemission (IPE) and
photoconductivity (PC) is also shown. VBO is derived from the band gap values
ix
List of Tables
measured using PC and the conduction band offset obtained from IPE. All values are
expressed in electron volt (eV) with an experimental error of ± 0.1 eV. 111
Table 5.2: Summary of intrinsic properties of the semiconductors for electron affinity
(χ), bandgap (E
g
) and energy distance from the valence band maximum to the charge
neutrality level (
VBM
CNL
Φ
).
209,97
The difference between the electronegativity of
lanthanum aluminate (LAO) and the respective semiconductors is given by ΔEN. The
conduction band offset (CBO) and valence band offset (VBO) of each semiconductor
with LAO as predicted by the metal induced gap states (MIGS) and interface induced
gap states (IFIGS) models are shown. Experimental VBO (± 0.1 eV) values are
obtained in this work by measuring the bulk core-level separation (E
CL
- E
V
) and the
interface core-level separation (ΔE
CL
) of the selected core level orbitals to represent
the substrate. The measured CBO (± 0.2 eV) is obtained by using the measured
bandgap value of 6.13 eV for LAO. ΔEN is presented in Miedema units while the rest
of the values are in electron volts (eV). 114
Table 5.3: Summary of the measured band gap (E
g
), electron affinities of high-k (HK)
oxides used in this study and the derived dielectric work functions,
Vac
CNL
Φ
based on the
range of CNL values from literature. Miedema electronegativity values (EN) are also
shown. The measured E
CL
-E
V
values for the bulk high-k oxides are used to calculate
the experimental valence band offset (VBO). The experimental (Exp.) interface dipole
(Δ) of the various high-k oxides on silicon (Si) and germanium (Ge) are shown along
with the predicted dipoles (DNP) from our dipole neutrality point model. 123
Table 6.1: Experimental valence band offsets (VBO) of LAO/Si and LAO/Y/Si films
under different annealing conditions, determined using XPS. The experimental error
is ±0.1 eV. 137
Table 6.2: Comparison of the equivalent oxide thickness (EOT) values extracted using
different extrapolation based techniques, namely McNutt and Sah (Mc), Maserjian
(Mas) and Samares Kar (Kar 1 and Kar 2) techniques. Fitting using a quantum
mechanical C-V simulator (QMCV) developed by the Berkeley group generally gives
a lower EOT value and it differs by an average of ~5% compared with the
extrapolation methods mentioned above.
254
The largest difference is ~11%. 141
x
List of Tables
Table 6.3: Comparison of conduction band offset (CBO) and interface dipole potential
(Δ) for as-deposited and annealed LAO/Si and LAO/Y/Si samples. 149
Table 6.4: Summary of interface trap densities (D
it
) extracted from conductance
measurements before (Bef. Anneal) and after 800
o
C post deposition annealing (PDA).
It can be seen that D
it
is relatively constant, as expected, with variation in the oxide
thickness. Each data point represents the average value from 2 to 3 different
capacitors. 151
Table 6.5: Parameters extracted based on the SCLC equations for the different
capacitors. 156
Table 7.1: Summary of the measured work function (Φ) and Schottky barrier height
(Exp.) in comparison to the predicted values by the MIGS and IFIGS theories.
Experimental error of ±0.1 eV. 170
xi
List of Figures
List of Figures
Fig. 1.1: Schematic illustrating the various issues involved at the high-
k/semiconductor interface that are crucial to device performance. Note that k
IL
and
k
HK
represent the dielectric constants for both the interface layer and high-k dielectric
respectively. 5
Fig. 2.1: Real part of the one-electron wave function for (a) a standing Bloch wave
matched to an exponentially decaying tail in the vacuum and (b) a surface-state wave
function localized at the surface (z = 0). 17
Fig. 2.2: (a) Position of Fermi level above the VBM as a function of the amount of
nominal metal coverage on clean p-GaAs. Experimental data for In (■), Al (○), Ag
(□) and Au (●) deposited at low temperature from ref. 78 and curves calculated for
surface donors at 0.87, 0.76, 0.68 and 0.49 eV, respectively, above the VBM; (b)
Initial pinning position of Fermi level above the VBM as a function of the first
ionization energy of metal atoms deposited on p-GaAs. (●) data from ref. 81; (▲)
from refs. 78, 82; (▼) from ref. 83; (■) from refs. 84, 85. 19
Fig. 2.3: Schematic illustrating the “Gedanken” experiment of forming a Schottky
junction without the presence of any interface states. This will eventually imply that
the potential due to the interface dipole (i.e., Δ
is
) must be zero. 23
Fig. 2.4: Final pinning positions of the Fermi level above the valence-band maxima
versus electronegativity difference. Unfilled and partly filled symbols are labeling
data obtained with substrates doped p-type and n-type.
79,96
29
Fig. 2.5: Work function of metals and dielectric work function of semiconductors as a
function of Miedema’s electronegativites. (□) and (◊) represent data of metals while
(○) represents data of semiconductors. 30
Fig. 2.6: Energy band diagram of an oxide/semiconductor heterojunction showing
how the valence band offset (ΔE
V
) can be extracted using Kraut’s method (not drawn
xii
List of Figures
to scale). Note that E
V
represents the valence band maximum while E
CL
represents the
core level. 36
Fig. 2.7: Measured valence band spectra of 5nm Y
2
O
3
on Si at different depth
profiles. The time indicated for each profile represents the total sputtering time.
117
38
Fig. 3.1: Vapor pressure curves for different elements.
126
44
Fig. 3.2: Schematic illustrating photoemission as a three-step process: (1)
Photoionization of electrons with incident photons with energy of hv; (2) Emitted
travel to the surface with production of secondaries (shaded) as a result of inelastic
scattering; (3) Electron penetration through the surface and escape to vacuum. Note
that electrons can be emitted from the valence band (empty circle) or deeper in the
core levels (filled circle) and φ
sp
represents the work function of the spectrometer.
This schematic is a variation adapted from ref. 128. 47
Fig. 3.3: Experimental and theoretical mean free path plotted against the electron
kinetic energies for various elements. 60
Fig. 3.4: Energy diagram schematic illustrating the measurement of electron affinity χ
using UPS with a photon energy of hv = 21.2 eV. Application of a negative bias
(black bold arrow) is necessary to overcome the spectrometer work function φ
sp
so
that χ can be accurately extracted from the measured spectral width of W
2
. This width
is defined as the energy distance from the cut-off energy of the secondaries (shaded)
to the valence band maximum (VBM). 63
Fig. 3.5: UPS Fermi edge region of an ITO film.
160
64
Fig. 3.6: Band bending diagram showing how gate bias affects the occupancy of
interface traps for a n-type substrate. (a) No gate bias; (b) small positive gate bias; and
(c) small negative gate bias. 72
Fig. 3.7: (a) Equivalent circuit for a single-level interface trap with capacitance C
T
,
and conductance G
n
, related to the capture of majority carriers, substrate capacitance
of C
D
in depletion, and oxide capacitance C
ox
. (b) Measured admittance, Y
m
across
xiii
List of Figures
terminals A-A using the equivalent parallel capacitance C
p
, and conductance G
p
. (c)
Plot of (C
p
-C
D
)/C
T
and (G
p
/(ωC
T
)) as a function of ωτ. 73
Fig. 3.8: (a) Plot of G
p
/ω versus frequency whereby the width of the peak varies with
the standard deviation of band bending (σ
s
) in a manner shown in (b); the dependence
of the function f
D
and ξ
p
on σ
s
are shown in (c) and (d) respectively. Note that ξ
p
=
ω
p
τ
p
169
75
Fig. 3.9: A log-log plot of current-voltage characteristic for SCLC conduction
mechanism. 79
Fig. 4.1: Energy band diagram schematic showing how the interface dipole potential
(Δ) in a heterostructure of two materials (A and B) is related to the valence band
offset (VBO), conduction band offset (CBO), electron affinity (χ) and band gap (E
g
).
Note that the direction of the interface dipole is taken to be positive, when the
negative polarity is on the semiconductor side (as shown in diagram). 82
Fig. 4.2: (a) Schematic of the O1s interband transition loss mechanism. (b) O1s
energy loss spectrum for a bulk (15 nm) LAO film on Si. The band gap is taken as the
intersection between the background and the linear interpolation of the initial slope of
the loss peak. 84
Fig. 4.3: (a) High-energy resolution XPS spectrum showing (a) valence and La 3d
core-level peaks for a bulk (15 nm) LAO sample and (b) valence and Ge 3d core-level
peaks for a clean Ge bulk sample. 85
Fig. 4.4: (a) Photoemission peaks of Ge 3d
5/2
and La 3d
5/2
(satellite I [Sat. I]
representing the substrate and oxide overlayer film, respectively, at different x-ray
irradiation (exposure) binding energies of the substrate (Ge 3d
5/2
) and oxide (La 3d
5/2
)
core-level peaks plotted as a function of the x-ray exposure time. The dotted line for
La 3d
5/2
plot is a best fit function. 88
Fig. 4.5: Time-resolved plots showing core-level separations (ΔE
CL
) vs X-ray
exposure time for (a) 5nm LAO/Si and (b) 5 nm LAO/Ge heterostructures after
xiv
List of Figures
different durations of ambient exposure. The dotted lines are best fit functions, and
the convergence of the lines at time zero represents the zero-charge state, ΔE
CL(0)
. 89
Fig. 4.6: (a) Typical Auger spectrum obtained using X-ray source in an XPS
experiment. The La Auger peaks consist of a series of transitions, namely: peak a:
M
4
N
4,5
O
1
; peak b: M
5
N
4,5
O
2,3
; peak c: M
5
N
4,5
N
6,7
, M
4
N
4,5
O
2,3
; and peak d: M
4
N
4,5
N
6,7
.
Peaks a and b are chosen to be used in the AP calculations tabulated in Table 4.1. (b)
Binding energy (BE) shifts due to core-level relaxations at different positions (z)
based on an image charge model. 93
Fig. 4.7: (a) C 1s photoemission peaks before and after low power (150 W) oxygen
plasma treatment of the LAO/Ge heterostructure with thickness of 5nm. (b) The
corresponding He I spectrum showing the changes caused by the removal of surface
carbon contaminants. The inset in (b) shows a magnified view of the changes near the
valence band maxima after the removal of surface carbon contaminants. (c) Measured
time-resolved plots of the core level separations (ΔE
CL
) for the as-deposited (As dep)
sample and after different durations of oxygen (O) plasma treatment. The lines are
best fit functions and show the correction of differential charging when extrapolated
to time zero. 99
Fig. 4.8: Energy band diagram for the LAO/Si heterostructure, derived using the
measured electron affinity (χ) of (a) as-deposited samples and (b) after surface
treatment that removes the carbon contaminants. (c) Resultant band lineup using a
measured VBO without the time-resolved charge correction method (ΔE
CL(0)
+0.3 eV).
101
Fig. 5.1: Time resolved plots showing the respective binding energies (BE) vs. X-ray
irradiation time for 5 nm thick LAO films on (a) ZnO and (b) GaN substrates, with
application of a low energy electron flood gun (3V, 0.1 mA). 110
Fig. 5.2: Plot of experimental conduction band offset (CBO) minus the electron
affinity (χ) of the semiconductor versus the energy distance from the charge neutrality
level (CNL) to the vacuum level (
Vac
CNL
Φ
) for LAO on various semiconductor
substrates. The plot yields an experimental slope parameter of 0.6. 115
xv
List of Figures
Fig. 5.3: (a) Plot of experimental valence band offset (VBO) plus the energy distance
from the valence band maximum (VBM) to CNL (
VBM
CNL
Φ
) versus the difference in
electronegativity (ΔEN) between LAO and the various substrates. The plot yields an
experimental slope parameter (D
X
) of -0.38 eV/Miedema unit. (b) Plot of the
experimental valence band offset (VBO) versus energy distance from the valence
band maximum to the charge neutrality level (CNL),
VBM
CNL
Φ
. 116
Fig. 5.4: Illustration of the charge transfer responsible for formation of the interface
dipole at the high-k oxide/semiconductor interface (i) before and (ii) after contact.
This charge transfer occurs due to the difference in the charge neutrality levels
(CNLs). We will define a positive dipole formation as shown in (ii) and this occurs
when the dielectric work function (
Vac
CNL
Φ
) of the high-k (HK) oxide is smaller than
that of the semiconductor (Semi). 120
Fig. 5.5: UPS measurements of the high-k oxides used in this study, ie. (a) Al
2
O
3
, (b)
HfO
2
, (c) La
2
O
3
, and (d) Y
2
O
3
. Note that for all samples, a bias of -15 V is applied,
and the surface carbon contaminants are removed after application of low power (150
W) oxygen plasma treatment. 122
Fig. 5.6: Plot of (dielectric) work function with electronegativity (EN) for different
classes of materials including metals (triangles) and semiconductors (squares). Values
of high-k oxides using our measured data (red circles) and values from literature (blue
circles) are also shown, yielding the negative relationship between the dielectric work
function and EN (red dashed line).
97,209,213,230,231,232
The black error bar represents the
spread in the CNL values obtained theoretically. It can be seen that the differences
from various simulation works do not affect the negative correlation shown. The
dipole neutrality points (DNPs) for Si and Ge (shaded black squares) are indicated as
red and black crosses (refer to text for explanation). 124
Fig. 5.7: Plot of the CNL/gap ratio (i.e.,
CBM
CNL
Φ
/E
g
) versus electronegativity (EN) for
high-k oxides, where
CBM
CNL
Φ
is defined to be the energy distance from the charge
neutrality level (CNL) to the conduction band minimum (CBM). The values are taken
from refs. 97 and 230. 125
xvi
List of Figures
Fig. 5.8: Time-resolved plots used in obtaining the core-level separations for thin
high-k oxides on silicon. 129
Fig. 5.9: Time-resolved plots used in obtaining the core-level separations for thin
high-k oxides on germanium. 129
Fig. 5.10: Experimental values of V
FB
shifts due to interface dipoles and ΔEN (where
ΔEN = EN
high-k
– DNP
Si
, and DNP
Si
is equal to 5.46 Miedema units) for various
labeled high-k oxide/Si capacitor structures are shown as shaded and non-shaded bars,
respectively.
225,238,239
The bars are shown in order of increasing EN of the high-k
oxides. The plot clearly shows a good correlation between ΔEN and the V
FB
shifts,
thereby supporting our DNP concept for interface dipoles. 131
Fig. 6.1: Interface core-level separations of 4 nm (a) LAO/Si and (b) LAO/Y/Si
samples before and after 800
o
C annealing. 136
Fig. 6.2: Time-resolved plots showing core-level separations (ΔE
CL
) vs x-ray
exposure time for 4 nm (a) LAO/Si and (b) LAO/Y/Si under different annealing
conditions. 137
Fig. 6.3: Comparison of various extrapolation based methods to determine EOT for
Al/LAO(9nm)/Si capacitors (as-deposited). (a) McNutt and Kar 1 and (b) Maserjian
and Kar 2 techniques are shown with the extracted EOT values as indicated; (c)
Fitting of the experimental C-V data in strong accumulation using the quantum
mechanical C-V simulator (QMCV) from the Berkeley group. 140
Fig. 6.4: (a) Schematic of Al/HK/IL/Si/Al capacitor structure and the relative
positions of the oxide charges and dipoles involved, and (b) Energy band diagram
showing the influence of the dipole at the high-k/Si interface, Δ
HK/Si
(which could be
Δ
HK/IL
and/or Δ
IL/Si
) on the effective metal workfunction, Φ
eff,ms
. The alignment of the
system without interface dipoles is denoted by dash lines while the shift in the
effective vacuum level after the annealing is shown by the direction of the arrow. An
increase in Φ
eff,ms
can then be derived for the direction of the interface dipole induced.
143
xvii
List of Figures
Fig. 6.5: V
FB
plots for (a) Al/LAO/Si and (b) Al/LAO/Y/Si structures vs. EOT
HK
before (solid symbols) and after annealing (open symbols). The y-intercept (V
FB
at
EOT
HK
= 0) is determined from the best fit line shown. The indicated value is the
derived difference of the Φ
eff,ms
before and after the 800°C anneal. 145
Fig. 6.6: Si 2s XPS peaks before (As Dep) and after 800ºC annealing for 4 nm (a)
LAO/Si and (b) LAO/Y/Si. Comparison of the ratio of Si 2s substrate and the oxide
peak intensities shows that the addition of the Y-interlayer retards growth of the
interfacial oxide. 147
Fig. 6.7: Fitted Y3d XPS peaks of the sample with a Y-interlayer (a) before and (b)
after 800
o
C annealing. The peaks are aligned to the Si2s substrate peak. It can be seen
that the fitted Y3d
5/2
peak of the sample after annealing is at a higher BE (i.e. by
~0.48 eV). 149
Fig. 6.8: Frequency dependent conductance measurements for Al/LAO(22.5nm)/Si
capacitors (a) before and (b) after 800
o
C annealing for a series of applied gate bias Vg,
showing the spread of D
it
over the upper half of the Si bandgap. The inset shows the
corresponding high frequency C-V plots (100 kHz) and it is observed that the stretch-
out of the slope after annealing corresponds to the increase in D
it
. 153
Fig. 6.9: Gate current density vs. gate voltage (J
g
- V
g
) measurements of
LAO(12.5nm)/Si and LAO(12nm)/Y/Si structures before and after 800
o
C annealing.
The corresponding EOTs before and after annealing are 5.70 nm and 6.10 nm
respectively for LAO/Si, and 4.80 nm and 5.50 nm respectively for LAO/Y/Si 154
Fig. 6.10: A log-log J
g
-V
g
plot for the different capacitors fabricated. 155
Fig. 6.11: Plots of fitted (a) Schottky (SC) emission and (b) Poole-Frenkel (PF)
emission equations for the different capacitors with the extracted parameters, i.e.
dielectric constants (ε
r
), barrier height (Φ
B
), which is the CBO for substrate injection,
and trap energies (Φ
t
). 156
Fig. 7.1: Attenuation plots of Ln [I
x
/I
x,
∞
] versus deposited thickness, where x
represents (a) Ge 2p or (b) Ge 3d signal. The mean free path (MFP) for Ge 2p and Ge
xviii
List of Figures
3d can be calculated from the slope of the plots to be 8.56 and 18.5 Å, respectively.
162
Fig. 7.2: In situ XPS spectra for different Y thicknesses (i.e., 0 Å (Clean), 0.96 Å,
1.92 Å, 3.84 Å, 5.76 Å, 9.60 Å, 14.4 Å, 19.2 Å, 24.0 Å and 28.8 Å) on p-type Ge
showing (a) Ge 3d, (b) Ge 2p
3/2
and (c) Y 3d orbitals, and on n-type Ge showing (d)
Ge 3d orbitals. The peaks have been normalized while the indicated thickness is on a
cumulative basis. 163
Fig. 7.3: Ge 3d and 2p core level shifts due to (a) Y and (b) Hf metal adatom induced
band bending effects at different deposition thickness. 164
Fig. 7.4: Fitted (a) Ge 3d and (b) Ge 2p
3/2
XPS spectra after 5.76 Å of Y on p-type Ge.
The fitted Y-Ge contribution is ~1 eV lower than the Ge 3d substrate peak (which is
fitted using two spin-orbits) while the Y-Ge peak is fitted using a single peak. 166
Fig. 7.5: Plot of the intensity ratio between the fitted yttrium germanide (YGe) and the
substrate (Ge-Ge) component against the thickness of the Y film deposited. The
dotted line shows the calculated intensity ratios using the derived growth profile of
the actual Y thickness (t
YGE
) versus the total deposited thickness in the inset. 167
Fig. 7.6: In situ UPS spectrum of a 12-nm thick (a) bulk yttrium film and (b) bulk
hafnium film on p-type Ge. The inset shows the presence of the Fermi edge at close to
zero BE 170
Fig. 7.7: Ge 3d XPS spectrum showing the interfacial chemistry of the samples
deposited by (a) sputtering of 5 nm Y
2
O
3
; evaporation of 3 nm of Y followed by (b)
molecular oxygen oxidation (3 nm Y + O
2
) and (c) oxygen plasma oxidation (3 nm Y
+ OP); (d) evaporation of 1 nm Y followed by oxygen plasma (1 nm Y + OP) and (e)
evaporation of 0.5 nm Y followed by molecular oxygen oxidation (0.5 nm Y + O
2
).
172
Fig. 7.8: (a) XPS Ge 3d spectrum of layers grown using a layer-by-layer method at
different intervals. The Ge 3d spectrums (black lines) show the deposition of 0.5, 1,
1.5 and 3 nm of Y at each indicated layers. Corresponding oxidation at each thickness
xix
List of Figures
using 5 min molecular oxygen oxidation, O
2
(blue line) and 20 min oxygen plasma
oxidation, OP (red line) is shown together with respective deposition layers as
indicated in the plot. Cross-sectional HRTEM image of a layer-by-layer grown Y
2
O
3
on Ge is shown in (b). 174
Fig. 7.9: Ge 3d XPS spectrum before and after a 20 min oxygen plasma (OP) for a
3nm evaporation of Y on (a) Ge substrate without prior degas (with native oxide and
surface carbon contaminants) and (b) Ge substrate with thin GeO
2
formed by in situ
oxidation using oxygen plasma (OP). 176
1
Introduction and Motivation
1. Introduction and Motivation
1.1. MOS scaling: problems and solutions
Silicon (Si) - based microelectronic devices, in particular complementary metal-
oxide-semiconductor (CMOS) transistors, have fundamentally revolutionized the
technology of mankind without which many inventions such as the internet and
computer would not have existed. In the past few decades, the demand for faster
and more powerful processors has skyrocketed with the world-wide proliferation
of consumer electronic products such as smart phones, and touch screen tablets.
This advancement is achieved through the aggressive scaling of transistor feature
sizes, i.e. reduction of channel length accompanied with changes in key device
dimensions.
1
This scaling leads to device improvements such as higher speed,
lower power dissipation and higher packing density.
2
In 1965, Gordon Moore
predicted that the number of components on a chip would quadruple every three
years.
3
So far, this has dictated the trend of growth in the semiconductor industry.
In 1971, the first 4-bit central processing unit (CPU) released by Intel Corporation
only had 2,300 transistors.
4
Across a span of 40 years, the transistor count has
reached an alarming number of 2 billion and this scaling is showing no signs of
stopping.
Sustaining of this aggressive scaling trend however, requires tremendous efforts.
Some of the crucial aspects include lithography, control of threshold voltage,
geometric design, and source drain engineering, etc. In recent years, the
downsizing of the devices has reached atomic scales whereby intrinsic properties
of existing materials have become the roadblock for further CMOS scaling. This
2
Introduction and Motivation
has led to the introduction of novel materials such as high mobility substrates,
copper interconnects, low dielectric constant inter-metal dielectrics, high dielectric
constant (high-k) gate dielectrics, metal gate electrodes, etc. This approach of
material engineering promises continued usage of the CMOS technology without
major overhauls of device fabrication and designs. This is highly desirable from
the manufacturing point of view given the intensive capital invested in the
equipment.
Leading the frontier of this miniaturization is the development of high dielectric
constant (high-k) materials since the gate oxide is the thinnest feature in a
MOSFET device. At the 90-nm technology node, the silicon dioxide (SiO
2
)
thickness is already being shrunk to a mere 1.2 nm (only about four atomic
layers).
5
This presents two fundamental problems which hinders the continual use
of SiO
2
as the gate oxide. First, the gate tunneling leakage current becomes
unacceptably large, thus affecting the standby power dissipation.
6
This is largely
due to a quantum mechanical tunneling effect which states that the tunneling
probability is expected to increase exponentially as the oxide thickness decreases
(i.e., based on the Wentzel-Kraners-Brillouin (WKB) formulation).
7
Second, the
device reliability is greatly compromised. When the gate oxide thickness is too
thin, the critical density of defects (at the Si/SiO
2
interface) required to trigger
breakdown is reduced significantly, leading to device failure.
8
It is also
worthwhile to note that the fundamental physical thickness limit of SiO
2
is 7 Å,
below which its full bandgap is not formed.
9
3
Introduction and Motivation
The metal-oxide-semiconductor structure can be electrically modeled as a parallel
plate capacitor shown in Eq. (1.1) as follows:
0ox 0
C(kA)t (3.9A)/EOT,
=
ε=ε
(1.1)
where A is the capacitor area, k is the relative dielectric constant, ε
0
is the
permittivity of free space, and t
ox
is the gate oxide thickness. Since increasing the
device area contradicts the general trend in scaling, the only way an equivalent
capacitance (to induce sufficient inversion charges) can be achieved with a thicker
oxide is to make use of a material with higher dielectric constant (see Eq. (1.1)).
In other words, the equivalent oxide thickness (EOT) of the high-k dielectric,
which is a hypothetical thickness assuming that the high-k material has a dielectric
constant of SiO
2
(3.9), is always smaller than its actual physical thickness (t
ox
).
This ensures that the gate oxide scaling trend can be prolonged.
1.2. Issues pertinent to the choice of high-k dielectrics
A major component of the success behind the CMOS technology lies in the
excellent compatibility of SiO
2
with Si. SiO
2
has a large band gap (~ 9 eV), hence
large band offsets with Si and also a high breakdown field, of the order of 13
MVcm
-1
.
10
Moreover, SiO
2
possesses good thermal and chemical stability and is
able to withstand high temperature annealing steps (up to 1000ºC) in the
fabrication of transistors. If grown properly, SiO
2
is also able to form a high
quality interface with Si giving rise to a low density of interface defects.
The task of replacing the SiO
2
gate dielectric with high-k dielectrics is not
straightforward and requires careful considerations.
11
Apart from having high
4
Introduction and Motivation
dielectric constant, the high-k material must be able to meet a set of other
requirements, namely (1) good thermodynamic stability on Si (or Ge), (2) low
density of intrinsic defects at the interface and bulk, (3) sufficiently large energy
bandgap in order to provide a sufficiently high energy barrier to reduce leakage
current, and (4) be compatible with CMOS processing, i.e. able to sustain high
thermal budget.
Based on the requirement of being thermodynamically stable on Si, the remaining
high-k material candidates belong to either transition or rare earth metal oxides.
12
Unfortunately, these existing high-k dielectrics do not fare as well as the
traditional SiO
2
in terms of the above requirements, except for the dielectric
constant. This may very well be attributed to the difference in the chemical
bonding nature of the oxides.
13
The delocalized d electrons involved in high-k
oxides result in a more rigid structure that is more prone to structural defects, such
as oxygen vacancies or interstitials. These d electrons are also the reason behind
the smaller bandgap observed in high-k oxides.
14
This is as opposed to the sp-type
Si-O bonds which are less rigid and give rise to large splitting of anti-bonding and
bonding states (larger bandgap).
1.3. Importance of studying the high-k/semiconductor interface
The high-k/semiconductor interface is particularly important for advanced
technology nodes due to the various issues highlighted in the schematic shown in
Fig. 1.1. These issues are concerning the formation of interface layer, interface
trap charges, and interface dipoles which is discussed in more detail in the
paragraphs below.
5
Introduction and Motivation
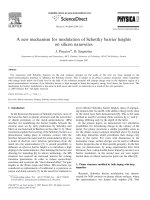
Fig. 1.1: Schematic illustrating the various issues involved at the high-k/semiconductor
interface that are crucial to device performance. Note that k
IL
and k
HK
represent the
dielectric constants for both the interface layer and high-k dielectric respectively.
First and foremost, any formation of an interfacial layer (IL) will play an
increasingly dominant role in the overall electrical performance due to the ultra-
thin dimension of the gate dielectric as a result of aggressive scaling. One
immediate impact is the increase of the equivalent oxide thickness (EOT). This is
because IL formation entails the incorporation of underlying semiconductor atoms
which will bring the overall dielectric constant down. As such, many have
espoused the idea of using a zero interfacial layer (ZIL) structure for future
technology nodes to meet the stringent requirement for EOT scaling.
15
This is
however not an easy task, as seen from literature, because of thermodynamics and
chemical kinetics involved in the deposition process.
16
Furthermore, crucial electrical parameters such as interface trap density, fixed
charge and leakage current are dependent on the quality of the
high-k/semiconductor interface. Interface traps degrade the carrier mobility and
drive current through Coulomb scattering and electron trapping.
17
Gate stacks