Báo cáo khoa học: Fluorescence quenching and kinetic studies of conformational changes induced by DNA and cAMP binding to cAMP receptor protein from Escherichia coli ppt
Bạn đang xem bản rút gọn của tài liệu. Xem và tải ngay bản đầy đủ của tài liệu tại đây (413.59 KB, 14 trang )
Fluorescence quenching and kinetic studies of
conformational changes induced by DNA and cAMP
binding to cAMP receptor protein from Escherichia coli
Magdalena Tworzydło, Agnieszka Polit, Jan Mikołajczak and Zygmunt Wasylewski
Department of Physical Biochemistry, Faculty of Biotechnology, Jagiellonian University, Krako
´
w, Poland
Cyclic AMP receptor protein (CRP), allosterically
activated by cAMP, is a multipotent transcription
regulating protein engaged in the control of more
then 100 genes in Escherichia coli [1,2]. The protein is
a homodimer. Each subunit consists of 209 amino
acid residues folded into two distinct domains. The
N-terminal domain, composed of amino acid residues
1–133, contains a cAMP-binding pocket that binds
the cAMP in the anti conformation. The N-terminal
domain is coupled with the C-terminal domain by a
flexible hinge region made up of residues 134–138.
The smaller, C-terminal domain possesses amino acid
residues 139–209 and contains the helix-turn-helix
(HTH) motif. The crystal structure of the CRP–DNA
complex revealed the existence of a second site
between the hinge and the turn of the HTH where
cAMP is bound in the syn conformation [3]. Upon
cAMP binding in the anti conformation, CRP under-
goes allosteric conformational changes that enable the
protein to recognize specific DNA sequences [2,4].
Therefore, it has been suggested that CRP can exist
in solution in at least three conformational states,
Keywords
cAMP receptor protein (CRP); CRP–DNA
interactions; fluorescence quenching; FRET,
fast kinetics
Correspondence
Z. Wasylewski, Department of Physical
Biochemistry, Faculty of Biotechnology,
Jagiellonian University, ul. Gronostajowa 7,
30–387 Krako
´
w, Poland
Fax: +48 12 66 46 902
Tel: +48 12 66 46 122
E-mail:
(Received 29 July 2004, revised 22
November 2004, accepted 21 December
2004)
doi:10.1111/j.1742-4658.2005.04540.x
Cyclic AMP receptor protein (CRP) regulates the expression of more then
100 genes in Escherichia coli. It is known that the allosteric activation of
CRP by cAMP involves a long-distance signal transmission from the N-ter-
minal cAMP-binding domain to the C-terminal domain of CRP responsible
for the interactions with specific sequences of DNA. In this report we have
used a CRP mutant containing a single Trp13 located in the N-terminal
domain of the protein. We applied the iodide and acrylamide fluorescence
quenching method in order to study how different DNA sequences and
cAMP binding induce the conformational changes in the CRP molecule.
The results presented provide evidence for the occurrence of a long-
distance conformational signal transduction within the protein from the
C-terminal DNA-binding domain to the N-terminal domain of CRP. This
conformational signal transmission depends on the promoter sequence. We
also used the stopped-flow and Fo
¨
rster resonance energy transfer between
labeled Cys178 of CRP and fluorescently labeled DNA sequences to study
the kinetics of DNA–CRP interactions. The results thus obtained lead to
the conclusion that CRP can exist in several conformational states and that
their distribution is affected by binding of both the cAMP and of specific
DNA sequences.
Abbreviations
CRP, cyclic AMP receptor protein; CRP–AEDANS, CRP covalently labeled with 1,5-I-AEDANS attached to Cys178; apo–CRP, unligated CRP;
FRET, Fo
¨
rster resonance energy transfer; FQRS, fluorescence-quenching-resolved spectra; galF, a fragment of DNA sequence recognized by
CRP in the galP1 promoter covalently labeled with fluorescein at the 5¢ end; HTH, helix-turn-helix; lacF, a fragment of DNA sequence
recognized by CRP in the lacP1 promoter covalently labeled with fluorescein at the 5¢ end; ICAPF, consensus DNA sequence recognized by
CRP covalently labeled with fluorescein at the 5¢-end; wt, wild type.
FEBS Journal 272 (2005) 1103–1116 ª 2005 FEBS 1103
i.e. free CRP, CRP–(cAMP)
2
and CRP–(cAMP)
4
.In
the presence of % 100 lm cAMP, the protein becomes
activated by the formation of a CRP–(cAMP)
2
com-
plex and it is then able to recognize and bind specific
DNA sequences and stimulate transcription [5].
Unfortunately, the crystal structure of unligated CRP
has not yet been established, which makes a simple
comparison between the two forms of the protein
impossible. However, it has been suggested from the
crystal structure studies that the cAMP-induced allo-
steric transition may involve a change in relative ori-
entation of the subunits and a change in orientation
of the DNA-binding domain relative to the cAMP-
binding domain [6]. Indeed, our Fo
¨
rster resonance
energy transfer (FRET) measurements show that the
binding of anticAMP in the CRP–(cAMP)
2
complex
results in a movement of the C-terminal domain of
CRP by % 8A
˚
towards the N-terminal domain [7].
As in the CRP–(cAMP)
2
complex the anticAMP is
buried within the N-terminal domain of the protein
located at least 10 A
˚
away from the hinge region,
the allosteric activation of CRP must involve a long-
distance signal transmission within the protein. Recent
studies [8] suggest that this long-distance communica-
tion between the two CRP domains and subunits
involves the Asp138 residue, located in the CRP hinge
region, which represents part of the signal transduc-
tion network.
Depending on the location of the CRP-binding site
on the DNA promoter and the mechanism of CRP–
RNA polymerase interaction, the simple CRP-depend-
ent promoters are divided into two classes [1]. Class I
promoters, such as lacP1, are characterized by the
location of the CRP-binding site centred at position
)61.5. In the case of class II promoters, such as galP1,
the CRP-binding site is located at position )41.5. The
activation of the transcription process requires the
interaction between the RNA polymerase a subunit
C-terminal domain and the CRP-activating region,
AR1 [9]. The class II promoter requires the interaction
with both the AR1 activation region of CRP and
the activation region of AR2, located in the CRP
N-terminal domain [10].
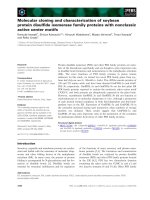
Each CRP subunit contains two tryptophan residues
at positions 13 and 85 (Fig. 1), both located in the
protein’s N-terminal domain [11]. Trp85 is located
near the anticAMP-binding site and Trp13 is situated
close to the activation region, AR2, of CRP. Using
single tryptophan-containing mutants, we have recently
shown that the binding of cAMP in the CRP–(cAMP)
2
complex alters the surroundings of Trp13, whereas
its binding in the CRP–(cAMP)
4
complex leads to
changes in the Trp85 microenvironment [7]. We
present evidence that CRP binding to the different
DNA sequences leads to long-distance conformational
signal transmission from the C-terminal domain to the
N-terminal domain of the protein. Furthermore, we
present the kinetics of DNA–CRP interactions, as
determined by using FRET measurements, between
labeled Cys178 of CRP and fluorescently labeled DNA
sequences (Fig. 1).
The mechanism of the cAMP-induced long-distance
structural communication within the CRP remains an
important part of our understanding of the mechan-
ism underlying the transcription-regulating activity
of this protein. However, it is an open question as to
how the binding of the CRP–(cAMP)
2
complex to
different specific promoter DNA sequences can trigger
the conformational changes in the protein that may
consequently lead to changes in the interactions
between the activator and other participants of the
transcription machinery. Does it involve a conforma-
tional signal transmission from the C-terminal domain
of CRP through the hinge region to the N-terminal
domain? We believe that elucidation of the signal
transduction pathway from the different DNA
sequences to the activation regions in CRP may pro-
vide a structural paradigm for understanding the tran-
scription activation process. Therefore, we suggest
that the CRP does not act by the simple ‘recruitment’
mechanism in transcription machinery, as has been
suggested recently [12], but behaves as a very dynamic
entity.
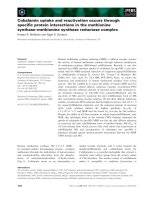
Fig. 1. Structure of the cyclic AMP receptor protein (CRP) dimer
complexed with DNA. The locations of tryptophan residues are
marked in red, the location of the Cys178 residue is indicated in
yellow and fluorescein is shown in green. The figure was generated
by
WEBLAB VIEWERPRO (version 3.7) using atomic coordinates for the
cAMP–CRP–DNA complex [44]. The coordinates were obtained
from the Brookhaven Protein Data Bank (accession code 1CGP).
CRP conformational changes induced by DNA and cAMP M. Tworzydło et al.
1104 FEBS Journal 272 (2005) 1103–1116 ª 2005 FEBS
Results
Steady-state fluorescence quenching studies
The fluorescence quenching studies with iodide and
acrylamide were performed in 20 mm Tris⁄ HCl buffer,
pH 7.9, containing 0.1 m NaCl and 0.1 mm EDTA. In
measurements involving the protein–ligand complex,
the final concentration of cAMP was 100 lm. In all
cases, the excitation wavelength was 295 nm, so it can
be assumed that the fluorescence emission observed
was only from tryptophan residues.
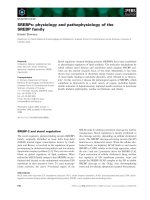
A typical Stern–Volmer plot of fluorescence quench-
ing of the single tryptophan of the CRPW85A mutant
is shown in Fig. 2. The downward curvature of the
plot indicates the presence of two or more emitting
components which differ in a Stern–Volmer quenching
constant, K
SV
. The fluorescence quenching data were
analyzed according to Eqn (3), by using a nonlinear
least-squares procedure. The analysis was conducted
for all the quenching data, i.e. for about 40 different
emission spectra. Judging by the calculated v
2
value
and the residual distribution, the phenomenon can be
described by a two-component model in which one
component in the protein is more available for the
quencher and characterized by K
SV1
¼ 9.61 m
)1
and
an f
1
of % 0.55, while the other component is less
accessible to the iodide with K
SV2
¼ 1.69 m
)1
and
f
2
¼ 0.45. The best theoretical-fit line calculated for
the given emission wavelength is shown in Fig. 2A.
Similar results were obtained for the CRPW85A–
(cAMP)
2
complex. The Stern–Volmer plot also curved
down (data not shown). The binding of cAMP resulted
in a small increase of the K
SV1
value from 9.61 m
)1
to
10.08 m
)1
and the more visible increase of the K
SV2
value from 1.69 m
)1
to 2.85 m
)1
.
When acrylamide was used as a quencher, the
Stern–Volmer plots of CRPW85A and its complex
with cAMP showed a small upward curvature indica-
ting that a static quenching mechanism is involved
(Fig. 2B). For both species, the best fits were obtained
for a model in which one component is accessible to
the nonionic quencher. For CRPW85A, the acrylamide
Stern–Volmer constant is equal to 5.76 m
)1
, while for
the cAMP complex, K
SV
¼ 6.62 m
)1
, and the values of
a static quenching constant, V, are 0.84 m
)1
and
0.27 m
)1
, respectively. The fitting parameters for iodide
and acrylamide quenching are given in Table 1.
Figure 3 shows, for the first time, the spectra of
CRP, containing a single Trp13 residue, resolved into
components by using the fluorescence-quenching-
resolved spectra (FQRS) method, using iodide as a
quencher. The component characterized by a higher
Stern–Volmer constant (9.61 m
)1
) was found to exhibit
a maximum at 350 nm and to account for 55% of the
fluorescence emission. The second component, charac-
terized by the average K
SV
¼ 1.69 m
)1
, is responsible
for % 45% of the total emission and has a maximum
at 338 nm.
Fig. 2. (A) Typical Stern–Volmer plot for iodide quenching of
CRPW85A (
). The solid line represents the best fit with the fol-
lowing parameters: K
SV1
¼ 9.11 M
)1
, f
1
¼ 0.48, K
SV2
¼ 2.89 M
)1
,
f
2
¼ 0.40. (B) Typical Stern–Volmer plots for acrylamide quenching
of CRPW85A (
) and of CRPW85A–(cAMP)
2
(h). The solid lines
represent the best fits with the following parameters: CRPW85A,
K
SV
¼ 5.64 M
)1
, V ¼ 0.74 M
)1
, f ¼ 1; CRPW85A–(cAMP)
2
, K
SV
¼
6.45
M
)1
, V ¼ 0.22 M
)1
, f ¼ 1. The excitation was at 295 nm and
the emission at 340 nm.
M. Tworzydło et al. CRP conformational changes induced by DNA and cAMP
FEBS Journal 272 (2005) 1103–1116 ª 2005 FEBS 1105
FQRS spectra of CRPW85A with cAMP are repre-
sented in Fig. 4. The binding of the ligand results in a
blue shift of the total spectrum maximum from about
342 nm to 340 nm. The more quenchable component
exhibits a k
max
at 344 nm, whereas the maximum of
the less quenchable component remains unchanged at
338 nm. The maxima of the resolved spectra and their
relative intensities, measured as the areas under each
of the resolved spectra, are given in Table 1.
Analogous measurements were performed for CRP–
DNA complexes. Figure 5A,B shows typical Stern–
Volmer plots obtained for iodide and acrylamide
quenching of the CRPW85A mutant bound to ICAP,
lac and gal sequences.
For all three DNA fragments, the Stern–Volmer
plots of fluorescence quenching by iodide exhibit a
downward curvature, and the best fits were obtained
with a two-component model in which one component
is quenchable and the second remains inaccessible for
the quencher. In order to prove that the downward
curvature was not a result of the ionic strength chan-
ges when iodide was added, the titration of the
CRPW85A–DNA complexes with KCl was performed
and it did not lead to any substantial changes in
the fluorescence emission of the complexes. The high-
est Stern–Volmer constant, amounting to 7.45 m
)1
,
characterizes the CRPW85A–ICAP complex. For
CRPW85A–lac, the value of K
SV1
is 5.54 m
)1
, and for
CRPW85A–gal, the value of K
SV2
is 5.02 m
)1
. The
quenched components account for % 78–81% of the
total fluorescence emission.
When acrylamide was used for quenching, the
Stern–Volmer plots for two complexes of CRPW85A,
with ICAP and lac sequences, were found to be
linear so the model with one totally quenched com-
ponent was used for calculations. The dynamic
quenching constant values for these two species
were 6.35 and 6.15 m
)1
, respectively. Only for the
CRPW85A–gal complex did the upward curvature
appear, indicating the presence of static quenching,
characterized by the constant V ¼ 1.35 m
)1
. The K
SV
for the CRPW85A–gal complex was lower than for
the complexes with the ICAP and lac sequences and
equaled 5.53 m
)1
.
The total fluorescence emission of all three
CRPW85A–DNA complexes had maxima at the same
wavelength as the CRPW85A–(cAMP)
2
complex
(Figs 6, 7 and 8), i.e. at 340 nm. The resolved spectra
which correspond to the unquenchable components
have maxima at around 338 nm, while the maxima of
quenchable components are located at around 344 nm.
The detailed parameters of the resolved spectra of the
CRPW85A–DNA complexes, with iodide used as a
quencher, are presented in Table 1.
Time-resolved fluorescence data
Fluorescence lifetime measurements of the CRPW85A
mutant and its complexes with cAMP and DNA were
conducted using an excitation wavelength equal to
295 nm. Phase and modulation were analyzed by using
single- and double-exponential decay models. The bet-
ter fits, i.e. of lower values of the reduced v
2
, were
obtained for a double-exponential model. The values
of mean fluorescence lifetimes, defined as s
m
¼ Sf
i
s,
are presented in Table 2.
Table 1. Fluorescence quenching parameters for CRPW85A, CRPW85A–(cAMP)
2
and CRPW85A–DNA complexes. Iodide and acrylamide
quenching studies were performed in Tris buffer, pH 7.9 at 20 °C. In the experiments with CRPW85A complexed to cAMP and DNA, the
concentration of cAMP was 100 l
M. Quenching data were fitted to either a one- or a two-component model (Eqn 1). The presented parame-
ters were obtained for the model characterized by minimum values of reduced v
2
. K
SV
and V are average values calculated for the wave-
length range between 330 and 370 nm. The error did not exceed 5%. FQRS, fluorescence-quenching-resolved spectra.
Species K
SV1
(M
)1
) K
SV2
(M
)1
) V (M
)1
) f
1
FQRS
k
maks1
(nm) k
maks2
(nm)
Iodide quenching
CRPW85A 9.61 1.69 – 0.55 350 338
CRPW85A–(cAMP)
2
10.08 2.85 – 0.57 344 338
CRPW85A–ICAP 7.45 0.00 – 0.80 345 338
CRPW85A–lac 5.54 0.00 – 0.78 346 340
CRPW85A–gal 5.02 0.00 – 0.81 343 337
Acrylamide quenching
CRPW85A 5.76 – 0.84 1.00 – –
CRPW85A–(cAMP)
2
6.62 – 0.27 1.00 – –
CRPW85A–ICAP 6.35 – – 1.00 – –
CRPW85A–lac 6.15 – – 1.00 – –
CRPW85A–gal 5.53 – 1.33 1.00 – –
CRP conformational changes induced by DNA and cAMP M. Tworzydło et al.
1106 FEBS Journal 272 (2005) 1103–1116 ª 2005 FEBS
Kinetics of DNA binding to CRP
A FRET has been used to study the kinetics of CRP–
DNA interactions. The fluorescence characteristics of
CRP-conjugated IAEDANS, with an excitation at
340 nm and a maximum emission at 480 nm, suggest
that it can be used as a donor fluorophore. Oligonucleo-
tides covalently labeled with fluorescein were used as
acceptors.
The application of the FRET method allowed us to
obtain more information about the binding process
between protein and DNA. One of the advantages is
the possibility of determining the kinetics of the associ-
ation by monitoring the time course of the FRET
effect. Using fluorescein-labeled DNA as the acceptor,
we observed a small increase in acceptor fluorescence
but a significant decrease in IAEDANS emission.
Quenching of the IAEDANS fluorescence intensities is
not solely governed by Fo
¨
rster nonradiative energy
transfer in the CRP–DNA complex, but also by the
DNA itself. The addition of unlabeled DNA to CRP–
AEDANS significantly decreased the fluorescence
intensities of the dye (data not shown) and therefore we
decided to use the acceptor fluorescence to monitor the
CRP–DNA interaction in the FRET kinetic measure-
ments. Mixing an IAEDANS-labeled CRP with a fluo-
rescein-labeled oligonucleotide resulted in an increase
of % 7% in the acceptor fluorescence at the donor exci-
tation wavelength, reaching a plateau at % 0.3 s.
For all DNA sequences and CRP concentrations,
the kinetic traces could be fitted well by a single-expo-
nential curve. The plots of the inverse time constant
(k
obs
) are linear (Fig. 9) and the values of k
off
and the
association-rate parameter, k
on
, listed in Table 3, were
determined as the intercept and the slope that are valid
for a single-step bimolecular association:
Fig. 4. Fluorescence-quenching-resolved spectra (FQRS) of
CRPW85A–(cAMP)
2
with excitation at 295 nm. Iodide was used as
a quencher. The upper panel represents a plot of Stern–Volmer
constants as a function of the emission wavelength. The lower
panel shows the FQRS: (
) the total emission spectrum with a
maximum at about 340 nm; (h ) the more quenchable component
with a maximum at % 344 nm, characterized by an average value of
K
SV1
¼ 10.08 M
)1
and a fraction f
1
¼ 0.57; ( ) the less quenchable
component with the maximum at % 338 nm, characterized by an
average value of K
SV2
¼ 2.85 M
)1
and a fraction f
2
¼ 0.43.
Fig. 3. Fluorescence-quenching-resolved spectra (FQRS) of
CRPW85A with excitation at 295 nm. Iodide was used as a quen-
cher. The upper panel represents a plot of Stern–Volmer constants
as a function of the emission wavelength. The lower panel shows
the FQRS spectra: (
) the total emission spectrum with a maxi-
mum at about 342 nm; (
) the more quenchable component with a
maximum at about 350 nm, characterized by an average value of
K
SV1
¼ 9.61 M
)1
and a fraction f
1
¼ 0.55; and ( ) the less quencha-
ble component with a maximum at about 338 nm, characterized by
an average value of K
SV2
¼ 1.69 M
)1
and a fraction f
2
¼ 0.45.
M. Tworzydło et al. CRP conformational changes induced by DNA and cAMP
FEBS Journal 272 (2005) 1103–1116 ª 2005 FEBS 1107
CRPÀðcAMPÞ
2
þ DNA À!
k
on
k
off
DNAÀCRPÀðcAMPÞ
2
and which
k
obs
¼ k
off
þ k
on
½CRPÀAEDANSð1Þ
with the total concentration used of IAEDANS
attached to CRP denoted as [CRP–AEDANS]. An
equilibrium binding constant can be calculated from
the ratio of the rate constants k
on
and k
off
as follows:
K
a
¼
k
on
k
off
ð2Þ
Association constants (K
a
) of CRP with the three
investigated sequences of DNA – lacF, galF and
ICAPF – are summarized in Table 3.
Discussion
The molecular mechanism of signal transduction
within CRP upon binding of the allosteric inductor to
CRP high-affinity binding sites involves a sequence
of protein conformational changes, which shift the
protein from a low-affinity nonspecific DNA-binding
protein to a state of the protein that binds DNA with
Fig. 5. (A) Typical Stern–Volmer plots for iodide quenching of
CRPW85A complexes with DNA. The solid lines represent the best
fits with the following parameters: (r) CRPW85A–ICAP, K
SV1
¼
6.57
M
)1
, f
1
¼ 0.80; (d) CRPW85A–lac, K
SV1
¼ 5.46 M
)1
, f
1
¼ 0.78;
and (,) CRPW85A–gal, K
SV1
¼ 4.63 M
)1
, f
1
¼ 0.81. (B) Typical
Stern–Volmer plots for acrylamide quenching of CRPW85A com-
plexes with DNA. The solid lines represent the best fits with the
following parameters: (e) CRPW85A–ICAP, K
SV
¼ 5.92 M
)1
, f ¼ 1;
(d) CRPW85A–lac, K
SV
¼ 5.74 M
)1
, f ¼ 1; (.) CRPW85A–gal,
K
SV
¼ 5.30 M
)1
, V ¼ 1.16 M
)1
, f ¼ 1. The excitation was at 295 nm
and the emission at 340 nm.
Fig. 6. Fluorescence-quenching-resolved spectra (FQRS) of
CRPW85A–ICAP with excitation at 295 nm. Iodide was used as a
quencher. The upper panel represents a plot of Stern–Volmer con-
stant as a function of the emission wavelength. The lower panel
shows the FQRS: (e) the total emission spectrum with maximum
at % 340 nm; (r) the quenchable component with a maximum at
% 345 nm, characterized by an average value of K
SV1
¼ 7.45 M
)1
and a fraction f
1
¼ 0.80; and ( ) the unquenchable component with
a maximum at %338 nm, characterized by an average value of
K
SV2
¼ 0.00 M
)1
and a fraction f
2
¼ 0.20.
CRP conformational changes induced by DNA and cAMP M. Tworzydło et al.
1108 FEBS Journal 272 (2005) 1103–1116 ª 2005 FEBS
high affinity and sequence specificity [2]. A variety of
biochemical and biophysical studies [13–16], including
our fast-kinetics studies [17,18], as well as steady-state
and time-resolved fluorescence [7,19] investigations,
have shown that the allosteric mechanism involves sub-
unit realignment and hinge reorientation between the
domains. Our previous FRET measurements have
shown that cAMP binding to the anti sites of CRP
shifts the average distance from the C-terminal domain
towards the N-terminal domain from 26.6 A
˚
in apo–
CRP to 18.7 A
˚
in the CRP–(cAMP)
2
complex [7]. The
details of the structural mechanism of CRP activation
by a cAMP have not been established because of the
lack of an X-ray structure for apo–CRP. However, it
may be expected that the binding of an allosteric
inductor, cAMP, as well as an interaction of the
protein with the specific DNA promoter sequences in
solution can lead to changes in the protein activation
regions, which in turn allows CRP to interact with the
a subunit of RNA polymerase. Recently [7] we have
suggested that cAMP binding to anti sites leads to an
increase in the structural dynamic motion around the
Trp13 residue, which is close to the activation region
AR2, responsible for the interaction of CRP with
RNA polymerase [10].
The tryptophan residue is widely used as an intrinsic
fluorescence probe to observe changes in protein struc-
ture [20]. High indole sensitivity to its microenviron-
ment in a protein moiety can be used to follow protein
structural changes, especially if the complicated emis-
sion of tryptophan residues may be resolved into com-
ponents. The difficulties in the interpretation of its
fluorescence emission result from the dynamics of pro-
tein structure and the multiple ground-state conformers,
each of which is characterized by distinct tryptophan
Fig. 7. Fluorescence-quenching-resolved spectra (FQRS) of
CRPW85A–lac with excitation at 295 nm. Iodide was used as a
quencher. The upper panel represents a plot of Stern–Volmer con-
stant as a function of the emission wavelength. The lower panel
shows the FQRS spectra: (s) the total emission spectrum with a
maximum at % 340 nm; (d) the quenchable component with a
maximum at % 346 nm, characterized by an average value of
K
SV1
¼ 5.54 M
)1
and a fraction f
1
¼ 0.78; and ( ) the unquen-
chable component with a maximum at % 340 nm, characterized by
an average value of K
SV2
¼ 0.00 M
)1
and a fraction f
2
¼ 0.22.
Fig. 8. Fluorescence-quenching-resolved spectra (FQRS) of
CRPW85A–gal with excitation at 295 nm. Iodide was used as a
quencher. The upper panel represents a plot of Stern–Volmer con-
stant as a function of the emission wavelength. The lower panel
shows the FQRS: (,) the total emission spectrum with a maximum
at about 340 nm; (.) the quenchable component with a maximum
at about 343 nm, characterized by an average value of K
SV1
¼
5.02
M
)1
and a fraction f
1
¼ 0.81; and ( ) the unquenchable com-
ponent with a maximum at about 337 nm, characterized by an aver-
age value of K
SV2
¼ 0.00 M
)1
and a fraction f
2
¼ 0.19.
M. Tworzydło et al. CRP conformational changes induced by DNA and cAMP
FEBS Journal 272 (2005) 1103–1116 ª 2005 FEBS 1109
residue microenvironments [20]. To resolve the fluores-
cence emission spectra into components in a protein
containing multiple tryptophan residues, advanced
techniques for analyzing fluorescence decay emission
may be used [20]. Under steady-state conditions, the
quenching processes may be analyzed by the external
quenchers by using the FQRS method [21,22]. Quench-
ing experiments are especially useful in studying the
changes in the conformation of proteins that may be
induced by ligand binding. If the studied protein pos-
sesses several tryptophan residues, then the interpret-
ation of a change in the quenchability is more difficult.
However, site-directed mutagenesis may be used to
obtain a single tryptophan-containing mutant protein,
which will allow for a more straightforward interpret-
ation of fluorescence quenching data.
In this study, we used site-directed mutagenesis to
obtain the CRPW85A mutant and used the FQRS
method to observe conformational changes in the pro-
tein upon binding of cAMP and fragments of DNA
possessing specific sequences. Each CRP wild-type
(CRPwt) subunit contains two tryptophan residues at
positions 13 and 85, both located in the N-terminal
domain of the protein [11,23]. Our previous fluores-
cence quenching investigations [24] of CRPwt have
shown that in apo–CRP, % 80% of the tryptophan
fluorescence emission can be attributed to Trp13 and
20% of the fluorescence emission originates from
Trp85. Our recently presented data concerning CRP
mutants containing a single Trp13 or Trp85 residue
indicate that binding of cAMP to anti sites in the
CRP–(cAMP)
2
complex leads to changes in the Trp13
microenvironment, whereas its binding to syn sites in
the CRP–(cAMP)
4
complex alters the surroundings of
Trp85 [7].
The results presented in this report provide further
evidence that binding of cAMP to the anti site of CRP
induces local structural changes in the vicinity of
Table 2. Fluorescence lifetimes and bimolecular quenching constants values for CRPW85A, CRPW85A–(cAMP)
2
and CRPW85A–DNA com-
plexes. Experiments were performed at 20 °C in Tris buffer, pH 7.9. In the experiments with CRPW85A complexed to cAMP and DNA, the
concentration of cAMP was 100 l
M. Excitation was at 295 nm and emission through a cut-off filter. The error did not exceed 5%.
Species
s
1
(ns) f
1
s
2
(ns)
s
m
(ns)
Iodide
quenching Acrylamide quenching
k
q1
(M
)1
Æs
)1
)
x10
)1
k
q2
(M
)1
Æs
)1
)
x10
)1
k
q1
(M
)1
Æs
)1
)
x10
)1
CRPW85A 3.09 0.69 0.58 2.31 4.16 0.73 2.49
CRPW85A–(cAMP)
2
2.99 0.65 0.55 2.14 4.67 1.23 3.09
CRPW85A–ICAP 2.54 0.59 0.29 1.62 4.60 – 3.92
CRPW85A–lac 4.23 0.57 0.62 2.68 2.07 – 2.29
CRPW85A–gal 3.93 0.51 0.62 2.31 2.17 – 3.39
Fig. 9. Kinetics of binding between IAEDANS-labeled CRP and fluo-
rescein-labeled DNA, as measured by stopped-flow fluorymetry of
the Fo
¨
rster resonance energy transfer (FRET). Measurements were
performed at 20 °C, in buffer B, pH 8.0, with a DNA concentration
of 0.2 l
M:(d) lacF;(,) galF;(r) ICAPF. Excitation was at 340 nm
and emission > 500 nm.
Table 3. Kinetic and thermodynamic parameters describing the
binding of lacF, galF and ICAPF to the wild-type cyclic AMP recep-
tor protein (CRPwt). The values are derived from experiments con-
ducted at 20 °C, in 50 m
M Tris ⁄ HCl buffer, containing 100 mM KCl,
1m
M EDTA, pH 8.0, in the presence of 200 lM cAMP. Kinetic and
thermodynamic parameters are defined as detailed in the Experi-
mental procedures. The error is the SD of fitted parameters.
Complex k
off
(s
)1
) k
on
(s
)1
ÆM
)1
) · 10
6
K
a
(M
)1
) · 10
5
CRPwt–ICAPF 5.8 ± 0.6 3.4 ± 0.2 5.9 ± 0.9
CRPwt–lacF 8.5 ± 0.9 1.1 ± 0.2 1.2 ± 0.3
CRPwt–galF 5.1 ± 0.9 2.4 ± 0.2 4.7 ± 0.9
CRP conformational changes induced by DNA and cAMP M. Tworzydło et al.
1110 FEBS Journal 272 (2005) 1103–1116 ª 2005 FEBS
Trp13. Our fluorescence quenching measurements of
apo–CRPW85A with iodide demonstrate that the
steady-state fluorescence spectra of Trp13 can be
resolved into two components by using the FQRS
method. This result clearly shows that CRP exists in
two distinct conformational states, each of which is
characterized by a different microenvironment of
Trp13. One of these states is characterized by its own
fluorescence emission spectra with a maximum at
350 nm and the second state is characterized by a
maximum emission spectrum at 338 nm. These two
forms of the protein account for 55% and 45% of the
total fluorescence emission, respectively. In contrast to
the Trp13 residue, the tryptophan located at position
85 is characterized by one distinct fluorescence spec-
trum (data not shown). The conformational state of
apo–CRP, which possesses a maximum of the fluores-
cence emission spectrum at 350 nm, can be character-
ized by a Trp13 Stern–Volmer quenching constant,
K
SV
¼ 9.6 m
)1
. If the average lifetime of Trp13 is
assumed to be 2.3 ns, then the bimolecular rate-
quenching constant, k
q
, can be calculated as
4.16 · 10
9
m
)1
Æs
)1
. This value is typical of the trypto-
phan residues in proteins exposed to a solvent [25].
The second conformational state of CRP can be char-
acterized by a relatively bluer emission with the maxi-
mum at 338 nm. In this conformational state of CRP,
the Trp13 residue is much less accessible to the iodide
quencher, as can be judged by a bimolecular rate
quenching constant, k
q
¼ 0.73 · 10
9
m
)1
Æs
)1
. These
two conformational states of CRP are not distinguish-
able by acrylamide (another quencher used in this
study). The acrylamide bimolecular rate quenching
constant, k
q
, equaling 2.49 · 10
9
m
)1
Æs
)1
, is almost half
that of the iodide rate-quenching constant. It has been
well documented that nonionic acrylamide can penet-
rate into the matrix of globular protein by diffusion,
which is facilitated by small-amplitude fluctuations in
the protein structure [25,26]. The process of quenching
the fluorescence of Trp residues in protein by acryl-
amide is more effective than by using the iodide ion
[25,26].
Resolving the component spectra of the Trp13 resi-
due of CRPW85A by using the FQRS method and
fluorescence lifetime measurements enabled us to com-
pare the fractional contributions of the fluorescence of
the red and blue components from the solute quench-
ing experiments by using the fractional contributions
of the short and long lifetimes of the Trp13 residue
obtained by lifetime measurements. A comparison of
the fractional contribution values presented in Tables 1
and 2 shows a significant discrepancy, which suggests
that the two Trp13 residues present in the CRPW85A
homodimer do not fluoresce independently and that
there is an energy transfer between them. A similar
observation has been drawn from the resolved fluores-
cence lifetime and solute quenching measurements per-
formed for several two-tryptophan-containing proteins
[27]. It may also be supposed that the fluorescence
decay of the Trp13 residue is more complex than that
described by a double-exponential decay, but we have
had little success in trying to resolve the fluorescence
to more components on our apparatus. As a result,
when we calculated the bimolecular rate quenching
constants, k
q
, we obtained values of the average Trp13
lifetime instead of the values of lifetimes of the
resolved components.
Binding of cAMP to anticAMP-binding sites leads
to significant changes in the fluorescing properties of
Trp13 of CRP–(cAMP)
2
, including changes in the
maximum fluorescence emission of the component
more quenchanable by iodide, as well as the increase
in bimolecular rate-quenching constants, k
q
, for iodide
and acrylamide (Tables 1 and 2). These results provide
further evidence for changes in the protein dynamics
induced by cAMP binding to the anti sites of CRP in
the CRP–(cAMP)
2
complex, in the surroundings of
Trp13. As the distance between the Trp13 residue and
the anticAMP molecule, both located in the N-terminal
domain in the CRP–(cAMP)
2
complex, is % 25.5 A
˚
[6],
the observed changes in Trp13 fluorescence quenching
by iodide and acrylamide result from the transduction
of the conformational changes in the protein moiety
and increase the dynamic motion around the Trp13
residue. This observation is in congruence with our
previous time-resolved anisotropy fluorescence meas-
urements of CRP, which show that cAMP binding to
the protein leads to an increase in the structural
dynamic motion around Trp13 [7]. As the Trp13 resi-
due is close to the activation region of CRP, AR2,
which is responsible for the interaction of the protein
with the a subunit of RNA polymerase, it may be
argued that the changes in the CRP dynamics in this
molecule region can play an important role in signal
transmission in the protein. Similarly, it has been
shown that the Trp13 residue in CRP is directly
engaged in the formation of the CRP complex with
another gene-regulatory protein, such as CytR, in the
CRP–CytR–DNA complex [28].
It is well established that the CRP allosteric activa-
tion involves conformational changes that are trans-
mitted from the N-terminal domain to the C-terminal
domain of the protein and, in consequence, enable
CRP to recognize the specific DNA sequences [2,4,11].
The results presented in this work provide evi-
dence for conformational signal transduction in the
M. Tworzydło et al. CRP conformational changes induced by DNA and cAMP
FEBS Journal 272 (2005) 1103–1116 ª 2005 FEBS 1111
CRP–(cAMP)
2
complex after binding specific DNA,
which occurs from the C-terminal domain to the
N-terminal domain of the protein. We have shown this
by using the Trp13-containing mutant of CRP as well
as the iodide and acrylamide fluorescence quenching
method in order to follow the influence of DNA bind-
ing on the conformational changes in its microenviron-
ment. We have used various DNA sequences: lac, gal
and ICAP. The synthetic artificial ICAP DNA posses-
ses a symmetrical sequence, which binds with high
affinity to the CRP HTH motifs, and the lac and gal
DNA sequences represent the CRP-binding sites from
class I and class II CRP-dependent promoters, respect-
ively [1]. Our iodide fluorescence-quenching measure-
ments of DNA–CRP complexes show that CRP still
exists in two different conformational states, but they
significantly differ in Trp13 microenvironments which
determine the Trp13 fluorescing properties. These dif-
ferences do not result from an increase in the ionic
strength of the solution upon titration of the sample
by KI, because the titration performed with KCl up to
a concentration similar to that of KI did not cause
any change in fluorescence of the complexes (data not
shown). The best fits for all the tested DNA sequences,
as judged by reduced v
2
values as well as residual dis-
tribution, have been obtained for two CRP states: one
with an iodide-quenchable and the second with an
iodide-unquenchable Trp13 residue. Binding DNA
sequences to CRP causes only a small change in the
maximum of the two resolved fluorescence emission
spectra, but shows that the iodide-quenchable compo-
nents account for % 75% of the total emission of
Trp13, in comparison to % 55% in the CRP–(cAMP)
2
complex (Table 1). As the binding of the tested DNA
sequences also leads to changes in the average fluores-
cence lifetime of Trp13, it may be expected that the
observed changes result from both the static and
dynamic processes that occur in the microenviron-
ments of this residue. Thr10, Asp109 and His17, which
are located within a distance up to 5 A
˚
[29] are the
most probable candidates as quenching residues of
CRP, in the vicinity of Trp13. The accessibility for
iodide as well as acrylamide, expressed by k
q
values
(Table 2), differs for the three studied DNA sequences
and clearly shows that binding of the particular DNA
to CRP causes different local changes in Trp13 residue
exposition. As this residue is located close to the acti-
vation region, AR2, which is responsible for the inter-
action with the RNA polymerase, it is tempting to
suggest that the binding of CRP to the DNA promoter
in solution involves a further conformational signal
transduction from the C-terminal domain to the N-ter-
minal domain of CRP, and the magnitude of this
conformational transduction solely depends on the
promoter DNA sequence responsible for this inter-
action. This suggestion is in agreement with small
angle neutron scattering measurements of the CRP–
DNA complex, which indicate that this structural
change in the N-terminal domain of the protein occurs
upon binding of DNA to the C-terminal domain of
CRP [30]. Our fluorescence studies of CRP–DNA
interactions presented here also agree with the results
of Baichoo & Heyduk [31], which were obtained by
protein footprinting techniques. These authors, using
chemical proteases of different charge, size and hydro-
phobicity, suggested that the binding of DNA in solu-
tion induces conformational changes in the N-terminal
domain of CRP, close to the activating region, AR2.
Our fast-kinetics study presented here has also
shown that the DNA–CRP interactions depend on the
sequence of the 26 bp DNA fragments. The bimole-
cular rate constant values of 3.4 · 10
6
m
)1
Æs
)1
,
1.1 · 10
6
m
)1
Æs
)1
and 2.4 · 10
6
m
)1
Æs
)1
, determined for
ICAP, lac and gal, respectively, are very similar to the
values of rate constants calculated for the interaction
of DNA with other proteins [32–34]. However, the
monomolecular dissociation rate constants determined
for the CRP–ICAP, CRP–lac and CRP–gal complexes,
of 5.8 s
)1
, 8.5 s
)1
and 5.1 s
)1
, respectively, are signifi-
cantly higher than the range between 10
)3
and 10
)2
s
)1
that has been found for other proteins which interact
with DNA [32–34]. The observed differences in the dis-
sociation rate constants may result from the fast
association of CRP with DNA, which leads to forma-
tion of the low-affinity CRP–DNA complex. This is
followed by the slow process of conformational chan-
ges in the C-terminal domains of CRP, which permit
formation of the high-affinity complex. As the kinetics
of CRP–DNA interactions have been detected by
determining the resonance energy transfer between
fluorescently labeled CRP and DNA, we have been
able to observe only the first step of the association
process without detecting any possible consecutive
reactions. However, we have observed the fluorescence
intensity changes of CRP–AEDANS upon the binding
of DNA sequences, which result from the conforma-
tional changes in the C-terminal domain of the pro-
tein. The values of CRP–DNA association equilibrium
constants, K
a
, calculated from the rate constants pre-
sented in Table 3, are equal to 5.9 · 10
5
m
)1
,
1.2 · 10
5
m
)1
and 4.7 · 10
5
m
)1
for ICAP, lac and gal,
respectively. These values are slightly lower than the
association constants of 4.0 · 10
5
m
)1
and 11.1 ·
10
5
m
)1
that were determined by isothermal titration
calorimetry for lac and gal, respectively [35]. The
26 bp long DNA sequences – lac, gal and ICAP – have
CRP conformational changes induced by DNA and cAMP M. Tworzydło et al.
1112 FEBS Journal 272 (2005) 1103–1116 ª 2005 FEBS
almost all the DNA determinants required for the
maximum affinity for CRP–DNA interactions [36].
The sequence ICAP is palindromic and this may be
responsible for the fact that higher values of associ-
ation equilibrium constant were determined for ICAP
than for gal or lac sequences. Recently, it has been
suggested that the geometry of the CRP–DNA com-
plex plays a major role in the molecular mechanism of
gene transcription activation [37]. The FRET studies
of CRP–DNA interactions [38] have shown that the
lacP1 promoter bends symmetrically upon binding to
CRP, as opposed to the galP1 promoter, which bends
asymmetrically upon binding CRP. Therefore, it may
be expected that the differences in rate constants k
on
and k
off
for the interaction of ICAP, lac and gal pro-
moters observed in this work result from the extent of
the DNA bending. This suggestion is in congruence with
the observation of Lin & Lee [38] who have recently
shown that there is an inverse correlation between the
extent of the DNA bending and binding affinity of
CRP–DNA complex. As the bending propensity is
sequence-specific, it may be expected that the binding of
the different DNA promoter sequences can induce var-
ious conformational changes in the N-terminal domain
of CRP, which are responsible for the interactions with
other participants of transcriptional machinery, such as
RNA polymerase and the CytR protein.
To conclude, we suggest that CRP can exist in solu-
tion in several conformational states and that a distri-
bution between these states is affected by binding both
cAMP and specific DNA sequences. This suggestion
implies a much more dynamic behaviour to transcrip-
tional activators, such as CRP in the transcription
machinery, than has been recently proposed, on the
basis of crystal studies [12], to be a simple ‘recruit-
ment’ mechanism without conformational signaling
within the CRP activator.
Experimental procedures
Materials
All chemicals purchased were of the highest quality and
purity. Acrylamide, EDTA, cAMP, dithiothreitol, phenyl-
methanesulfonyl fluoride, and Tris were purchased from
Sigma. N-Iodoacetylaminoethyl-1-naphthylamine-5-sulfo-
nate (1,5-I-AEDANS) was obtained from Molecular Probes
(Eugene, OR). The nutrients for bacterial growth were from
Gibco BRL. KCl, NaCl, NaH
2
PO
4
, and KI were obtained
either from Fluka (Buchs, Switzerland) or from Riedel-de-
Hae
¨
n (Seelze GmbH, Germany). dNTP, Pwo DNA poly-
merase, HindIII and EcoRI endonucleases, and T4 DNA
ligase were from Roche Molecular (Mannheim, Germany).
The absorption coefficients of the cyclic nucleotide and
1,5-I-AEDANS probe were 14 650 m
)1
Æcm
)1
at 259 nm [39]
and 6000 m
)1
Æcm
)1
at 340 nm [40], respectively. All measure-
ments were performed in buffers prepared in water that was
purified by using a Millipore system (Bedford, OH, USA).
Plasmids and cells
The tryptophan at position 85 in the CRP was replaced
with alanine. The mutagenesis was performed by using an
overlap extension method and the pHA7 plasmid encoding
the crpwt gene. The mutated gene was cloned into plasmid
pBR322 (at the HindIII ⁄ EcoRI site). CRPW85A mutant
protein was overproduced in Escherichia coli strain
M128Dcrp. The bacteria were cultured on Luria–Bertani
(LB) medium for 8 h at 37 °C in Biostat B (B.Braun Bio-
tech International, Melsungen, Germany).
DNA sequences
Fragments of regulatory DNA sequences used in the fluor-
escence quenching experiment were purchased from TIB
Molbiol (Poznan, Poland). The DNA sequences are as fol-
lows: 5¢-AAAAGTGTGACATGGAATAAATTAGT-3¢ for
gal (26 bp), 5¢-ATTAATGTGAGTTAGCTCACTCATTA-
3¢ for lac (26 bp), and 5¢-AATTAATGTGACATATGTCA
CATTAATT-3¢ for ICAP (28 bp) (and its complementary
strands). The recognition half-sites are marked in bold.
Oligonucleotides of 26 bp (used in the stopped-flow kinetic
experiments) labeled with fluorescein at the 5¢-end were pur-
chased from Sigma Genosys (Cambridge, UK). The fluoresc-
ein-labeled single-stranded oligonucleotides were annealed
with the appropriate complementary strands without dye.
The lyophilized oligonucleotides were dissolved in 20 mm
Tris ⁄ HCl buffer, pH 7.9, containing 0.1 m NaCl and 0.1 mm
EDTA. Equimolar amounts of the complementary DNA
chains were mixed together, heated for 10 min at 95 ° C and
cooled slowly to room temperature. The double-stranded
DNA was stored at )20 °C in an experimental buffer.
Purification of proteins
The isolation and purification procedures of wild-type CRP
and CRPW85A mutant were carried out in the same man-
ner as previously described [7]. The purity of the proteins
was confirmed by SDS ⁄ PAGE stained with Coomassie
blue. The concentration of proteins was determined by
absorption spectroscopy using the molar extinction coeffi-
cients 40 800 m
)1
Æcm
)1
[41] and 33 100 m
)1
Æcm
)1
at 278 nm
for CRPwt and CRPW85A [42] dimers, respectively.
The measurements were performed in 50 mm Tris ⁄ HCl
buffer, pH 7.9, containing 100 mm KCl and 1 mm EDTA
(buffer A), and 50 mm Tris ⁄ HCl buffer, pH 8.0, supple-
mented with 100 mm KCl and 1 mm EDTA (buffer B).
M. Tworzydło et al. CRP conformational changes induced by DNA and cAMP
FEBS Journal 272 (2005) 1103–1116 ª 2005 FEBS 1113
Fluorescence labeling of CRP
The preparation details of 1,5-I-AEDANS-labeled CRP
were as previously described [7].
The labeled proteins were purified on a Sephadex G-25
column equilibrated with buffer B. Fractions displaying an
absorbance at both 280 and 340 nm were combined and
dialyzed extensively against buffer B. The stoichiometry of
labeling was determined spectrophotometrically and ranged
from 1.0 to 1.8 mol of the label per mol of CRP dimer. It
has been shown previously that only Cys178 (C-terminal
domain, Fig. 1) can be chemically modified under condi-
tions preserving its native structure [7,43].
Fluorescence quenching measurements
The steady-state fluorescence quenching experiments were
performed at 20 °C in buffer A in a Hitachi F-4500 spec-
trofluorimeter (Tokyo, Japan). The corrected spectra were
recorded in the range from 310 to 400 nm. The excitation
wavelength was 295 nm. The excitation and emission slits
were set at 5 and 10 nm, respectively. The protein solution
had an initial absorbance, at the excitation wavelength, of
lower than 0.1. KI solution used for fluorescence quenching
contained 0.1 mm sodium thiosulfate. Fluorescence values
were corrected for any dilution effects as well as for resid-
ual buffer emission, Raman scattering and absorption
of light by acrylamide. The e
295
for acrylamide was
0.25 m
)1
Æcm
)1
[25]. Before measurements, all samples were
filtered through a microporous filter (0.45 lm; Millipore) to
remove any insoluble impurities. The quenching data were
analyzed by using the Stern–Volmer equation:
F
F
0
¼
X
i
f
i
ð1 þ K
i
½QÞ expðV
i
½QÞ
ð3Þ
where F
0
and F are fluorescence intensities in the absence
and presence of quencher, Q, respectively, K
i
and V
i
are the
dynamic and static quenching constants, respectively, and f
i
is the fraction contribution (at the experimental excitation
and emission wavelengths) of component i. The quenching
rate constant k
q
was calculated as k
q
¼ K
i
⁄ s
0
, where s
0
is
the fluorescence lifetime in the absence of the quencher.
The Stern–Volmer equation was fitted to the experimen-
tal data by an iterative nonlinear least-square method [21].
The calculations were performed with the assumption that
the error of single measurement is equal to 1% of the meas-
ured value.
FQRS were obtained by using KI as a quencher, as
described previously [22]. In the FQRS method, the hetero-
geneous fluorescence emission of protein tryptophan resi-
dues can be decomposed into component spectra if the
components differ in Stern–Volmer constant K
i
. The total
fluorescence intensity F(k
i
) measured at a given emission
wavelength, k
i
, is the sum of the contributions of two com-
ponents. The spectrum of each component is given as:
F
i
ðkÞ¼f
i
ðkÞFðkÞð4Þ
In order to obtain the spectrum of each component, the
fluorescence spectra were collected at each quencher con-
centration, and a Stern–Volmer curve (Eqn 1) was fitted to
each set of data obtained at a given emission wavelength. A
simultaneous analysis of a series of fluorescence quenching
data enabled us to resolve the spectrum into components
according to (Eqn 2). The quenching data were fitted to the
Stern–Volmer equation according to a one-component or a
two-component model. The fits were characterized by the
minimum of the reduced v
2
and by the residual distribution
of the experimental data. In all calculations, the Stern–
Volmer constant, K
i
, as well as fraction f
i
were floating
parameters.
Lifetime measurements
Time-resolved intensity decay data were obtained by using
a K2 ISS phase ⁄ modulation frequency-domain fluorimeter,
equipped with a 300 W xenon lamp as a light source. The
excitation wavelength was set at 295 nm, with bandwidth
equal to 8 nm, by using a monochromator. Emission was
observed through a cut-off filter at a wavelength of
320 nm. All measurements were performed in buffer A at
20 °C. The light was modulated over the frequency range
from 10 to 200 MHz by using a Pockels cell modulator.
Glycogen in water was used as a reference (s ¼ 0.0 ns). For
each frequency used, several data were collected, averaged
and analyzed by using an SD of 0.2% for s
p,x
and 0.005%
for s
m,x
. The error of the calculated values of the fluores-
cence parameters was assumed to be 5%.
The intensity data were analyzed in terms of the follow-
ing multiexponential decay law:
I
t
¼ I
0
X
i
a
i
expðÀt=s
i
Þð5Þ
where k
i
and s
i
are the normalized pre-exponential factor
and decay time, respectively.
The fractional fluorescence intensity of each component
is defined as f
i
¼ a
i
s
i
⁄Sa
i
s
i
. The analysis of fluorescence
data was performed by using discrete exponential compo-
nents. The entire software for the data analysis was from
ISS. At an excitation wavelength, the protein sample had
an absorption of < 0.1. In each case the best-fit parameters
were obtained by minimization of the reduced v
2
value.
Stopped-flow FRET measurements
The stopped-flow fluorescence experiments were performed
on a SX-17 MV stopped-flow spectrophotometer obtained
from Applied Photophysics (Leatherhead, UK) in a two
syringe mode. The dead time of mixing was determined to
be less than 2 ms. The temperature in the stopped-flow unit
was maintained at 20 (± 0.1) °C using circulating water
CRP conformational changes induced by DNA and cAMP M. Tworzydło et al.
1114 FEBS Journal 272 (2005) 1103–1116 ª 2005 FEBS
from a thermostatically controlled bath. All measurements
were performed in buffer B.
The FRET kinetic experiments were used for quantitative
measurements of CRP–DNA binding in the presence of
200 lm cAMP. We observed energy transfer between the
1,5-I-AEDANS moiety covalently attached to Cys178
CRPwt and fluorescein attached to the DNA (Fig. 1). Meas-
urements were performed for three different 26 bp DNA
sequences – lacF, galF and ICAPF. The reactions were mon-
itored using fluorescence of the fluorescein moiety of the
modified oligonucleotides. CRP–AEDANS was excited at
340 nm, and the total fluorescence emission was observed at
wavelengths of > 505 nm through a cut-off filter.
The sample was incubated in a stopped-flow syringe for
5 min to allow for thermal equilibration. Kinetic experi-
ments were initiated by mixing equal volumes of oligonucleo-
tides (fixed concentrations of 0.2 or 0.4 lm) and various
concentrations of the labeled protein, from 1 to 7 lm. Five
to 10 kinetic traces were collected and averaged for each
concentration point. The data were fitted to extract rate
constants and amplitudes by using nonlinear least-squares
fitting software provided by Applied Photophysics (Leather-
head, UK), using single-exponential or double-exponential
equations:
FðtÞ¼A expðÀktÞþF
1
ð6Þ
where F is the fluorescence intensity at time t , A and k are
the amplitude and the observed rate constant, respectively,
and F
1
is the fluorescence at infinite time. The validity of
the fitting was evaluated by an inspection of residuals and
normalized variation parameters.
Acknowledgements
This work was supported by grant no. 3 P04A 006 24
from the Ministry of Science and Informatics.
References
1 Busby S & Ebright R (1999) Transcription activation by
Catabolite Activator Protein (CAP). J Mol Biol 293,
199–213.
2 Harman JG (2001) Allosteric regulation of the cAMP
receptor protein. Biochim Biophys Acta 1547, 1–17.
3 Passner JM & Steitz TA (1997) The structure of a
CAP–DNA complex having two cAMP molecules
bound to each monomer. Proc Natl Acad Sci USA 94,
2843–2847.
4 de Crombrugghe B, Busby S & Buc H (1984) Cyclic
AMP receptor protein: role in transcription activation.
Science 224, 831–838.
5 Taniguchi T, O’Neill M & de Crombrugghe B (1979)
Interaction site of Escherichia coli cyclic AMP receptor
protein on DNA of galactose operon promoters. Proc
Natl Acad Sci USA 76, 5090–5094.
6 Passner JM, Schultz SC & Steitz TA (2000) Modeling
the cAMP-induced allosteric transition using the crystal
structure of CAP-cAMP at 2.1 A
˚
resolution. J Mol Biol
304, 847–859.
7 Polit A, Błaszczyk U & Wasylewski Z (2003) Steady-
state and time-resolved fluorescence studies of confor-
mational changes induced by cyclic AMP and DNA
binding to cyclic AMP receptor protein from Escheri-
chia coli. Eur J Biochem 270, 1413–1423.
8 Yu S & Lee JC (2004) Role of residue 138 in the inter-
domain hinge region in transmitting allosteric signals
for DNA binding in Escherichia coli cAMP receptor
protein. Biochemistry 43, 4662–4669.
9 Zhou Y, Zhang X & Ebright RH (1993) Identification
of the activating region of catabolite gene activator pro-
tein (CAP): isolation and characterization of mutants of
CAP specifically defective in transcription activation.
Proc Natl Acad Sci USA 90, 6081–6085.
10 Niu W, Kim Y, Tau G, Heyduk T & Ebright RH
(1996) Transcription activation at class II CAP-depen-
dent promoters: two interactions between CAP and
RNA polymerase. Cell 87, 1123–1134.
11 Weber IT & Steitz TA (1987) Structure of a complex of
catabolite gene activator protein and cyclic AMP refined
at 2.5 A
˚
resolution. J Mol Biol 198, 311–326.
12 Benoff B, Yang H, Lawson CL, Parkinson G, Liu J,
Blatter E, Ebright YW, Berman HM & Ebright RH
(2002) Structural basis of transcription activation: the
CAP–aCTD–DNA complex. Science 297, 1562–1566.
13 Lee BJ, Lee SJ, Hayashi F, Aiba H & Kyogoku Y
(1990) A nuclear magnetic resonance study of the cyclic
AMP receptor protein (CRP): assignments of the NH
protons of histidine and tryptophan residues and the
effect of binding of cAMP to CRP. Biochem J 107,
304–309.
14 Sixl F, King RW, Bracken M & Feeney J (1990)
19
F-n.m.r. studies of ligand binding to 5-fluorotrypto-
phan- and 3-fluorotyrosine-containing cyclic AMP
receptor protein from Escherichia coli. Biochem J 266,
545–552.
15 Tan G, Kelly P, Kim J & Wartell RM (1991) Compari-
son of cAMP receptor protein and a cAMP-independent
form of CRP by Raman spectroscopy and DNA bind-
ing. Biochemistry 30, 5076–5080.
16 Leu SF, Baker CH, Lee EJ & Harman JG (1999) Posi-
tion 127 amino acid substitutions affect the formation
of CRP:cAMP:lacP complexes but not
CRP:cAMP:RNA polymerase complexes at lacP. Bio-
chemistry 38, 6222–6230.
17 Małecki J, Polit A & Wasylewski Z (2000) Kinetic stu-
dies of cAMP-induced allosteric changes in cyclic AMP
receptor protein from Escherichia coli. J Biol Chem 275,
8480–8486.
18 Polit A, Bonarek P, Kepys B, Kedracka-Krok S,
Go
´
recki A & Wasylewski Z (2003) Kinetic studies of
M. Tworzydło et al. CRP conformational changes induced by DNA and cAMP
FEBS Journal 272 (2005) 1103–1116 ª 2005 FEBS 1115
cAMP-induced allosteric changes in T127I, S128A and
T127I ⁄ S128A mutants of cAMP receptor protein from
Escherichia coli. J Biol Chem 278, 43020–43026.
19 Błaszczyk U, Polit A, Guz A & Wasylewski Z (2002)
Interaction of cAMP receptor protein from Escherichia
coli with cAMP and DNA studied by dynamic light
scattering and time-resolved fluorescence anisotropy
methods. J Protein Chem 20, 601–610.
20 Lakowicz JR (1999) Principles of Fluorescence Spectros-
copy. Kluver Academic Publisher, Dordrecht, the
Netherlands.
21 Stryjewski W & Wasylewski Z (1986) The resolution of
heterogeneus of multitryptophan-containing proteins
studied by a fluorescence-quenching method. Eur J Bio-
chem 158, 547–553.
22 Wasylewski Z, Koloczek H & Wasniowska A (1988)
Fluorescence-quenching resolved spectroscopy of pro-
teins. Eur J Biochem 172, 719–724.
23 Heyduk T & Lee JS (1989) Escherichia coli cAMP
receptor protein: evidence for three protein conforma-
tional states with different promoter binding affinities.
Biochemistry 28, 6914–6924.
24 Wasylewski M, Małecki J & Wasylewski Z (1995)
Fluorescence study of Escherichia coli cyclic AMP
receptor protein. J Protein Chem 14, 299–308.
25 Eftink MR & Ghiron CA (1981) Fluorescence quench-
ing studies with proteins. Anal Biochem 114, 199–227.
26 Eftink MR (1997) Fluorescence methods for studying
equilibrium macromolecule–ligand interaction. Methods
Enzymol 278, 221–257.
27 Eftink MR, Wasylewski Z & Ghiron CA (1987)
Phase-resolved spectral measurements with several two
tryptophan containing proteins. Biochemistry 26, 8338–
8346.
28 Su
¨
gaard-Andersen L, Mironov AS, Pedersen H, Sukh-
odelets VV & Valentin-Hansen P (1991) Single amino
acid substitutions in the cAMP receptor protein specifi-
cally abolish regulation by the CytR repressor in
Escherichia coli. Proc Natl Acad Sci USA 88, 4921–
4925.
29 Chen Y & Barkley MD (1998) Toward understanding
tryptophan fluorescence in proteins. Biochemistry 37,
9976–9982.
30 Krueger S, Gregurick S, Shi Y, Wang S, Wladkowski
BD & Schwarz FP (2003) Entropic nature of the inter-
action between promoter bound CRP mutants and
RNA polymerase. Biochemistry 42, 1958–1968.
31 Baichoo N & Heyduk T (1998) DNA-induced confor-
mational changes in cyclic AMP receptor protein: detec-
tion and mapping by a protein footprinting technique
using multiple chemical proteases. J Mol Biol 290,
37–48.
32 Perez-Howard GM, Weil AP & Beechem JM (1995)
Yeast TATA binding protein interaction with DNA:
fluorescence determination of oligomeric state, equili-
brium binding, on-rate, and dissociation kinetics. Bio-
chemistry 34, 8005–8017.
33 Kwon H, Park S, Lee S, Lee D-K & Yang C-H (2001)
Determination of binding constant of transcription fac-
tor AP-1 and DNA. Application of inhibitors. Eur J
Biochem 268, 565–572.
34 Saecker RM, Tsodikov OV, McQuade KL, Schlax PE
Jr, Capp MW & Record MT Jr (2002) Kinetic studies
and structural models of the association of E. coli r70
RNA polymerase with the lPR promoter: large scale
conformational changes in forming the kinetically signi-
ficant intermediates. J Mol Biol 319, 649–671.
35 Shi Y, Wang S, Krueger S & Schwarz FP (1999) Effect
of mutations at the monomer–monomer interface of
cAMP receptor protein on specific DNA binding. J Biol
Chem 274, 6946–6956.
36 Gunasekera A, Ebright YW & Ebright RH (1992)
DNA sequence determinants for binding of the Escheri-
chia coli catabolite gene activator protein. J Biol Chem
267, 14713–14720.
37 Chen S, Vojtechovsky J, Parkinson GN, Ebright RH &
Berman HM (2001) Indirect readout of DNA sequence
at the primary-kink site in the CAP–DNA complex:
DNA binding specificity based on energetics of DNA
kinking. J Mol Biol 314, 63–74.
38 Lin S-H & Lee JC (2003) Determinants of DNA bend-
ing in the DNA-cyclic AMP receptor protein complexes
in Escherichia coli. Biochemistry 42, 4809–4818.
39 Merck Inc. (1976) The Merck Index, 9th edn. Merck,
Inc, Rahway, NJ, USA.
40 Hudson EN & Weber G (1973) Synthesis and character-
ization of two fluorescent sulfhydryl reagents. Biochem-
istry 12, 4154–4161.
41 Takahashi M, Blazy B & Baudras A (1980) An equili-
brium study of the cooperative binding of adenosine
cyclic 3¢,5¢-monophosphate and guanosine cyclic 3¢,5¢-
monophosphate to the adenosine cyclic 3¢,5¢-monophos-
phate receptor protein from Escherichia coli. Biochemis-
try 19, 5124–5130.
42 Gill SC & von Hippel PH (1989) Calculation of protein
coefficients from amino acids sequence data. Anal Bio-
chem 182, 319–326.
43 Eilen E & Krakow JS (1977) Cyclic AMP-mediated
intersubunit disulfide crosslinking of the cyclic AMP
receptor protein of Escherichia coli. J Mol Biol 114,
47–60.
44 Schultz SC, Shields GC & Steitz TA (1991) Crystal
structure of a CAP–DNA complex: The DNA is bent
by 90 degrees. Science 253, 1001–1007.
CRP conformational changes induced by DNA and cAMP M. Tworzydło et al.
1116 FEBS Journal 272 (2005) 1103–1116 ª 2005 FEBS