Protective effects of s propargylcysteine (SPRC) on in vitro neuronal damage induced by amyloid beta (25 35 4
Bạn đang xem bản rút gọn của tài liệu. Xem và tải ngay bản đầy đủ của tài liệu tại đây (889.77 KB, 26 trang )
IN VITRO STUDY
68
CHAPTER 4: PART I - IN VITRO STUDY
INVESTIGATING THE ANTI-AMYLOIDOGENIC AND FREE RADICAL
SCAVENGING PROPERTIES OF SPRC
4.1 Results
4.1.1 Effects of Aβ
25-35
aggregation with time
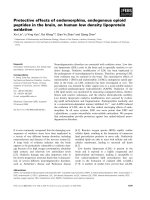
Figure 11: Aggregation of Aβ
25-35
at 37°C over time. (a) Average fluorescence change over
incubation time at 37°C measured by shift in Thio-T fluorescence. N=12, **:p<0.01. (b)
0
0.2
0.4
0.6
0.8
1
1.2
1.4
1.6
0 24 48 72 96
RFU
Time/h
**
**
**
**
(b)
(c)
(a)
IN VITRO STUDY
69
Representative gel photo of protein bands incubated at 37°C for different lengths of time using
Coomassie blue staining. N=3. (c) Representative gel photo of Aβ oligomers left in wells of the
stacking gel after 0h and 96h incubation at 37°C respectively.
The shift in thioflavin T fluorescence was employed to track the self-aggregation of Aβ
25-
35
at 37°C over 96 hours. There was a significant increase (F
(4,194)
= 60.131; p<0.01) in the
aggregation of 50 µM Aβ
25-35
from 0-96 hours, presented as relative fluorescence units per 24
hours. 50 µM Aβ
25-35
aggregated fairly rapidly and significantly to about 120% of the initial
fluorescence at 0 hour in the first 24 hours (Figure 11a) and gradually slowed down to a constant
rate to 96 hours. At the end of 96 hours, the final products produced a shift of about 1.4 RFU, or
40% higher than the initial fluorescence. Correspondingly, there was a noticeable decrease in the
Coomassie blue staining of monomers in a time-dependent manner (Figure 11b). The stained
bands decreased in size and density as the incubation time increased, resulting in the smallest
stained band after 96 h incubation. These bands were concluded to be the monomers as the
aggregation produced fibrils which could not enter the acrylamide gel and were left in the
stacking gel as observed in Figure 11c. After 96 h incubation at 37°C, there was an obvious
darker band left in the well of the stacking gel which was not observed with the freshly prepared
sample. The band stained rapidly in Coomassie blue and is believed to be large molecular weight
aggregates unable to enter the 4% stacking gel and could not be visualized in the resolving gel.
IN VITRO STUDY
70
4.1.2 Effects of Aβ
25-35
aggregation with temperature
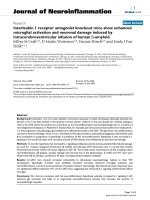
Figure 12: Aggregation of Aβ
25-35
with increasing temperature for 96 hours. (a) Average
fluorescence change over incubation time measured by shift in Thio-T fluorescence. N≥6. (b)
Representative gel photo of protein bands incubated at different temperatures for 96 hours using
Coomassie blue staining. N=3, p<0.05.
The aggregation of Aβ
25-35
was investigated by incubating 50 µM Aβ
25-35
at increasing
temperature for 96 hours. Thio-T fluorescence was significantly different upon increasing
incubation temperatures (F
(2,23)
= 3.674; p<0.05) (Figure 12a). However, there was no
significance observed between incubation at 4°C and 25°C, or between 25°C and 37°C. There
was only significant increase (p<0.05) when comparing between the 4°C and 37°C incubations.
Similarly, there were obvious decreases in stained monomers between samples incubated at
different temperatures (Figure 12b). Aβ
25-35
incubated at 4°C showed a dark band which became
less dense than that incubated at 25°C and 37°C. The monomer band for Aβ incubated at 37°C
was the weakest when compared between incubations at different temperatures.
0.8
0.85
0.9
0.95
1
1.05
1.1
1.15
1.2
1.25
1.3
4 25 37
RFU
Temperature/ °C
N.S
*
N.S
(a)
(b)
IN VITRO STUDY
71
4.1.3 Effects of SPRC on Aβ
25-35
aggregation
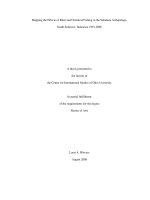
Figure 13: Effects of different concentrations of SPRC on Aβ
25-35
aggregation. (a) Change in
Thio-T fluorescence tracked over 96 h when 50 µM Aβ
25-35
was incubated with different
concentrations of SPRC at 37°C. (b) Thio-T fluorescence of different concentrations of SPRC at
0 h, 24 h, 48 h, 72 h and 96 h. Co-incubation with SPRC showed significant decreases as the
0.8
0.9
1
1.1
1.2
1.3
1.4
1.5
1.6
0 4 8 12 16 20 24 28 32 36 40 44 48 52 56 60 64 68 72 76 80 84 88 92 96
RFU
Time/h
SPRC 0 µM SPRC 1 µM
SPRC 10 µM SPRC 50 µM
SPRC 100 µM
0
0.2
0.4
0.6
0.8
1
1.2
1.4
1.6
0 1 10 50 100
RFU
Concentration of SPRC/µM
0h 24h 48h 72h 96h
*
*
**
**
**
**
**
**
**
**
**
0
0.5
1
1.5
2
2.5
3
3.5
4
4.5
0 1 10 50 100
Slope (x10
-3
)
Concentration of SPRC/ µM
*
**
**
**
(a)
(b)
(c)
(d)
IN VITRO STUDY
72
concentrations and incubation times increased. N=12, *: p<0.05, **: p<0.01 when compared to
the control group. (c) Rates of change (slope) for the 96-hour incubation decreased with
increasing concentrations of SPRC. N=12, **: p<0.01 when compared to the control group. (d)
Representative gel photo of the bands of 50 µM Aβ
25-35
that were incubated with different
concentrations of SPRC, stained with Coomassie blue. N=3.
Incubation of various doses of SPRC with 50 µM Aβ
25-35
slowed the aggregation over
96h at 37°C (Figure 13a). Co-incubation of Aβ
25-35
with SPRC1 µM, SPRC 10 µM and SPRC 50
µM resulted in gradual, dose-dependent declines in the rate of aggregation which were
observable from 12 hours. The shifts in fluorescence, which represent the rate of aggregation,
were significantly different from the control group after 72 h for co-incubation with smaller
doses of SPRC (Figure 13b). However, these differences were significant after only 48 h for co-
incubation with larger doses of SPRC, especially for 50 µM SPRC, in which the significance was
observed starting from 24 h and sustained till 96 h. This suggested that the larger doses
decreased the rates of aggregation more than that of the smaller doses. At the end of the
incubation, or after 96 h, the aggregation products were all significantly less upon co-incubation
with SPRC. The final changes in fluorescence recorded for both 50 µM and 100 µM SPRC were
half of that observed in the control group. The rates of change in fluorescence across 96 h were
also found using the average slopes (Figure 13c). The control group had the largest slope of
about 3.91 x 10
-3
. The slopes gradually decreased with increasing doses of SPRC, in which 50
µM showed the smallest slope of about 1.16 x 10
-3
. This suggested that SPRC can slow the rate
of aggregation of Aβ
25-35
. The final aggregation products of Aβ
25-35
were reduced after incubating
increasing doses of SPRC with Aβ
25-35
(Figure 13d). The amounts of monomers, or unaggregated
Aβ
25-35
, were largely decreased after a 96 h-incubation, evident from the lack of staining of the
15 kDa smear (Lane 2 vs 3). This lack of the smear was also observed when Aβ
25-35
was co-
incubated with 1 µM or 10 µM SPRC (Lanes 4 and 5). The stained smears or monomers re-
appeared after incubation with 50 µM and 100 µM (Lanes 6 and 7). The band for 50 µM SPRC
IN VITRO STUDY
73
appeared much darker and intense than that for 100 µM SPRC. These data suggested that SPRC
could reduce aggregation, and the optimal dose was 50 µM.
4.1.4 Effects of SAC on Aβ
25-35
aggregation
0.9
1
1.1
1.2
1.3
1.4
1.5
0 4 8 12 16 20 24 28 32 36 40 44 48 52 56 60 64 68 72 76 80 84 88 92 96
RFU
Time/h
SAC 0 µM SAC 1 µM SAC 10 µM SAC 50 µM SAC 100 µM
0
0.2
0.4
0.6
0.8
1
1.2
1.4
1.6
0 1 10 50 100
RFU
Concentration of SAC/µM
0 h 24 h 48 h 72 h 96 h
*
**
**
**
**
**
**
0
0.5
1
1.5
2
2.5
3
3.5
0 1 10 50 100
Slope (x10
-3
)
Concentration of SAC/ µM
**
**
**
**
(a)
(b)
(c)
IN VITRO STUDY
74
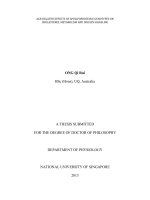
Figure 14: Effects of different concentrations of SAC on Aβ
25-35
aggregation. (a) Change in
Thio-T fluorescence tracked over 96 h when 50 µM Aβ
25-35
was incubated with different
concentrations of SAC at 37°C. (b) Thio-T fluorescence of different concentrations of SAC at 0
h, 24 h, 48 h, 72 h and 96 h. Co-incubation with SAC only showed significant decreases after 72
h incubation. N>12, *: p<0.05, **: p<0.01 when compared to the control group. (c) Rates of
change (slope) for the 96-hour incubation showed a biphasic decrease with concentration of SAC.
N>12, **: p<0.01 when compared to the control group.
Incubation with increasing doses of SAC generally discourages Aβ
25-35
aggregation
significantly (Figure 14a). The shifts in Thio-T fluorescence after incubating Aβ
25-35
with SAC
appeared to be biphasic. While 1 µM and 10 µM SAC incubations decreased the shifts in Thio-T
fluorescence dose-dependently, but 50 µM and 100 µM SAC incubations resulted in reduced
Thio-T fluorescence more than the lower doses. Differences in fluorescence after incubation
with SAC were only significant after 72 h (Figure 14b); the effects of the co-incubation were
only evident after 72 h. All doses except the co-incubation with 50 µM SAC resulted in
significant decreases after this period, and co-incubation with 50 µM SAC was only significantly
deviated from normal Aβ
25-35
aggregation at 96 h. This trend can also be seen in the rate of
change in shift of fluorescence measured (Figure 14c). Co-incubation Aβ
25-35
with SAC
decreased the slope significantly at lower doses, but the addition of 50 µM SAC did not follow
the trend. Rather, co-incubation with 50 µM SAC resulted in a larger slope of about 1.66 x 10
-3
.
The smallest slope recorded was for the co-incubation with 10 µM SAC at 1.3 x 10
-3
.
IN VITRO STUDY
75
4.1.5 Effects of NaHS on Aβ
25-35
aggregation
0.8
0.9
1
1.1
1.2
1.3
1.4
1.5
0 4 8 12 16 20 24 28 32 36 40 44 48 52 56 60 64 68 72 76 80 84 88 92 96
RFU
Time/h
NaHS 0 µM NaHS 1 µM NaHS 10 µM NaHS 50 µM NaHS 100 µM
0
0.2
0.4
0.6
0.8
1
1.2
1.4
1.6
0 1 10 50 100
RFU
Concentration of NaHS/µM
0 h 24 h 48 h 72 h 96 h
**
*
**
*
**
**
*
**
**
**
**
**
**
**
*
**
0
0.5
1
1.5
2
2.5
3
3.5
4
0 1 10 50 100
Slope (x10
-3
)
Concentration of NaHS/ µM
**
*
**
(a)
(b)
(c)
IN VITRO STUDY
76
Figure 15: Effects of different concentrations of NaHS on Aβ
25-35
aggregation. (a) Change in
Thio-T fluorescence tracked over 96 h when 50 µM Aβ
25-35
was incubated with different
concentrations of NaHS at 37°C. (b) Thio-T fluorescences of different concentrations of NaHS at
0 h, 24 h, 48 h, 72 h and 96 h. Co-incubation with NaHS showed significant decreases in
fluorescence for all doses as early as 24 h. N=12, *: p<0.05, **: p<0.01 when compared to the
control group. (c) Rates of change (slope) for the 96-hour incubation showed a biphasic decrease
with the concentration of NaHS. N=12, *: p<0.05, **: p<0.01 when compared to the control
group.
Co-incubating different doses of NaHS 50 µM with Aβ
25-35
declined the change in
fluorescence significantly (Figure 15a). The effects were observable as early as 4 hours and
generally slowed for all doses, most significantly seen with 100 µM NaHS. There appears to be a
biphasic trend where 10 µM NaHS decreased aggregation rate more than the 50 µM group and
this decline was repeated by the higher 100 µM group. When compared to the control group at
every 24-hour time point (Figure 15b), all doses of NaHS showed significant decreases in
fluorescence as early as 24 hours. Interestingly, both 10 µM and 100 µM NaHS resulted in
significantly lower fluorescence at all time points when compared to the control group. The rate
of change in fluorescence (Figure 15c) decreased upon co-incubation with NaHS, where the
similar biphasic trend was observed. 1 µM and 50 µM resulted in slopes of about 2 x 10
-3
, though
10 µM and 100 µM NaHS resulted in much more significant reduction (p<0.01) in slopes to 1.32
x 10
-3
and 1.35 x 10
-3
respectively.
IN VITRO STUDY
77
4.1.6 Comparison of equimolar concentration of drugs on aggregation
Figure 16: Comparison between treatments with different drugs. (a) Thio-T fluorescence for
incubation with different drugs over 96 h. (b) Rates of change in fluorescence after co-incubation
with 50 µM of SPRC, SAC or NaHS. (c) Comparison of percentage decreases in end-point
fluorescence by incubation with different drugs. (d) Representative gel photo of the bands of 50
µM Aβ
25-35
that were incubated with 50 µM of different drugs over 96 h, stained with Coomassie
blue. Values are expressed with S.E.M. N=3, **: p<0.01.
0.8
0.9
1
1.1
1.2
1.3
1.4
1.5
0 4 8 12 16 20 24 28 32 36 40 44 48 52 56 60 64 68 72 76 80 84 88 92 96
RFU
Time/h
Aβ 50 µM only
Aβ 50 µM + SPRC 50 µM
Aβ 50 µM + SAC 50 µM
Aβ 50 µM + NaHS 50 µM
0
0.5
1
1.5
2
2.5
SPRC 50 µM SAC 50 µM NaHS 50 µM
Slope (x10
-3
)
-25.00%
-20.00%
-15.00%
-10.00%
-5.00%
0.00%
SPRC 50 µM SAC 50 µM NaHS 50 µM
% decrease in fluorescence
N.S
N.S
**
(b)
(c)
(a)
(d)
IN VITRO STUDY
78
50 µM was chosen as the dose for comparison to investigate the effects of drug
incubation on Aβ
25-35
aggregation. The shifts in Thio-T fluorescence tracked over 96 h at37°C
for equimolar concentrations of different drugs were compared on the same axis (Figure 16a).
SPRC 50 µM maintained the lowest fluorescence shift consistently over 96h. SAC 50 µM and
NaHS 50 µM both showed slightly higher fluorescence shifts than SPRC, although NaHS was
more effective than SAC in slowing Aβ
25-35
aggregation. The slopes of the Thio-T fluorescence
assay were taken as the rates of change in fluorescence (Figure 16b). While no significance was
observed between the groups, the smallest slope after incubation with SPRC 50 µM (1.29 x 10
-3
± 0.21) implied the slowest rate of aggregation. The incubation with 50 µM of SAC or NaHS
showed a larger rate of aggregation at 1.66 x 10
-3
and 1.78 x 10
-3
respectively, although the
difference in slopes is small. SPRC 50 µM resulted in about 20% decrease in the end-point
fluorescence, and this was significantly lower than when incubated with SAC (p<0.01). One-
way ANOVA showed that end-point fluorescences of SPRC, SAC and NaHS differed
significantly (F
(2,35)
= 6.367; p,0.01) (Figure 16c). Equimolar concentrations of SAC and NaHS
resulted in about 10% and 15% decreases in end-point fluorescence respectively and no
differences were found between both groups. This was observed in the decrease in density and
size of the monomer bands stained with Coomassie blue (Figure 16d). There was a significantly
lighter-stained band after 96 h incubation at 37°C which was restored to some extent after
addition of 50 µM of drugs. The monomer band at 15 kDa was darkest and largest after addition
of SPRC. The bands with SAC and NaHS appeared slightly less dense than the SPRC band,
although the differences were not very obvious.
IN VITRO STUDY
79
4.1.7 Effects on radical scavenging
Figure 17: Effects of radical scavenging abilities of various drugs. (a) Dose-dependent changes
in absorbances of ABTS measured over with different drugs. (b) TEAC value as compared to
Vitamin C as a control. N=2; #: p<0.05 compared to 10 µM Vitamin C; *: p<0.05 compared to
50 µM Vitamin C; &: p<0.05 compared to 1000 µM Vitamin C.
There were obvious dose-dependent decreases in the absorbance profiles of the various
drugs (Figure 17a). Vitamin C was used as a positive control with its known strong antioxidant
properties, and absorbance dropped starkly within the first 100 µM. This trend was observed
within the first 100 µM of NaHS too. SPRC and SAC showed less confident absorbance profiles,
0
0.1
0.2
0.3
0.4
0.5
0.6
0.7
0.8
0.9
0 100 200 300 400 500 600 700 800 900 1000
Absorbance at 733 nm
Concentration (µM)
Vitamin C SPRC SAC NaHS
0%
20%
40%
60%
80%
100%
120%
SPRC SAC NaHS Vit C
TEAC value (%)
10 µM 50 µM 1000 µM
# #
#
*
*
&
&
(b)
(a)
IN VITRO STUDY
80
though SPRC demonstrated a more significant dose-dependent decrease in absorbance, to about
0.3 units at 1000 µM. SAC however, was less competent in decreasing the absorbance, where
absorbance remained at about 0.7 units despite increasing the dose to 1000 µM. TEAC was used
to quantify the radical scavenging powers with Vitamin C as a control (100%) (Figure 17b). The
differences in groups were highly significant at 10 µM (F
(3,7)
= 1652.875; p<0.01), 50 µM (F
(3,7)
=
80248.46; p<0.01) and 1000 µM (F
(3,7)
= 36383.07; p<0.01). While both SPRC and SAC had
low TEAC values at lower doses (p<0.01), the TEAC value for 1000 µM SPRC was increased to
71% with 1000 µM SPRC (p<0.01). In contrast, the TEAC value for 1000 µM SAC is only 2%.
The TEAC value for NaHS 10 µM was only 40% (p<0.01), but increased dramatically to close
to 100% with 50 µM and remained so for 1000 µM. This showed that while NaHS is comparable
to Vitamin C as a scavenger of free radicals, SPRC is only able to do so at higher doses and SAC
is most obsolete as a free radical scavenger.
IN VITRO STUDY
81
4.2 Discussion
4.2.1 Aβ
25-35
aggregates with increasing time and temperature
The deposition of amyloid-beta aggregates found in the Alzheimer’s disease (AD) brain
is one of the hallmarks of the disease (222). While such aggregates are not consistently
responsible for behavioural deficits in vivo, several in vitro models have shown the neurotoxicity.
Of which, the truncated variant of the full-length Aβ protein, Aβ
25-35
, is the most toxic (15).
In this study, the temperature-dependent and time-dependent aggregation kinetics of
Aβ
25-35
was investigated. While much research focused on the full-length Aβ
1-42
and the more
commonly detected Aβ
1-40
, little has been established regarding the toxic variant Aβ
25-35
. The
present data have established that the aggregation of Aβ
25-35
follows a temperature-dependent and
time-dependent manner.
Incubating the peptide at increasing temperature yielded increased aggregates evident
from the thioflavin T fluorescence and Coomassie blue staining. Increasing temperature may
disrupt the thermodynamic stability of the peptide molecules and encourage bond formation. The
energy barrier between that of the peptide monomers could be overcome much easier and hence
increased the possibility of interaction and aggregation. This implied that the physiological
condition of 37°C was optimal for the aggregation to take place.
The typical sigmoidal curve of Aβ aggregation is an expression of the nucleation-
polymerization model of assembly kinetics (223). The rate-limiting step of Aβ aggregation is the
unfavourable nucleation step to form an ordered oligomeric nucleus. Subsequently in the growth
phase the nucleus grows rapidly into larger polymers. There will be a steady state phase where
the ordered aggregate and monomer concentrations reach equilibrium. Thioflavin T forms a
IN VITRO STUDY
82
micelle structure in aqueous solvents that could bind to amyloid fibrils but not monomers,
resulting in fluorescence emission that could allow fibril formation to be visualized and tracked
(224). The inertia of forming the prefibrillar nuclei is visualized as the initial lag phase of
thioflavin T fluorescence. Once overcome, the nuclei initiate the elongation phase that
corresponds to a higher rate of fluorescence emission. The later plateau phase reflects the decline
in the rate of aggregate formation (225). Ultimately, the peptide monomers associate with each
other in a larger molecular weight aggregate bound by intramolecular hydrogen bonding that
would not be able to be separated in the tricine gel and remains in the stacking gel as presented
here.
The time-dependence of Aβ aggregation, in part, explains why behavioural deficits of
neurodegeneration usually manifest at an advanced age. While patients of familial AD had
mutations producing highly amyloidogenic forms of Aβ (226), such early onset (below age of 65)
of AD is relatively rare in the affected population. There exists a larger percentage of those
diagnosed with AD (about 95%) who experiences dementia only after the age of 65 (commonly
termed as “late onset”) (227). Such progressive neurodegeneration that becomes apparent in the
aged may be a consequence of the time-dependent nature of Aβ aggregation.
4.2.2 Drug treatments disrupt the formation of Aβ
25-35
fibrils
The co-incubation of drugs with Aβ
25-35
is an attempt to understand the possible
interactions of these chemicals on the aggregation process. Although the co-incubation of drugs
at 0-hour may not be practically significant, this initiative may draw a light on the disruption of
aggregate formation, if any at all.
IN VITRO STUDY
83
Incubation of SPRC, SAC and NaHS with Aβ
25-35
could significantly reduce the amount
of aggregates formed at the end-point shown using the fluorescence method and by SDS-PAGE.
Increasing the concentrations of drugs interfere with the aggregation process to such a
significance that it is relevant to consider how the drugs change the kinetics of Aβ aggregation.
All drugs investigated also showed a dose-dependent decrease in the rate of aggregation as
implied from the slopes of the fluorescence curve.
The intervention to the aggregation process may be a consequence of directly affecting
Aβ
25-35
or of altering the environment. Yan and Wang (228) categorized the protective action of
drugs against Aβ aggregation into three types of mechanisms. Drugs demonstrate Type I
mechanism by modifying the Aβ monomer properties. For example, methionine35 in Aβ can be
easily oxidized into a sulfoxide that would be hard to form protofibril and subsequently,
oligomers. Type II protection mechanism is the direct interaction with Aβ to decrease the
propensity to aggregate. Some drugs like lipocalin-type prostaglandin D synthase (229) and
heme (230) preferentially colocalize with Aβ to interact with specific residues of Aβ with high
affinity, disrupting the aggregation process. The Type III protection mechanism can be conferred
by other drugs like insulin degrading enzyme (231) moderate Aβ aggregation through degrading
Aβ monomers or fibrils.
On the other hand, varying the environment can also discourage Aβ aggregation. Several
environmental factors can influence the assembly of Aβ, such as pH, organic solvents and
impurities etc. Aβ usually adopts a beta-sheet structure in aqueous solutions of neutral pH (232),
but the conformations can change depending on the solvent. Apolar organic solvents like HFIP
may favour a helical structure (16), while DMSO may destabilize the secondary structure (233).
IN VITRO STUDY
84
Decreasing the pH of the solvent may encourage protonation of basic side chains and
electrostatic repulsion interactions that stabilizes fibrils (234).
At the end of the 96-hour incubation, the drugs decreased Aβ aggregation in the proposed
potency at equimolar concentration of 50 µM: SPRC> NaHS> SAC. This was further verified by
size-exclusion chromatography from our sister unit in Fudan University, Shanghai, China
(Figure 18). The fresh unaggregated form of Aβ was monomeric with a single peak retained for a
longer time. Upon aggregation for 96 hours at 37°C, the sample resulted in multiple peaks of
different retention time, mostly shorter than the unaggregated Aβ. This appeared to be an
outcome of different degrees of aggregation. Co-incubating the Aβ with increasing doses of
SPRC the peaks of longer retention time increased in the peak size, suggesting a shift towards
the monomeric form instead of the aggregated form (Figure 18a). Similarly, co-incubation with
50 µM SPRC, SAC or NaHS also shifted the peaks slightly, implying the loss of the larger- sized
aggregates and a higher percentage of monomers in the samples (Figure 18b).
Figure 18: Size-exclusion chromatography carried out by HPLC to separate samples according to
molecular size. (a) Dose dependence of co-incubating SPRC with 50 µM Aβ
25-35
at 37°C for 96
hours. (b) Co-incubating 50 µM SPRC, SAC or NaHS with 50 µM Aβ
25-35
at 37°C for 96 hours.
(a) (b)
IN VITRO STUDY
85
The rate of aggregation with 50 µM SPRC is much lower than SAC and NaHS,
suggesting a strong obstruction to aggregate formation by this drug. By comparing the equimolar
concentration, the effectiveness of the drug can be properly evaluated depending on its nature
instead of its concentration. The chemical properties of the drugs that may take part in the
perceived anti-amyloidogenic effect are further discussed below.
4.2.3 SPRC reduces Aβ
25-35
aggregation more effectively than SAC
SPRC and SAC showed about a similar decline in rate of aggregation Aβ
25-35
at 1 µM and
sustained through to 100 µM. While the classic lag phase of the thioflavin T assay is not visible
in all the groups, the addition of SPRC or SAC delays the Aβ fibril formation considerably
where the increase in fluorescence was negligible after the initial 24 hours. Moreover, the
products formed when co-incubated with SPRC 50 µM or 100 µM dropped sharply very early in
the incubation, from 24 hours and sustained till 96 hours. In contrast, this attenuation of product
formation was only observed as late as 72 hours when incubated with SAC.
The anti-amyloidogenic nature of SAC had been investigated by Rao et al (31). They first
reported that SAC could delay the formation of Aβ
1-40
fibrils when co-incubated at 37°C for 6
days. Also, SAC could also destabilize pre-formed fibrils by inhibiting further aggregation. SAC
has a compact structure with an allyl group which is postulated to interact with the hydrophobic
regions of Aβ. The -OH domain of the carboxylic group in SAC can also bond with
donor/acceptor groups Aβ through hydrogen bonding. Such bondings block the association
between Aβ monomers and hence discourage aggregation.
Interestingly, the substitution of the alkene bond in SAC with an alkyne bond in SPRC
affects the properties of the chemical, in turn influencing its observed anti-amyloidogenic
IN VITRO STUDY
86
abilities. The C≡C bond of SPRC makes it more unsaturated compared to the C=C bond in SAC.
SPRC is more hydrophobic with the triple bond that would likely increase its hydrophobic
interactions with Aβ. The bond angle of the triple bond is almost 180° that does not present any
steric hindrance and thus more prone to reactions than the double bond.
Besides the bond properties, SPRC exhibits increased nucleophilicity due to the higher
electron density at the additional C-C bond. This allows SPRC to display greater reactivity than
SAC in general. The presence of the -OH domain of the carboxylic group in SPRC also caters for
hydrogen bonding alike SAC. In the presence of Aβ fibrils, SPRC is hence able to react at a
higher probability as well as faster rate than SAC.
Alkynes are also known to result in more stable intermediates that are not easily disrupted.
This is due to the hyperconjugation and inductive effects of the electron-donating alkyl groups
that stabilize the intermediates when present. The reaction intermediates between SPRC and Aβ
can be more stable than that between SAC and Aβ, thus less probable to be upset in fibril
formation. Moreover, amyloids can remain kinetically stable for extended periods (5),
consequently forming large molecular weight accumulates in the brain.
While the effects of SPRC on pre-formed fibrils are not investigated in the scope of this
project, the disaggregation properties of SPRC may be interesting to consider. Since SPRC is
closely related to SAC in structure, SPRC would be expected to destabilize pre-formed fibrils
alike SAC.
4.2.4 NaHS confer a Type I protection against aggregation
The addition of NaHS to the Aβ solution also causes a disruption to the aggregation
process. A dose-dependent decline in aggregation can be observed from low concentrations of 1
IN VITRO STUDY
87
µM. Such reduction in aggregated products was obvious as early as 24 hours into the incubation,
at even lower doses than that of SPRC or SAC. This means that the steady state achieved
between monomers and oligomers was hastened and the elongation phase had been realized
much faster than in the uninterrupted solution. This was different from what we observed earlier
with SPRC or SAC. Although the rate of aggregation of co-incubation with 50 µM NaHS does
not differ considerably from that of SAC, it should be noted that this rate (calculated from the
slope) gives an overall value across 96 hours and does not take into account the time-dependent
changes in the slopes. The steep change in slope within the first 24 hours for all doses
investigated is to be highlighted and differentiated from the graphs of SPRC or SAC.
The inhibition of NaHS on Aβ
25-35
aggregation calls for attention onto the chemistry of
this compound. NaHS is a soluble compound that readily hydrolyses in water to form Na
+
and
HS
-
ions (Equation 1).
NaHS Na
+
+ HS
-
⇌ 2H
+
+ S
2-
(Equation 1)
On the other hand, HS
-
ions formed in solution can also combine with H
+
ions to become
H
2
S (Equation 2).
HS
-
+ H
+
⇌ H
2
S (Equation 2)
While H
2
S is a weak acid of pH 7.04 at room temperature, NaHS is a very alkaline
solution of pH 11.5-12.5, possibly due to the exhaustion of H
+
ions by HS
-
that gives rise to
excess OH
-
from the water molecules. Although the dissolution of NaHS into its respective ions
is spontaneous, the effect of temperature on the release of H
2
S should be considered. 33% of
NaHS is converted into H
2
S at 20°C, but only 18.5% is converted at 37°C (235). Hence at this
incubation temperature, the acidic H
2
S produced is almost too limiting to change the alkaline
IN VITRO STUDY
88
solution. These complex differences in pH may be perceived to affect ionic linkages critical for
Aβ aggregation, but in reality the influence of pH is minimal especially with a 100X dilution
when adding NaHS to the Aβ
25-35
solution. Nonetheless, the spontaneous dissolution of NaHS
may account for the rapid potency in the disruption of Aβ fibril formation.
If pH is not involved in halting Aβ aggregation, the likely cause may be the roles of
NaHS as an effective nucleophile and reducing agent that may attack Aβ
25-35
fibrils. NaHS is a
good nucleophile with the HS
-
ion as the central nucleophilic group. NaHS is used in the
Williamson-type synthesis in which the nucleophilic nature reacts with alkyl halides and
sulfonate esters to form thiols (236). This strong nucleophile is also known to take part in the
Asinger reaction that forms a thiol with the α-halogenated carbonyl component. The potent
nucleophilic character of NaHS attacks side chains of amino acids in Aβ to disrupt bond linkages
and discourage aggregation. Moreover, the dissociated ions would also possibly interfere with
electrostatic interactions between side chains or inherent peptide bonding of the Aβ peptide to
interrupt with aggregation. This is akin to the nucleophilic attack by SPRC mentioned above.
In addition, NaHS is a good reducing agent that can reduce aldehydes and ketones readily.
That makes it sensitive to such groups present in the peptide chain and could modify these
groups. Such alterations to the protein side chains make it difficult for the protein to aggregate in
the solution. This, together with the nucleophilic characteristic, may confer the Type I protection
mechanism against Aβ aggregation.
4.2.5 Free radicals were scavenged by drugs in solution
The ability of Aβ
25-35
to radicalize in solution is a mechanism to induce oxidative stress in
the disease state. The aberrant peptide is proposed to become a free radical almost immediately
IN VITRO STUDY
89
in solution that can produce 2, 3-dihydroxybenzoic acid (2, 3-DHBA) (80).The free radical
produced by Aβ
25-35
can readily attack biological molecules such as glutamine synthetase and
creatinine kinase. As such, in addition to the structural component of the aggregates, the toxicity
presented by the radical centre of Aβ should be addressed (237).
The free radical scavenging abilities of the drugs of interest are investigated using the 2,
2’-azino-bis (3-ethylbenzothiazoline-6-sulphonic) acid (ABTS) assay. ABTS is oxidized in the
presence of an oxidizing agent to a coloured nitrogen-centred radical cation ABTS·
+
. A free
radical scavenger can neutralize the ABTS·
+
and produce a change in absorbance (238). Vitamin
C, or L-ascorbic acid, is used as a reference standard in this study. Vitamin C is a strong
reducing agent that can donate two electrons from its double bond at the 2
nd
and 3
rd
carbons to
the unpaired electrons of free radicals, neutralizing the reactive species. The resultant ascorbyl
radical is more stable and less reactive, effectively terminating further radical attacks.
In the radical scavenging study, all the drugs investigated were less effective and efficient
in scavenging free radicals compared to Vitamin C. However, NaHS was comparable to Vitamin
C in the dose-dependence relationship of free radical scavenging. NaHS could attain a 100%
TEAC value at a dose of 50µM and higher doses continued to sustain the scavenging properties
as good as that of Vitamin C. In comparison, SPRC can scavenge free radicals more robustly
compared to SAC. SPRC neutralizes more free ABTS·
+
radicals compared to an equimolar dose
of SAC (Figure 17). The TEAC value of SPRC at the largest 1000 µM dose is at least seven
times that of SAC, indicating the stronger scavenging power of SPRC.
IN VITRO STUDY
90
NaHS is a good reducing agent in which the HS
-
anion can readily be converted into S
-
or
even S
0
. This perhaps explains why in the presence of NaHS the radicals can be easily
neutralized, and almost comparable to that of the known antioxidant Vitamin C.
The cysteine analogs SPRC and SAC investigated here are structurally similar to cysteine.
Cysteine is usually a site for disulfide bonds as the sulfhydryl group can easily be oxidized to
form the required dimer. This amino acid also has a strong reducing potential since the hydrogen
can readily be replaced by radicals. This radical- neutralizing effect can be seen in the numerous
cysteines in glutathione, a natural antioxidant.
Likewise, SPRC and SAC both possess the cysteine sulfhydryl group that may take part
in the suggested radical scavenging properties. While SAC has demonstrated much antioxidant
effects in animal and cell models, SAC is not a good scavenger in vitro. It has some degree of
1,1-diphenyl-2-picrylhydrazyl (DPPH) radical and superoxide anion scavenging properties, but
not as strong as that observed in curcumin and capsaicin. In fact the redox potential is so weak
that it cannot be detected via cyclic voltammetry at 5 µg/ml or 30 µg/ml, unlike curcumin,
capsaicin or glutathione (239). This weak radical scavenging nature is confirmed by our studies
too.
SPRC is hypothesized to take part in the radical scavenging actions by its stronger
electron-donating trait. The presence of the triple bond that is electron-rich allows it to be more
reducing than the double bond of SAC. Yet, the strength of the electron cloud form the extra p
bond of the double bond is not as strong as that of the negative ion HS
-
. This substantiates why
the TEAC values of SPRC are not as high as that in NaHS.
IN VITRO STUDY
91
Furthermore, the intermediates formed from the radical neutralization are thought to be
more stable due to the hyperconjugation and inductive effects of the additional alkyl groups
(236). Such stabilization of the intermediates can be observed in the formation of carbocations
with alkyne groups too. As a consequence, a more stable and less reactive radical is formed from
the combination of SPRC with a free radical, substantially concluding any radical attack.
IN VITRO STUDY
92
4.3 Significance of Part I
The results in Part I suggested that Aβ
25-35
aggregates in a temperature-dependent manner.
Increasing the temperature of incubation induced Aβ aggregation more significantly in a
temperature-dependent manner with about 20% increase in the aggregation status following a 96-
hour incubation at 37°C.
The incubating temperature of Aβ can determine the aggregation speed and kinetics that
finally control the toxicity. Firstly, increasing temperature promotes β-sheet formation for
successful Aβ aggregation, shown in Aβ
1-40
(266). The study was done in two separate stages:
the first stage (0°C-37°C) saw a rapid transition from reversible coil structure to β-sheet
formation, and the second stage (prolonged incubation at 37°C) demonstrated an accumulation of
β-sheet and oligomerization with the final amount of large molecular weight aggregates
dependent on the initial concentration of Aβ. This strongly suggests that aggregation hinging on
β-sheet formation is an entropy-driven transition that encourages hydrophobic interactions that
are crucial for β-structure stability in solution. Secondly, temperature can induce fibrillization of
Aβ where elongation rates of Aβ fibrils increase dramatically. This was seen in Aβ
1-40
where
initial slopes of elongation profiles were determined at 4°C, 15°C, 25°C and 37°C (267). Since
the initial concentration of Aβ used was constant, the final numbers of fibrils remained the same;
only the rate of formation differed.
Fibrillization status of Aβ determines its neurotoxicity and different temperature of
incubation had also been used previously as treatment protocols (268). Different fibrillization
states of Aβ
1-42
such as mature fibrils (37°C for five days), pre-fibrils (room temperature for two
days) and oligomers (4°C for one day) had been induced and the neurotoxicity investigated.