Bioanalytical strategies for the quantification of xenobiotics in biological fluids and tissues 2
Bạn đang xem bản rút gọn của tài liệu. Xem và tải ngay bản đầy đủ của tài liệu tại đây (624.33 KB, 22 trang )
Chapter 2
21
Chapter 2 Determination of estrogens in ovarian cyst fluid
samples by porous membrane protected micro-solid-phase-
extraction combined with gas chromatography-mass
spectrometry
Chapter 2
22
2.1 Preface to Chapter 2
To compare the levels of estrogens in benign and malignant ovarian tumor
cyst fluids, a cost effective and environmentally friendly extraction technique using
porous membrane protected µ-SPE is described. A sorbent (ethylsilane (C
2
) modified
silica) (20 mg) was packed in a porous polypropylene envelope (2 cm × 1.5 cm)
whose edges were heat sealed to secure the contents. The µ-SPE device was
conditioned with acetone and placed in a stirred (1:5) diluted cyst fluid sample
solution (10 mL) to extract estrogens for 60 min. After extraction, the analytes were
desorbed and simultaneously derivatized with a 5:1 mixture of acetone and N,O-
bis(trimethylsilyl)-trifluoroacetamide. The extract (2 µL) was analyzed by gas
chromatography–mass spectrometry. Various extraction, desorption and derivatization
conditions were optimized for µ-SPE. With this simple technique, low limits of
detection of between 9 and 22 ng L
−1
and linear range from the detection limits up to
50 µg L
−1
were achieved. The optimized method was used to extract estrogens from
cyst fluid samples obtained from patients with malignant and benign ovarian tumors.
The results showed a pattern of higher levels of estrogen accumulation in benign as
compared to malignant samples in the samples tested. This implies that estrogens
might play a role in the malignancy associated with epithelial ovarian cancer along
with other compounding factors.
Chapter 2
23
2.2 Introduction
Estrogens are a group of steroid hormones which primarily function is to
regulate the reproductive systems of both female and male animals and humans. Over
the past several decades, estrogens have received much attention due to their
association with many types of human gynaecological cancer [1]. In 2002, estrogens
were first listed as known human carcinogens by the U.S. Department of Health and
Human Services in its Report on Carcinogens (10th edition), based on sufficient
evidence from human epidemiology studies [2]. These studies showed that use of
estrogen replacement therapy by postmenopausal women is associated with a
consistent increase in the risk of uterine endometrial cancer and a less consistent
increase in the risk of breast and ovarian cancer. Some evidence suggests that use of
oral contraceptives may also increase the risk of breast cancer [2]. The exposure to
estrogens comes from both natural hormones that are secreted by the ovaries (e.g.
17β-estradiol and its metabolite estrone) and synthetic forms (e.g. 17α-
ethynylestradiol and diethylstilbestrol) that are widely found as the ingredient of
medication for estrogen replacement therapy, oral contraceptives, and many cosmetics
[3, 4]. The presence of estrogens in human body fluids such as follicular cyst fluid and
nipple aspirate fluid has been demonstrated by many studies [5-8]. Therefore,
determining the level of estrogens in these body fluids would be very important for
the study of their roles in the carcinogenesis of ovarian and breast cancer.
The role of estrogen in the progression of gynaecological cancers such as
ovarian cancer is well documented [9]. A high correlation was reported between the
presence of certain types of estrogen receptors (ER) and the prevalence of
Chapter 2
24
gynaecological cancers [10]. Determination of estrogens in tumor specimens and
accumulating fluids in the cyst (cyst fluid) could reveal information on the cancer.
Based on this information (estrogen-positive or -negative) the nature of therapy to be
administered to patients, and the prognosis of the cancer may be determined following
assessment of genes responsible or ER positive and negative status [11,12]. The
challenges in determining the quantity of estrogen arises from the fact that (i) the
amount of cyst fluid sample available is very small; and these (ii) samples are
characterized by their complexity. Therefore, high preconcentration with efficient
sample clean up are required for cyst fluid sample analysis. Techniques for extraction
of estrogens in aqueous samples include the established SPE [13], SPME [14] and
more recently, polymer-coated hollow fibre microextraction [15] and stir-bar sorptive
extraction [16]. All these techniques normally require extensive sample clean up from
complex samples such as cyst fluid. Therefore the aim of this study is to develop a
better and alternative procedure for extracting estrogens from cyst fluids, that involves
no or little additional clean up.
A novel, low cost and environmentally friendly extraction technique, called
porous membrane-protected µ-SPE, was used for the extraction of various target
analytes from complex samples without additional sample clean up [17-20]. The µ-
SPE device consists of sorbent enclosed within a ca. 2 cm × 1.5 cm membrane
envelope and is ideally suited to the extraction from a limited amount of sample. The
judicious choice of sorbent materials, and therefore to some extent, the selectivity of
µ-SPE can be fine-tuned. With the protection afforded by the porous polypropylene
membrane, the elimination of substances such as particulates, proteins and humic
substances, which can interfere with the extraction, is easily accomplished without
additional clean up steps [21-23].
Chapter 2
25
The objective of the study is to develop a µ-SPE technique for the
determination of estrogens in benign and malignant human ovarian cyst fluid. This is
the first instance where the µ-SPE technique is applied to human cyst fluid samples.
The information regarding the levels of estrogen in tumor ovarian cyst fluids might
play an important role in disease diagnostics. This work also investigates the
feasibility of applying the simple µ-SPE technique to a complex biological matrix.
2.3 Experimental
2.3.1 Chemicals
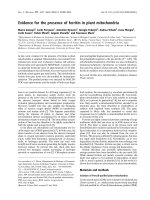
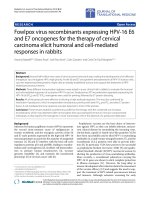
Diethylstilbestrol, estrone, 17β-estradiol, 17α-ethynylestradiol (Figure 2.1)
were purchased from Aldrich (Milwaukee, WI, USA). The HPLC-grade solvents and
N, O-bis(trimethylsilyl) trifluoroacetamide (BSTFA) were purchased from Merck
(Darmstadt, Germany). Chemical standard solutions were diluted with acetone.
Accurel polypropylene flat sheet membrane (200 µm wall thickness, 0.2 µm pore
size) was purchased from Membrana (Wuppertal, Germany). The ethylsilane (C
2
)
modified silica, octylsilane (C
8
) modified silica and octadecylsilane (C
18
) modified
silica, activated carbon, Carbograph, Haye-Sep A and Haye-Sep B sorbents were
purchased from Alltech (Carnforth, Lancashire, UK). The ultrasonicator was bought
from Midmark (Versailles, OH, USA).
Chapter 2
26
Figure 2.1 Chemical structures of the estrogens studied: (a) diethylstilbestrol, (b)
estrone, (c) 17β-estradiol, (d) 17α-ethynylestradiol.
2.3.2 Human cyst fluid samples
Cyst fluid obtained from benign and malignant ovarian tumor samples were
collected following approval from the Domain Specific Review Board, National
Health Group, Singapore. Twenty cyst fluid samples were collected from patients who
were diagnosed to have benign and malignant cysts. Small volumes of cyst fluid were
collected from patients and in initial studies raw cyst fluid samples without dilution
were used for µ-SPE, but this resulted in poor precision and significant matrix
interference. However, sample dilution with ultrapure water to a 1:1 ratio improved
the extraction precision and extraction efficiency. It is probable that the dilution
reduced the extent of interferences by the protein (clogging on the membrane) and the
low viscosity of the matrix that allowed more efficient extraction.
Standard safety precautions were put in place during the handling of body
fluids. All body fluids and solvents used in this project were decontaminated
according to standard biohazard disposal protocols.
Chapter 2
27
2.3.3 GC-MS
Analyses were carried out using a Shimadzu (Kyoto, Japan) QP2010 GC–MS
system equipped with a Shimadzu AOC-20i autosampler and a DB-5 (J & W
Scientific, Folsom, CA, USA) fused silica capillary column (30 m × 0.32 mm internal
diameter, 0.25 µm film thickness). Helium (purity 99.9999%) was used as the carrier
gas at a flow rate of 2.0 mL min
-1
. Samples (2 µL) were injected in splitless mode.
The injection temperature was set at 300
◦
C and the interface temperature kept at
280
◦
C. The GC temperature program used was as follows: initial temperature 90
◦
C
held for 2 min, then increased by 30
◦
Cmin
-1
to 280
◦
C, and held for 2 min. The
standard mixtures and extracts were analyzed in selected ion monitoring mode with a
detector voltage of 1.5 kV.
2.3.4 Preparation of µ-SPE device
The preparation of the µ-SPE device has been described previously [19]. The
µ-SPE device consists of sorbent materials enclosed within a polypropylene sheet
membrane envelope. To prepare the device, the longer edge of a polypropylene sheet
was folded over to a width of ~2 cm. The edge of the fold-over flap was then heat
sealed using an electrical sealer to the main sheet. The fold-over section was then
trimmed off from the main membrane sheet. The former was then cut (at ~1.5 cm
intervals) into individual (2 cm × 1.5 cm) pieces. One of the two open ends of each
piece was then heat-sealed. A glass Pasteur pipet and a glass funnel were used to
introduce sorbent (20 mg) into the resulting membrane envelope via the remaining
open end that was then heat-sealed to secure the contents. Before use, each µ-SPE
device was conditioned (ultrasonication for 10 min with 5mL of acetone) and stored
in the same solvent.
Chapter 2
28
2.3.5 µ-SPE procedure
For extraction, the µ-SPE device after drying in air for few minutes was placed
in 10 mL of sample solution. The sample solution was agitated at 105 rad s
-1
for 60
min to facilitate extraction. The device tumbled freely within the sample during
extraction. After extraction, the device was taken out of the sample solution, dried
thoroughly with lint free tissue and placed in a 500 µL autosampler vial for
desorption. 100 µL of acetone and BSTFA mixture (5:1 ratio) was added and
ultrasonicated for 8 min. After desorption, the µ-SPE was removed from the
desorption vial and the extract (~ 80 µL) was kept in a water bath at 60
◦
C for 20 min.
Keeping the extract in warm condition before analysis will facilitate the derivatization
process especially for biological matrices. Finally, 2 µL of derivatized extract was
injected into the GC-MS for analysis.
2.4 Results and discussion
µ-SPE is an equilibrium based extraction procedure involving the dynamic
partitioning of analytes between the sorbent material and the sample solution [19].
The analytical factors that influence extraction efficiency such as the type of sorbent,
amount of sorbent, extraction time and desorption time, sample pH and ionic strength
were evaluated by a stepwise univariate approach.
0.00E+00
5.00E+05
1.00E+06
1.50E+06
DES
Estrone
Estradiol
Ethynylestradiol
C2
C8
C18
Activated Carbon
Carbograph
HAYE-SEP A
HAYE-SEP B
Peak area
Chapter 2
29
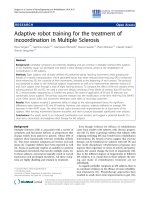
Figure 2.2 Suitability of various sorbents for µ-SPE from spiked samples. Samples
were spiked at levels of 10 µg L
-1
of each analyte. µ-SPE conditions: samples were
extracted for 30 min with 5-min desorption by ultrasonication using 150 µL of
acetone, and 20 min derivatization at 60
◦
C; 15 mg of sorbent was used.
Initially, the selection of a suitable sorbent was considered. Various sorbents
including ethylsilane (C
2
) modified silica, octylsilane (C
8
) modified silica and
octadecylsilane (C
18
) modified silica, activated carbon, Carbograph, Haye-Sep A and
Haye-Sep B were evaluated (Figure 2.2). Estrogens are polar compounds and
appeared to have greater interaction with the relatively polar C
2
sorbent compared
with the others under acidic (pH 2) condition. After selecting C
2
as a suitable sorbent,
the amount of sorbent material was varied from 6 to 20 mg. It was found that with
increasing sorbent amount, the extraction efficiency increased, as denoted by higher
peak areas during GC-MS analysis (Figure 2.3). Placing >20 mg of sorbent in to an
envelope made the device too large to fit into the autosampler vial. As a result,
desorption was not efficient since the device could not be immersed completely in the
solvent. Thus, 20 mg of sorbent was the maximum amount used in all experiments.
0.00E+00
2.00E+06
4.00E+06
6.00E+06
DES
Estrone
Estradiol
Ethynylestradiol
Peak Area
6 mg
10 mg
15 mg
20 mg
Figure 2.3 Effect of sorbent mass on µ-SPE from spiked samples. Samples were
spiked at levels of 10 µg L
-1
of each analyte. µ-SPE conditions: samples were
Chapter 2
30
extracted for 30 min with 5-min desorption by ultrasonication using 150 µL of
acetone and 20 min derivatization at 60
◦
C.
The effect of extraction time was investigated since mass transfer is a time-
dependent process. Extractions of between 10 and 60 min were studied in order to
determine the adsorption profile of the estrogens (Figure 2.4). To facilitate mass
transfer and to decrease equilibration time, the sample was stirred at 105 rad s
-1
continuously at room temperature. During extraction, the mass transfer of analyte
from the sample solution to the sorbent determines the extraction efficiency [18]. A
longer extraction time (60 min) gave better analyte enrichment; probably more time
was required for the analyte to diffuse through the porous membrane, and onto the
sorbent material. Since the total time was considerable (88 min comprising of 60 min
for extraction and 28 min for desorption and derivatization), we did not further extend
the extraction time, and 60 min was selected.
0.00E+00
4.00E+06
8.00E+06
1.20E+07
DES
Estrone
Estradiol
Ethynylestradiol
Peak area
10min
20min
30min
40min
50min
60min
Figure 2.4 Extraction time profiles of estrogens. Samples were spiked at levels of 10
µg L
-1
of each analyte. µ-SPE conditions: samples were desorbed by ultrasonication
using 150 µL of acetone for 5 min, 20 min derivatization at 60
◦
C; 15 mg of sorbent
was used.
Chapter 2
31
The salting-out effect has been widely used to enhance the extraction
efficiency of polar compounds in extraction and microextraction techniques [13-16].
Addition of salt decreases the solubility of polar analytes in aqueous samples [24, 25]
and thus, in this case, favours extraction by the sorbent. The effect of salt on
extraction efficiency was determined by adding sodium chloride (NaCl) (from 5 to
30% (w/v)) to the sample. The highest peak areas were obtained when 5% NaCl was
used.
0.00E+00
5.00E+06
1.00E+07
1.50E+07
DES Estrone Estradiol Ethynylestradiol
Peak Area
0%
5%
10%
20%
30%
Figure 2.5 Ionic strength profile of estrogens for different salt concentrattion.
Samples were spiked at level of 5 µgL
-1
of each analyte. µ-SPE conditions: samples
were extracted for 60 min with 100 µL of acetone as desorption solvent, 20 min
derivatization at 60
◦
C; 15 mg of sorbent was used.
Estrogens are ionisable compounds and their extraction behaviour at different
sample pH (from 2 to 12) was investigated. Sample pH was adjusted by the addition
of 1M hydrochloric acid and 1M sodium hydroxide respectively. At a sample pH of 2,
better extraction efficiency was achieved when compared to neutral or basic
conditions. Acidic sample pH had previously been used for extracting these
compounds [26]. Based on this, a sample pH of 2 was used for further experiments.
Chapter 2
32
0.00E+00
6.00E+06
1.20E+07
1.80E+07
DES Estrone Estradiol Ethynylestradiol
Peak Area
pH=2
pH=4
pH=6
pH=8
pH=10
pH=12
Figure 2.6 Effect of Sample pH. Samples were spiked at level of 5 µgL
-1
of each
analyte. µ-SPE conditions: samples were extracted for 60 min with 100 µL of acetone
as desorption solvent, 20 min derivatization at 60
◦
C; 15 mg of sorbent was used.
After extraction, analytes were desorbed in the organic solvent via
ultrasonication. To select a suitable desorption solvent, various organic solvents were
tested including acetone, methanol, toluene, dichloromethane, and hexane. Since
BSTFA reacts with methanol, acetone was found to be the best desorption solvent as
the highest peak areas were obtained using it. This could be because estrogens are
polar compounds so they are preferentially desorbed by relatively polar solvents
rather than by the less polar solvents such as hexane and toluene.
0.00E+00
3.00E+06
6.00E+06
9.00E+06
DES Estrone Estradiol Ethynylestradiol
Acetone
Methanol
Dichloromethane
Toluene
Hexane
Peak area
Chapter 2
33
Figure 2.7 Desorption solvent profile of estrogens. Samples were spiked at level of 5
µgL
-1
of each analyte. µ-SPE conditions: samples were extracted for 60 min with 100
µL of acetone as desorption solvent, 20 min derivatization at 60
◦
C; 15 mg of sorbent
was used.
The effect of desorption time with an acetone:BSTFA mixture (5:1) was also
investigated. After extraction, the analyte-enriched sorbent was ultrasonicated from 2
to 10 min and kept at 60
◦
C for 20 min to complete the derivatization. Figure 2.5 shows
the profile at different desorption times; an 8 min desorption time appears to be
optimum for all analytes. After 8 min there was a slight decrease in the desorption
profile; this could conceivably be due to the analytes being re-adsorbed by the sorbent
material.
0.00E+00
5.00E+06
1.00E+07
1.50E+07
2 min
4 min
6min
8 min
10 min
Peak area
Ethynylestradiol
Estradiol
Estrone
DES
Figure 2.8 Desorption profile of estrogens for different ultrasonication times.
Samples were spiked at level of 5 µgL
-1
of each analyte. µ-SPE conditions: samples
were extracted for 60 min with 100 µL of acetone as desorption solvent, 20 min
derivatization at 60
◦
C; 15 mg of sorbent was used.
To improve the sensitivity and the selectivity of estrogen determination by
GC-MS, in general, their derivatization is important [27-29]. It has been reported that
excessive or inadequate amounts of BSTFA leads to poor derivatization results [30].
Therefore careful optimization was performed. Different volume ratios of (1:1, 1:2,
Chapter 2
34
2:1 and 5:1) extract:BSTFA were evaluated. An extract:BSTFA ratio of 5:1 by
ultrasonication gave the highest peak areas with no additional peaks. Comparing with
our previous method, polymer-coated hollow-fibre microextraction of estrogens [15],
the current procedure gave similar results.
The optimized extraction conditions used for this study were as follows; C
2
sorbent, 20mg sorbent mass, 60 min extraction time, 5% Ionic strength, pH 2, acetone
as desorption solvent, 8 min desorption time and extract and 5:1 as
extract:deivatization agent.
After each extraction, the µ-SPE device was cleaned with 2 mL of toluene for
2 min (ultrasonication) to remove the residual analytes. The same µ-SPE device was
again desorbed for 8 min with acetone BSTFA solvent mixture (5:1 ratio) to test the
carryover effect. No estrogen peaks were detected clearly indicated the µ-SPE was
reusable. In this study, we were able to reuse the µ-SPE device up to 20 times without
compromising the extraction efficiency.
2.4.1 Linearity, limits of detection and repeatability
The linearity of the calibration curve was examined for each target estrogen
using an aqueous standard solution of a concentration range of 0.5- 50 µgL
-1
of the
analyte. Extraction was performed under the optimized conditions as determined
above. The results are shown in Table 2.1. Good linearity with correlation coefficients
(r) of between 0.996 and 0.999 were obtained. This allowed the quantification of the
compounds by the method of external standardization. The limits of detection (LODs)
for the analytes at a signal-to-noise ratio of 3 under GC-MS selective ion monitoring,
ranged between 9 and 22 ng L
-1
(Table 2.1). While determining the LODs, blanks
were carried out to re-confirm that no sample carryover occurred. The LODs of the
proposed method were comparable with previously reported SPE and SPME methods
Chapter 2
35
[13, 14]. The relative standard deviations (RSDs) of the determinations (n = 3) of the
analytes were between 4 and 11%.
To assess the performance of µ-SPE, one of the cyst fluid samples (with pre-
determined (using the present technique) concentrations of 17β-estradiol at 3.4 µgL
-1
and 17α-ethynylestradiol at 0.63 µgL
-1
) were spiked at 10 µgL
-1
concentrations of
each of the analytes. The extraction results are shown in Table 2.2; for µ-SPE, the
relative recoveries, which is defined as the ratio of GC peak areas for the analytes in
the spiked cyst fluid extract to the spiked ultrapure water extract, ranged between 86
and 97%. The high relative extraction recoveries of µ-SPE also indicated that matrix
effects were negligible at 1:1 dilution. The RSDs (n = 6) were calculated to be
between 13 and 18% for cyst fluid samples. The inter-day and intra-day RSDs were
also measured; they were less than 18% for all analytes, suggesting that the µ-SPE
reproducibility could be further improved by using internal standard. Taking into
consideration the complexity of the samples under study, these results are acceptable.
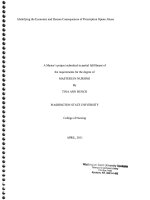
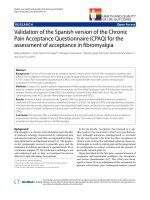
Figure 2.9 GC-MS trace of (I) Benign ovarian cyst fluid sample; (II) Malignant
ovarian cyst fluid sample. Peak identification: (1a, 1b) diethylstilbestrol isomers, (2)
estrone, (3) 17β-estradiol, (4) 17α-ethynylestradiol. Experimental conditions are given
in the text. (The desired peaks were extracted from the overlay chromatogram)
Chapter 2
36
2.4.2 Sample analysis
For the current study, cyst fluids from malignant and benign ovarian cancer
tumor, under serous, mucinous, clear cells and endometroid subtypes were subjected
to µ-SPE-GC-MS to determine the concentration of estrogens. A total of 10 samples
collected from patients with malignant stage (7 early and 3 late) and 10 samples from
patients with benign stage were analyzed. Before extraction, these samples were
diluted with deionized water at 1:1 ratio to address matrix interferences. Extractions
were performed under the previously determined conditions. The Mann-Whitney U-
test was used to compare the concentrations of estrogens between benign and
malignant ovarian cyst fluid samples. All P values are given for two-sided tests and P
< 0.05 was considered significant. Analyses were done using SPSS 13.0 for Windows
(SPSS, Chicago, IL, USA).
Chapter 2
37
Table 2.1
Quantitative data of µ-SPE.
Estrogens
Linearity range
(µg L
-1
)
Coefficient of
correlation (r)
RSD
(%, n = 3)
Limits of
detection (ng L
-1
)
Limits of
quantitation (ng L
−1
)
D Diethylstilbestrol
0.5–50
0.998
8
9
27
Estrone
0.5–50
0.998
4
14
42
17β-Estradiol
0.5–50
0.996
11
22
65
17α-Ethynylestradiol
0.5–50
0.999
9
19
60
Table 2.2
Relative recoveries of µ-SPE
Estrogens
Concentrations detected
in benign samples µg L
-1
Amount detected in samples spiked
with 10 µg L
-1
of each estrogens
Relative
recovery (%)
RSD (%)
(n =6)
Diethylstilbestrol
nd
9.1 ± 1.4
91
16
Estrone
nd
8.6 ± 1.3
86
16
17β-Estradiol
3.4
12.1 ± 1.5
90
13
17α-Ethynylestradiol
0.63
10.3 ± 1.8
97
18
Chapter 2
38
Table 2.3
Concentrations of estrogens detected in malignant and benign ovarian cyst fluid samples (n = 3).
Estrogens
*,
a
Mean concentration in µg L
-1
Malignant samples (A-E, K-O)
Benign samples (F-J, P-T)
A
B
C
D
E
K
L
M
N
O
F
G
H
I
J
P
Q
R
S
T
Diethylstilbestrol
0.39
nd
nd
nd
nd
0.3
0.2
nd
0.2
nd
0.2
nd
nd
nd
nd
nd
0.6
0.1
nd
nd
Estrone
3.02
2.12
1.8
2.3
2
1.2
2.7
2
1.8
2.2
3.7
2.5
3.5
2.1
4.4
2.2
1.7
2.5
3.35
3.08
17β-Estradiol
6.25
9.15
6.7
4.4
4.5
5.4
5.3
4.9
3.4
8.9
13
11
8.6
13
8.9
8.9
7.3
9.9
12
8.67
17α-Ethnylestradiol
4.2
3.4
3.3
3.3
2.3
3.2
2.8
1.9
2.5
3.1
4.6
4.9
3.9
5.8
5.9
3.1
4
3.6
2.2
3.45
nd - not detected
* Malignant and benign data were combined based on cyst type, respectively.
a
Concentrations in raw cyst fluid samples.
Chapter 2
39
Estrogens were detected in most of the cyst fluid samples obtained from patients
with malignant and benign ovarian tumors (Table 2.3). Estrogen compounds 17β-
estradiol and 17α-ethynylestradiol were present in higher levels in benign samples.
Except for diethylstilbestrol (1.21 times more in malignant cases) all the other three
estrogen metabolites were present in higher concentration in benign samples (estrone
(0.73 times more in benign samples), 17β-estradiol (0.58 times more in benign samples)
and 17α-ethynylestradiol (0.72 times more in benign samples). Figure 2.6 shows a GC-
MS trace of an extract of malignant and benign cyst fluids.
Our studies showed a pattern of higher levels of estrogen accumulation in benign
samples as compared to malignant samples in the samples tested. Previous studies have
demonstrated the conversion of circulating estrone sulphate to 17β-estradiol by the tumor
tissue could be one important reason for raised serum 17β-estradiol levels in
postmenopausal women with ‘non estrogen- producing’ ovarian tumors [31,32]. Benign
serous cyst fluid samples obtained from ovarian cysts were found to contain high level of
17β-estradiol and 17α-ethynylestradiol compared to malignant samples. These results
showed the impact of estrogens levels on malignant transformation of benign cyst fluids
to some extent.
2.5 Conclusion
The simple porous membrane protected µ-SPE technique was used successfully in
conjunction with GC-MS, to determine estrogens in complex ovarian tumor cyst fluid
samples. The protection afforded by the porous membrane precluded the need for sample
cleanup prior to extraction; in fact, µ-SPE is a single-step cleanup and preconcentration
Chapter 2
40
approach. Using the most suitable extraction conditions, µ-SPE has been shown to be an
efficient and effective method for the processing of complex biological samples without
the use of large amounts of toxic organic solvents.
Based on this preliminary study on 20 samples, our results showed that estrogens
might play a role in the malignancy associated with epithelial ovarian cancer along with
other compounding factors. Analysis on larger numbers of clinical samples is required for
a better understanding of the role of these compounds in the progression of ovarian
cancer. From the results obtained using the µ-SPE technique, we infer that we might be
able to obtain a clear trend between the levels of the metabolites and the nature of tumor
(benign or malignant) if a large number of samples are subjected to this technique. µ-SPE
has been demonstrated to be capable of dealing with limited volume of cyst fluid
samples.
Chapter 2
41
2.6 References
[1] Gadducci, A. Fanucchi, S. Cosio, A.R. Genazzani, Anticancer Res. 17 (1997)
3793.
[2] Report on Carcinogens, 10th Edition, U.S. Department of Health and Human
Services, Public Health Service, National Toxicology Program, NC, USA, Federal
Register: December 17, 2002 (Volume 67, No. 242) pp. 77283–77285.
[3] Y. Allen, Environ. Toxicol. Chem. 18 (1999) 1791.
[4] C. Desbrow, E.J. Routledge, G.C. Brighty, J.P. Sumpter, M. Waldock, Environ.
Sci. Technol. 32 (1998) 1549.
[5] R.T. Chatterton Jr., A.S. Geiger, S.A. Khan, I.B. Helenowski, B.D. Jovanovic,
P.H. Gann, Cancer Epidemiol. Biomarkers Prev. 13 (2004) 928.
[6] V.L. Ernster, M.R. Wrensch, N.L. Petrakis, E.B. King, R. Mike, J. Murai, W.H.
Goodson III, P.K. Siiteri, J. Natl. Cancer Inst. 79 (1987) 949.
[7] D.P. Rose, Cancer Detect. Prev. 16 (1992) 43.
[8] C. Harding, O. Osundeko, L. Tetlow, E.B. Faragher, A. Howell, N.J. Bundred, Br.
J. Cancer 82 (2000) 354.
[9] K.R. Kalli, S.V. Bradley, S. Fuchshuber, C.A. Conover, Gynecol. Oncol. 94
(2004) 705.
[10] K. Jarzabek, M. Koda, L. Kozlowski, H. Mittre, S. Sulkowski, M. Kottler, S.
Wolczymski, Eur. J. Cancer 41 (2005) 2924.
[11] H. Arias-Pulido, H.O. Smith, N.E. Joste, T. Bocklage, C.R. Qualls, A. Chavez,
E.R.Prossnitz, C.F. Verschraegen, Gynecol. Oncol. 114 (2009) 480.
[12] S. Tangjitgamol, S. Manusirivithaya, J. Khunnarong, S. Jesadapatarakul, S.
Tanwanich, Int. J. Gynecol. Cancer 19 (2009) 620.
[13] A. Salvador, C. Moretton, A. Piram, R. Faure, J. Chromatogr. A 1145 (2007)
102.
[14] J. Carpinteiro, J.B. Quintana, I. Rodriguez, A.M. Carro, R.A. Lorenzo, R. Cela, J.
Chromatogr. A 1056 (2004) 179.
[15] C. Basheer, J. Akhila, K.K. Meng, S. Valiyaveettil, H.K. Lee, J. Chromatogr. A
1100 (2005) 137.
[16] C. Almeida, J.M.F. Nogueira, J. Pharm. Biomed. 41 (2006) 1303.
[17] C. Basheer, H.K. Lee, J. Chromatogr. A 1057 (2004) 163.
Chapter 2
42
[18] C. Basheer, A.A. Alnedhary, B.S.M. Rao, S. Valiyaveettil, H.K. Lee, Anal.
Chem. 78 (2006) 2853.
[19] C. Basheer, H.G. Chong, T.M. Hii, H.K. Lee, Anal. Chem. 79 (2007) 6845.
[20] C. Basheer, K. Narasimhan, M. Yin, C. Zhao, M. Choolani, H.K. Lee, J.
Chromatogr. A 1186 (2008) 358.
[21] S. Andersen, T.G. Halvorsen, S. Pedersen-Bjergaard, K.E. Rasmussen, L. Tanum,
H. Refsum, J. Pharm. Biomed. Anal. 33 (2003) 263.
[22] T.S. Ho, T.G. Halvorsen, S. Pedersen-Bjergaard, K.E. Rasmussen, J. Chromatogr.
A 998 (2003) 61.
[23] Y. Yamini, C.T. Reimann, A. Vatanara, J.A. Jönsson, J. Chromatogr. A 1124
(2006) 504.
[24] C. Basheer, V. Suresh, R. Renu, H.K. Lee, J. Chromatogr. A 1033 (2004) 213.
[25] J. Beltran, F.J. Lopez, F. Hernandez, J. Chromatogr. A 885 (2000) 389.
[26] P.D. Okeyo, N.H. Snow, J. Microcolumn Sep. 10 (1998) 551.
[27] D.D. Fine, G.P. Breidenbach, T.L. Price, S.R. Hutchins, J. Chromatogr. A 1017
(2003) 167.
[28] C. Kelly, J. Chromatogr. A 872 (2000) 309.
[29] A. Shareef, M.J. Angove, J.D. Wells, B.B. Johnson, J. Chromatogr. A 1095
(2005) 203.
[30] A. Shareef, M.J. Angove, J.D. Wells, J. Chromatogr. A 1108 (2006) 121.
[31] J.C. Chura, C.H. Blomquist, H.S. Ryu, P.A. Argenta, Gynecol. Oncol. 112 (2009)
205.
[32] D. Kirilovas, K. Schedvins, T. Naessen, B.V. Schoultz, K. Carlstrom, Gynecol.
Endocrinol. 23 (2007) 25.