Bioanalytical strategies for the quantification of xenobiotics in biological fluids and tissues 4
Bạn đang xem bản rút gọn của tài liệu. Xem và tải ngay bản đầy đủ của tài liệu tại đây (616.67 KB, 24 trang )
Chapter 4
75
Chapter 4 Screening of PCB congeners from ovarian tumor
cyst fluids using GC-MS with compound composer database
software for simultaneous analysis
Chapter 4
76
4.1 Preface to chapter 4
This investigation was performed to profile the level of polychlorinated
biphenyls congeners in ovarian tumor cyst fluid samples to reveal the association of
these persistent organic pollutants in the disease progression. A simple method using
porous membrane protected µ-SPE coupled with GC-MS was used for the
simultaneous quantization of 209 PCB congeners in a single GC-MS run. Each
congener was individually detected and the concentration was calculated using the
response factor for a group congener with the same number of chlorine atoms. This is
the first research work of its kind to be carried out and the method showed good
linearity of the standard calibration solutions over a concentration range of 0.50 to
100 µg L
-1
, and good linearity with correlation coefficients of 0.9878–0.9999 were
obtained. LODs for the analytes at a signal-to-noise ratio of 3 under GC-MS selective
ion monitoring, ranged between 6 and 29 ng L
−1
. The relative recoveries ranged from
81.8 to 102% with RSD values between 7.8 and 16.5%. These results further
demonstrated that the µ-SPE–GC–MS system is highly effective for analyzing trace
PCBs in tumor cyst fluid samples. From the 30 benign and malignant samples, 87
PCB congeners were detected, of which, 13 congeners present in more than 60% of
the samples. Most of the total PCBs mean levels are significantly elevated in
malignant samples. Each congener is individually detected and the concentration is
calculated and the values show the higher levels of most persistent and abundant
congeners, namely, CB-153 and CB-110. This investigation is significant in the
research on the influence of persistent organic pollutants on the tumor malignancies.
Chapter 4
77
4.2 Introduction
PCBs are a class of persistent organic pollutants POPs and lipophilic human-
made compounds widely used in industrial and consumer products for decades before
their production was banned in the United States and other developed countries in the
late 1970s. PCBs remain ubiquitous environmental contaminants because of their
extensive use and persistence. Furthermore, they are distributed globally via the
atmosphere, oceans, and other pathways, PCBs released in one part of the world have
contaminated even remote regions far from their source of origin [1, 2]. The half-life
of PCBs in the blood ranges from < 1 to > 10 years, depending on the congener [3, 4].
PCBs can be measured in most of the general population because of their
environmental ubiquity and persistence. For instance, in a report of a large and
statistically representative sampling of 1,800 individuals 12 years of age and older
from the U.S. population, 31 of 35 PCB congeners measured were detected in over
60% of serum samples, and 21 congeners were detected in over 95% of samples [5].
The general population is exposed primarily through ingestion of contaminated foods
(e.g., fish, meat, and dairy products), although occupational, ambient, and indoor
sources of exposure may exist as well [6-11]. Exposure to PCBs can result in an inter-
nal dose to the female reproductive tract, as PCBs have been measured in human
follicular fluid [12-14], ovarian tissue [15], placenta, uterine muscle, and amniotic
fluid [16], providing evidence of exposure to critical tissues and fluid of reproductive
system.
PCBs have been associated with a range of adverse health effects. A large
number of studies have reported that some PCB mixtures possess diverse deleterious
Chapter 4
78
effects including carcinogenicity. Many have been shown to disrupt development and
functioning of certain endocrine pathways, to alter growth, development, cognitive
function, and to exhibit immunotoxicity in experimental animals, biota, and humans
[17, 18]. In 1999 the Agency for Toxic Substances and Disease Registry (ATSDR)
stated in their updated Toxicological Profile for Polychlorinated Biphenyls that,
“Overall, the human studies provide some evidence that PCBs are carcinogenic” [19].
Many higher-chlorinated biphenyls, persistent and predominant in foods, are active as
promoters in carcinogenesis. Lower-chlorinated biphenyls, predominating in indoor
and outdoor air, are more readily metabolized and inhalation of such biphenyls may
expose humans to reactive, possibly carcinogenic intermediates [20].
Measurements of the PCBs or their metabolites in body tissues and fluids
(often called biological monitoring) have been carried out as useful approach for
assessing the exposure risk in the epidemiological studies. It tries to assess how much
of a contaminant can be absorbed by an exposed target individual and how much of
the absorbed quantity is actually available to create a biological effect. Exposure data
concerning the human reproductive system are essential for risk assessment, to
identify relationships between chemical exposure and diseases or development
abnormalities and to distinguish between exposed and control groups. The data
obtained from contaminant profiling of body fluids, especially tumor cyst fluids, may
provide supporting evidence pertaining to the tumor etiology to some extent.
Unfortunately, the analysis of PCBs and their metabolites in biological fluid and
tissue samples involves complex, and time-and solvent-consuming extraction,
separation and clean-up steps.
Chapter 4
79
Sample preparation and sample amount are critical steps in the analytical
procedure of POPs in human biological fluids. They play an important role and can
influence the results provided by the instrumental techniques in quantitative
determination, which is the final step of the analysis. Classical methods use relatively
large volumes of solvents i.e. 10 to 200 mL, and limit the application of these
methods to adults only [21]. In addition, most of them require fractionation into sub-
samples during sample preparation and/or multiple chromatographic injections.
Recently modern microextraction techniques such as SPME [22], dispersive liquid–
liquid microextraction [23], LPME [24] have been developed for PCB analysis from
biological samples. However, extremely small sample size and meager quantities of
analytes present in the samples drive the need for an more efficient extraction
technique suitable for complex ovarian cyst fluid samples.
Porous membrane-protected µ-SPE is an effective technique for the extraction
of various target analytes from complex samples without additional sample clean up
[25-28]. Previously, µ-SPE has been successfully employed for the ovarian tumor cyst
fluid samples and for the extraction of estrogens by our group [29]. The preparation of
µ-SPE device has been explained in chapter 2.
GC-MS is the most frequently used analytical technique because of its high
sensitivity, selectivity, and flexibility, even for monitoring trace amounts of
chemicals. However, before actual samples can be tested, standards of target
substances must be analyzed for the determination of retention times and the
preparation of calibration curves, which are often affected by subtle differences in
GC-MS conditions [30, 31]. The necessity for standards restricts the number of
Chapter 4
80
chemicals that can be simultaneously analyzed by GC-MS; at the present time, that
number seems to be on the order of hundreds.
To overcome this problem, we employed an analytical approach that can
simultaneously determine 209 PCB congeners by means of GC-MS. For
quantification, exact retention times are essential for correct identification of targets;
standard substances must be analyzed for exact retention times; and preparing all
standards before sample analysis is costly and time consuming. On this basis, new
compound composer database software for simultaneous analysis (Shimadzu) by GC-
MS has been employed to overcome some of the limitations of traditional GC-MS
analysis. The database consists of three databases - mass spectra, retention times, and
calibration curves, all of which are essential for both identification and quantification
of target substances. As long as the GC-MS conditions remain constant, the database
system can be used to predict exact retention times and to obtain reliable
quantification results without prior analysis of standards. In addition, new substances
can be easily added to the database. Therefore, any chemical to which the specified
GC conditions are applicable can be analyzed by means of the system. Moreover, if
similar databases were constructed using different GC conditions, it would
theoretically be possible to analyze, without standards, most of the chemicals to which
GC is applicable.
In this current study, for the first time, µ-SPE coupled with GC-MS with
compound composer database software for simultaneous analysis was used for the
simultaneous quantization of 209 PCB congeners from the malignant and benign
ovarian tumor cyst fluid samples in a single GC-MS run. Each congener is
Chapter 4
81
individually detected and the concentration is calculated using the response factor for
a group congener with the same number of chlorine atoms.
4.3 Experimental
4.3.1 Chemicals
HPLC grade solvent n-Hexane was purchased from Tedia Company. Sodium
chloride & sodium sulfate were ordered from Goodrich Chemical Enterprise
(Singapore). Ultrapure water was prepared from a Nanopure water purification system
(Barnstead, Dubuque, USA). Surrogate standard solution (1 µg mL
-1
) containing
13
C-
Labelled Mono-Deca PCBs, Internal standard solution Perylene-d
12
with a
concentration of 200 µg mL
-1
and PCB standard solution (1 µg mL
-1
; mono- and di-
CB; 2 µg mL
-1
) were purchased from Cambridge Isotope Laboratories, Inc (Andover,
MA, USA). Accurel polypropylene flat sheet membrane (200 µm wall thickness, 0.2
µm pore size) was purchased from Membrana. The ethylsilane (C
2
) modified silica,
octylsilane (C
8
) modified silica and octadecylsilane (C
18
) modified silica, activated
activated carbon, Carbograph were purchased from Alltech (Carnforth, Lancashire,
UK). The Ultrasonicator was bought from Midmark (Versailles, OH, USA).
4.3.2 Preparation of Standards
Standard solutions of the following concentrations: Surrogate standard
solution (20 ng mL
-1
), Perylene-d
12
internal standard solution (2 µg mL
-1
and 20 µg
mL
-1
), PCB standard solution (10 ng mL
-1
) were prepared by stock dilution in hexane.
GC-MS check standard (1µg mL
-1
) was made by diluting 100 µL of the custom
retention index and 10 µL of method 525.2 GC-MS performance check mix in a 10
mL volumetric flask with hexane. Perylene-d
12
was used as an internal standard. All
working solutions and stock standard solutions were stored at 4
˚
C.
Chapter 4
82
4.3.3 Human cyst fluid samples
Cyst fluid obtained from benign and malignant ovarian tumor samples were
collected following approval from the Domain Specific Review Board, National
Health Group, Singapore. Thirty cyst fluid samples were collected from patients who
were diagnosed to have benign and malignant cysts. Small volumes of cyst fluid were
collected from patients and diluted with ultrapure water to a 1:1 ratio to avoid matrix
interferences and to improve the extraction precision and extraction efficiency.
Moreover for complex body fluids, it is probable that the dilution reduced the extent
of interferences by the protein (clogging on the membrane) and the low viscosity of
the matrix that allowed more efficient extraction. Standard safety precautions were
put in place during the handling of body fluids. All body fluids and solvents used in
this work were discarded according to standard biohazard disposal protocols.
4.3.4 GC-MS Analysis
A Restek-PCB capillary column (60 mm × 0.25 mm i.d., df = 0.25 mm,
Restek Coporation, USA) was used. Helium was used as a carrier gas with linear flow
rate of 32.6 cm s
-1
. The injection port and interface temperatures were both set at
280˚C. The GC-MS system temperature was set at 110˚C (hold for 3 min); 15˚C min
-1
to 210˚C; 2˚C min
-1
to 310˚C min
-1
and 5˚C min
-1
to 320˚C (hold for 10 min). 4 µL of
the sample was injected into the GC-MS in splitless mode and the total GC-MS
analysis time was 55.00 min. SIM mode employed for the set of target PCB
compounds. The method file “PCB_RtxPCB.qgm” was obtained from the United
Nations University, Tokyo; and used in this analysis. The retention indices of 209
PCBs are registered in the method file. Correction of retention time was carried out
using n-alkane data.
Chapter 4
83
4.3.5 Preparation of µ-SPE device
The preparation of the µ-SPE device has been described previously of Chapter
2. Briefly, the device consisted of sorbent held within an envelope made from
polypropylene membrane sheet of dimension 2 cm × 1.5 cm. The edges were heat
sealed.
Before use, each µ-SPE device was conditioned (ultrasonication for 10 min with 5 mL
of methanol) and stored in the same solvent.
4.3.6 µ-SPE procedure
For extraction, the µ-SPE device after drying in air for few minutes was
placed in 10mL of sample solution. The sample solution was agitated at 105 rad s
−1
for 60 min to facilitate extraction. After extraction, the device was taken out of the
sample solution, dried thoroughly with lint free tissue and placed in a 500 µL auto
sampler vial for desorption. 100 µL of acetone and BSTFA mixture (5:1 ratio) was
added and ultrasonicated for 8 min. After desorption, the µ-SPE was removed from
the desorption vial and the extract was kept in a water bath at 60
◦
C for 20 min.
Finally, 2 µL of derivatized extract was injected into the GC-MS for analysis.
4.4 Results and discussion
The µ-SPE is the equilibrium based extraction procedure involving the
dynamic portioning of analytes between the sorbent material and the sample solution
[10]. To evaluate µ-SPE, consideration was given to factors that influence extraction
efficiency such as sample size, extraction time and desorption time, desorption
solvents, pH, and ionic strength.
Chapter 4
84
4.4.1 Extraction time
Since µ-SPE involves dynamic partitioning of the PCBs between the sorbent
material and the sample solution, the extraction efficiency depends on the mass
transfer of analyte from the aqueous sample to the solid sorbent phase packed within
the µ-SPE device. The effect of extraction time was examined in this study as mass
transfer is a time-dependent process. The sample was continuously stirred at room
temperature (25˚C) with a magnetic stirrer to aid the mass transfer process and to
decrease the time required for equilibrium to be established. The stirring speed was
fixed at 105 rad s
-1
. The adsorption profile of the PCBs in tumor cyst fluid sample on
the µ-SPE was determined by extracting the analytes for 10 to 40 min. The highest
extraction was achieved at 30 min, and after more than 30 min, no considerable
improvement in peak area response was observed. In fact, for some analytes,
extraction decreases beyond 30 min. This result is often observed in similar extraction
work. Therefore, 30 min was chosen as optimum extraction time.
4.4.2 Type of sorbent materials and ratio of composition
The selection of a suitable sorbent is an important parameter. Various
sorbents including ethylsilane (C
2
) modified silica, octylsilane (C
8
) modified silica
and octadecylsilane (C
18
) modified silica, activated carbon, Carbograph,
(divinylbenzeneethyleneglycoldimethacrylate), and HayeSep B
(divinylbenzenepolyethyleneimine) were evaluated for µ-SPE. C
18
has the highest
hydrophobicity followed by C
8
and C
2
. HayeSep A is of intermediate polarity and
HayeSep B is of high polarity. Different combinations of polar and non-polar (1:1, 10
mg of each) sorbent materials were tested in extracting target analytes (An
unpublished previous experiment showed efficient extraction with combination of
Chapter 4
85
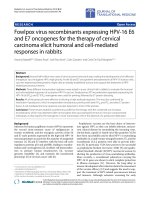
polar and non-polar sorbents for PCBs). A total of six different combinations were
investigated by weighing an equal ratio of two types of sorbent materials within each
µ-SPE device. The combinations tested were: (i) HayeSep A with C
18
; (ii) HayeSep A
with C
8
; (iii) HayeSep A with C
2
; (iv) HayeSep B with C
18
; (v) HayeSep B with C
8
;
(vi) HayeSep B with C
2
(Figure 4.1). Based on peak area analysis, HayeSep A-C
18
was found to be the effective combination for adsorption than others. The moderate to
high hydrophobicity of the mixture was probably most compatible to the analytes
considered.
4.4.3 Sorbent mass
After selecting HayeSep A-C
18
as a suitable sorbent, the suitable amount of
sorbent material (ranging from 5 to 20 mg) was investigated. Obviously, it was found
that with increasing sorbent amount, the extraction efficiency increased, as denoted by
higher peak areas during GC-MS analysis. The auto sampler vial cannot
accommodate more than 20 mg of sorbent material. Thus, 20 mg of sorbent was the
maximum amount used in all experiments.
Chapter 4
86
Figure 4.1 Suitability of various sorbents for µ-SPE from spiked samples. Samples
were spiked at levels of 10 µg L
−1
of each analyte. µ-SPE conditions: samples were
extracted for 30 min with 10 min desorption by ultrasonication; 20mg of sorbent was
used.
4.4.4 Extraction volume
The influence of extraction sample volume (from 10 to 25 mL) on extraction
efficiency was investigated. Larger extraction efficiencies were observed as sample
volumes were increased. This phenomenon is due to increasing analyte enrichment
with increasing volume of the sample. A limit to this enrichment is reached when the
analyte fully saturated with the adsorption sites of the sorbent. The extraction
efficiency was reached at a maximum at 20 mL of sample. Hence, 20 mL was
selected as the optimal sample volume.
4.4.5 Desorption solvent
Selection of a suitable desorption solvent was assessed based on solubilization
capability. Various organic solvents such as methanol, acetone, toluene,
dichloromethane and hexane were tested. Polar solvents such as methanol and acetone
were not effective in desorbing the target analytes as peak areas from analysis of
respective extracts were relatively small. Since PCBs are generally non polar
compounds, they should be more favorably desorbed by non-polar solvents. This
proved to be the case as hexane and toluene gave comparatively better results than the
other solvents, with the latter showing the most favorable performance.
4.4.6 Desorption time and carryover effects
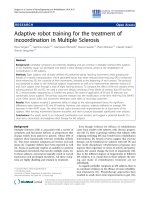
The effect of desorption time over the range of 5 to 20 min was investigated.
All the PCBs were desorbed completely within 15 min of ultra-sonication. Desorption
efficiency was declined when shorter periods of time were used. Above 15 min, no
significant increase in peak area response was observed (Figure 4.2).
Chapter 4
87
Figure 4.2 Desorption time profiles of PCBs. Samples were spiked at levels of 10 ng
L
-1
of each analyte and other optimized µ-SPE conditions were used.
After the first desorption, the µ-SPE device was further desorbed in toluene
for a second time, to investigate carryover effects. No analytes were detected after the
second desorption. Hence, the µ-SPE device could be reused; this could be done by
simply rinsing the used µ-SPE device in ultrapure water, followed by ultra-sonication
(2 min) in methanol.
4.4.7 Quantification of PCB congeners in cyst fluid samples
To access the practical applicability µ-SPE method for PCBs, the optimized
conditions were adopted in the evaluation of the method’s linearity, LODs and
precision (Table 4.1). External calibration lines were plotted using cyst fluid samples
spiked with known concentrations of PCBs ranging from 0.5 to 100 µg L
-1
, and good
linearity with correlation coefficients of 0.9878–0.9999 were obtained. The relative
standard deviations RSDs for samples spiked with 10 µg L
-1
(three replicates) were
less than 20 % showing that this method was acceptable. LODs for the analytes at a
signal-to-noise ratio of 3 under GC-MS selective ion monitoring, ranged between 6
and 29 ng L
−1
(Table 4. 1).
Chapter 4
88
µ-SPE is a non-exhaustive procedure; therefore, relative (rather than absolute)
recoveries and RSDs were calculated on the basis of three extractions of raw sample
(with pre-determined (using the present technique) PCB concentrations) spiked at 10
µg L
-1
of each of the analytes. The relative recoveries ranged from 81.8 to 102%
(Table 4.1) with RSD values between 7.8 and 16.5%. These results further
demonstrated that the µ-SPE–GC–MS system is highly effective for analyzing trace
PCBs in tumor cyst fluid samples.
4.4.8 Sample analysis
For the current study, cyst fluids from malignant and benign ovarian cancer
tumor, under serous, mucinous, clear cells and endometroid subtypes were subjected
to µ-SPE-GC–MS to determine the concentration of PCBs. A total of 15 samples
collected from patients with malignant stage and 15 samples from patients with
benign stage were analyzed. Before extraction, these samples were diluted with
deionized water at 1:1 ratio to address matrix interferences. Extractions were
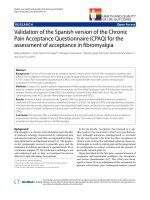
performed under previously determined extraction conditions. The mean PCB
concentrations in benign and malignant cyst fluid samples were shown in the Table
4.2. These results are graphically represented in Figure 4.3, which clearly shows the
significant difference between benign and malignant samples studied. All group
congeners were present significantly higher in malignant samples than benign samples
in terms of mean concentration. Especially di-, hepta-, nano- and deca-CB group
congeners are present highly elevated levels in malignant samples than benign. To
measure the magnitude of the difference, the relative mean concentration of PCBs in
malignant and benign samples were calculated. The C
M
/C
B
values are, 3, 2.8, 2.8 and
Chapter 4
89
2.9 for di-, hepta-, nano- and deca-CB respectively. The values are graphically
depicted in Figure 4.4.
Figure 4.3 Mean concentration profile of PCB congeners in malignant and benign
ovarian tumor cyst fluid samples.
Figure 4.4 Relative means of PCB congeners concentration in malignant and benign
ovarian tumor cyst fluid samples.
One of the strengths of the current study is the ability to measure the levels of
many individual congeners. Overall, sum of the 87 congeners were detected in all 30
samples. 13 congeners were detected in greater than 60% of the sample, among them,
8 congeners were persistent and 5 were non-persistent congeners. CBs assigned as
Chapter 4
90
persistent were those known or expected to have long physiological half-lives in
humans due to high lipid solubility and/or low rates of metabolism [30]. Conversely,
non-persistent congeners were those known to be more readily metabolized and
excreted; these are indicators of recent and/or ongoing PCB exposure.
The mean level of PCBs in different structural groupings and of individual
congeners can be compared in both types of samples. This enables the differentiation
of persistent and non-persistent congeners as well as other relevant congener
groupings (Table 4.3). The maximum level of total PCBs was 0.879 µg L
-1
(mean
0.568 µg L
-1
).
Only 13 individual congeners (8 persistent and 5 non-persistent) were detected
in 60% or more of the samples and total PCBs ranging from 0.082 to 0.32 µg L
-1
.
Malignant groups had significantly higher levels of Total PCBs, ∑13PCB60%, and
∑8PerPCBs. Conversely, non-persistent congeners were found to have marginally yet
significantly higher levels in benign samples than malignant samples (Figure 4.5). No
specific reasons can be drawn, since the number of samples and congeners is
restricted.
Chapter 4
91
Table 4. 1
µ -SPE of PCB congeners: Linearity range, limit of detection and Precision (% RSD).
Congeners
Linearity
range (µg L
-1
)
Coefficient of
correlation (r)
Limits of
detection (ng L
-1
)
Limits of
quantization (ng L
-1
)
RSD
(%, n=3)
Avgerage
recovery (%)
CB-1
0.50 - 100
0.9899
18
59
12.6
81.8
CB-8
0.50 - 100
0.9891
22
68
16.5
98.6
CB-18
0.50 - 100
0.9878
13
41
10.4
98.7
CB-44
0.50 - 100
0.9994
21
60
8.9
90.7
CB-74
0.50 - 100
0.9977
6
20
14.6
101.6
CB-118
0.50 - 100
0.9949
12
35
7.8
93.6
CB-153
0.50 - 100
0.9997
42
125
11
93.5
CB-189
0.50 - 100
0.9999
11
33
9.2
88.9
CB-194
0.50 - 100
0.9998
29
90
13.9
93.2
CB-206
0.50 - 100
0.9996
19
60
8.3
102.5
CB-209
0.50 - 100
0.9924
20
59
14.6
102
Chapter 4
92
Table 4. 2
Concentration of PCBs congeners and ∑PCB found benign and malignant ovarian tumor cyst fluids (mean ±
s.d., n=3).
PCB Congeners
Mean concentration (µg L
-1
)
Malignant samples (n = 15)
Benign samples (n = 15)
Mono-CB
0.012 ± 0.007
0.1± 0.042
Di-CB
0.04 ± 0.003
0.013± 0.008
Tri-CB
0.013± 0.002
0.007± 0.002
Tetra-CB
0.091 ± 0.07
0.07± 0.053
Penta-CB
0.083± 0.03
0.052± 0.034
Hexa-CB
0.023 ± 0.02
0.013± 0.011
Hepta-CB
0.1 ± 0.01
0.04± 0.024
Octa-CB
0.091 ± 0.03
0.062± 0.051
Nona-CB
0.023 ± 0.011
0.008± 0.003
Deca-CB
0.076 ± 0.027
0.026± 0.005
∑PCB
0.552± 0.21
0.391± 0.233
Chapter 4
93
Chapter 4
94
Table 4.3
Total PCB congeners level in ovarian tumor cyst fluid samples (Concentration in µg L
-1
).
Malignant (n =15)
Benign (n=15)
Mean
Min
Max
Mean
Min
Max
∑PCBs
a,b
0.568
0.277
0.879
0.391
0.158
0.524
∑13 PCB60%
a,c
0.231
0.109
0.39
0.201
0.082
0.294
∑8 PerPCBs
a,d
0.188
0.096
0.284
0.132
0.062
0.195
∑5 Non-perPCBs
a,e
0.043
0.013
0.106
0.069
0.02
0.017
a
Values below the detection limit have been replaced by the value midway between the
detection limit and zero.
b
∑Total PCBs: Sum of all PCB congeners tested.
c
∑13PCB60%: Sum of CBs - 28,52,74,87,95,99,101,105,110,118,138,153,180.
d
∑8 PerPCBs: Sum of CBs - 28,74,99,105,118,138,153,180.
e
∑5 Non-perPCBs: Sum of CBs - 52,87,95,101,110.
Of the individual congeners found in 60% or more of the sample, only CB-138
(0.09 µg L
-1
) and CB-74 (0.1 µg L
-1
) were significantly higher in the malignant group.
Similarly CB-52 (0.11 µg L
-1
) and CB-118 (0.083 µg L
-1
) were present in higher level in
benign group of samples. As expected, the most abundant and persistent congener CB-
153 was present in 89% of both samples. Of the 87 congeners detected 9 congeners (CBs
18, 31, 44, 66, 149, 174, 180, 194 and 203) were present in more than 20% of the
samples.
The results indicated that there is a significant disparity between malignant and
benign ovarian tumor cyst fluids in terms of overall total PCBs mean levels. Malignant
cyst fluids shows elevated levels total PCBs in all group congeners compared to benign
samples. Organic compounds including persistent organic pollutants levels in ovarian
tumor cyst fluids had been discussed in chapter three in detail. Compared to those groups
Chapter 4
95
of chemicals (heterocyclic amines, aromatic amines, organic acids, OCPs, PBDEs,
nitrosamines), PCBs shows more significant variation between two groups of samples.
Especially, persistent PCB congeners were present in more than 60% of the samples and
were present in highly elevated levels. This is owing to its persistent nature and its
abundance in the environment. Non-persistent congeners were not significantly differed
among the samples; however the mean levels of total non-persistent PCBs (∑5Non-
perPCBs) slightly higher in benign samples than malignant. This result indicates that the
recent or ongoing exposure of PCBs might not significantly associate with the malignant
transformation of ovarian tumor.
Figure 4.5 Total PCBs profiles: ∑Total PCBs - Sum of all PCB congeners tested,
∑13PCB60% - Sum of 13 PCB congeners present in more than 60%, ∑8 PerPCBs – Sum
of 8 persistent PCBs detected more than 60% of the samples, ∑5 Non-perPCBs - Sum of
5 non-persistent PCBs detected more than 60% of the samples.
Chapter 4
96
4.5 Conclusion
In this present study, porous membrane protected µ-SPE conjunction with GC-MS was
successfully applied to profile the 209 PCB congeners simultaneously in a single run
from ovarian tumor cyst fluid samples. The extraction conditions and choice of sorbent
were optimized for efficient extraction of analytes.
The method was applied to quantitate the PCBs in 30 cyst fluid samples, of which
15 were malignant and 15 were benign cyst fluids. Surprisingly, 87 PCB congeners were
detected, of them 13 congeners which are abundant in environment, present in more than
60% of the samples. Most of the total PCBs mean levels are significantly elevated in
malignant samples. Each congener is individually detected and the concentration is
calculated and the values show the higher levels of most persistent and abundant
congeners, namely, CB-153 and CB-110. This investigation is highly important in the
research on the cumulative effect of persistent organic pollutants on the progression of
ovarian tumor.
Chapter 4
97
4.6 References
[1] R.W. Risebrough, W. Walker Ii, T.T. Schmidt, B.W. De Lappe, C.W. Connors,
Nature, 264 (1976) 738.
[2] J. Dachs, R. Lohmann, W.A. Ockenden, L. Méjanelle, S.J. Eisenreich, K.C. Jones,
Environmental Science and Technology, 36 (2002) 4229.
[3] J.F. Brown Jr, Environmental Science and Technology, 28 (1994) 2295.
[4] D.L. Phillips, A.B. Smith, V.W. Burse, G.K. Steele, L.L. Needham, W.H.
Hannon, Archives of Environmental Health, 44 (1989) 351.
[5] D.G. Patterson Jr, L.Y. Wong, W.E. Turner, S.P. Caudill, E.S. Dipietro, P.C.
McClure, T.P. Cash, J.D. Osterloh, J.L. Pirkle, E.J. Sampson, L.L. Needham,
Environmental Science and Technology, 43 (2009) 1211.
[6] S. Freels, L.K. Chary, M. Turyk, J. Piorkowski, K. Mallin, J. Dimos, H.
Anderson, K. McCann, V. Burse, V. Persky, Chemosphere, 69 (2007) 435.
[7] S. Harrad, C. Ibarra, M. Robson, L. Melymuk, X. Zhang, M. Diamond, J.
Douwes, Chemosphere, 76 (2009) 232.
[8] R.F. Herrick, M.D. McClean, J.D. Meeker, L.K. Baxter, G.A. Weymouth,
Environmental Health Perspectives, 112 (2004) 1051.
[9] R.F. Herrick, J.D. Meeker, R. Hauser, L. Altshul, G.A. Weymouth,
Environmental Health: A Global Access Science Source, 6 (2007).
[10] M. Kohler, J. Tremp, M. Zennegg, C. Seiler, S. Minder-Kohler, M. Beck, P.
Lienemann, L. Wegmann, P. Schmid, Environmental Science and Technology, 39
(2005) 1967.
[11] K. Norström, G. Czub, M.S. McLachlan, D. Hu, P.S. Thorne, K.C. Hornbuckle,
Environment International, 36 (2010) 855.
[12] E. De Felip, A. Di Domenico, R. Miniero, L. Silvestroni, Chemosphere, 54 (2004)
1445.
[13] J.D. Meeker, S.A. Missmer, L. Altshul, A.F. Vitonis, L. Ryan, D.W. Cramer, R.
Hauser, Environmental health : a global access science source, 8 (2009) 32.
[14] E.V. Younglai, W.G. Foster, E.G. Hughes, K. Trim, J.F. Jarrell, Archives of
Environmental Contamination and Toxicology, 43 (2002) 121.
[15] J. Mes, L. Marchand, D.J. Davies, Environmental Technology, 11 (1990) 747.
[16] Z.W. Polishuk, D. Wassermann, M. Wassermann, Environmental Research, 13
(1977) 278.
[17] A. Brouwer, M.P. Longnecker, L.S. Birnbaum, J. Cogliano, P. Kostyniak, J.
Moore, S. Schantz, G. Winneke, Environmental Health Perspectives, 107 (1999)
639.
Chapter 4
98
[18] M. Denham, L.M. Schell, G. Deane, M.V. Gallo, J. Ravenscroft, A.P. DeCaprio,
Pediatrics, 115 (2005) e127.
[19] A.f.T.S.A.D. Registry. (Ed.), U.S. Department of Health & Human Services,
Public Health Service, Washington, DC., 1999.
[20] G. Ludewig, L. Lehmann, H. Esch, L.W. Robertson, Environmental Toxicology
and Pharmacology, 25 (2008) 241.
[21] R. Cariou, J.P. Antignac, P. Marchand, A. Berrebi, D. Zalko, F. Andre, B. Le
Bizec, Journal of Chromatography A, 1100 (2005) 144.
[22] R. López, F. Goñi, A. Etxandia, E. Millán, Journal of Chromatography B:
Analytical Technologies in the Biomedical and Life Sciences, 846 (2007) 298.
[23] X. Liu, A. Zhao, A. Zhang, H. Liu, W. Xiao, C. Wang, X. Wang, Journal of
Separation Science, 34 (2011) 1084.
[24] C. Basheer, H.K. Lee, J.P. Obbard, Journal of Chromatography A, 1022 (2004)
161.
[25] C. Basheer, A. Ali Alnedhary, B.S.M. Rao, S. Valliyaveettil, H.K. Lee, Analytical
Chemistry, 78 (2006) 2853.
[26] C. Basheer, A.A. Alnedhary, B.S.M. Rao, H.K. Lee, Journal of Chromatography
A, 1216 (2009) 211.
[27] C. Basheer, G.C. Han, M.H. Toh, K.L. Hian, Analytical Chemistry, 79 (2007)
6845.
[28] C. Basheer, K. Narasimhan, M. Yin, C. Zhao, M. Choolani, H.K. Lee, Journal of
Chromatography A, 1186 (2008) 358.
[29] S. Kanimozhi, C. Basheer, K. Narasimhan, L. Liu, S. Koh, F. Xue, M. Choolani,
H.K. Lee, Analytica Chimica Acta, 687 (2011) 56.
[30] Y. Yamini, C.T. Reimann, A. Vatanara, J.A. Jönsson, J. Chromatogr. A, 1124
(2006) 57.
[31] T.S. Ho, T.G. Halvorsen, S. Pedersen-Bjergaard, K.E. Rasmussen, J. Chromatogr.
A, 998 (2003) 61.
[32] C. Abernathy, D. Chakraborti, J.S. Edmonds, H. Gibb, P. Hoet, C. Hopenhayn-
Rich, P.D. Howe, Environ. Health, 224 (2001) 551.