Bioanalytical strategies for the quantification of xenobiotics in biological fluids and tissues 7
Bạn đang xem bản rút gọn của tài liệu. Xem và tải ngay bản đầy đủ của tài liệu tại đây (1.02 MB, 30 trang )
Chapter 7
133
Chapter 7 Detection of endorepellin in ovarian tumor serum
and plasma samples by atomic force microscopic imaging
study: Insights to early detection of ovarian tumor
Chapter 7
134
7.1 Preface to Chapter 7
Recent advances in angiogenesis research and vascular biology have led to the
discovery of a powerful angiogenesis protein inhibitor named endorepellin.
Endorepellin is found to be in higher concentration in normal healthy humans and
lower concentration in cancer patients hence it has been identified as a potential
cancer biomarker and therapeutic drug. For the first time, an attempt was made to
apply the atomic force microscopic study on tumor and control serum samples to
compare the levels of endorepellin expression in both tumor and control samples. To
identify and understand the biological activities and chemistry involved,
computational modelling of the protein was done.
Conventional proteomics were done in this study in a bid to differentiate
endorepellin expression in the tumour and control samples. Plasma (n=2) and serum
(n=2) from healthy human and cancer patient were used. Through the Bradford assay,
it was apparent that the total protein concentration for both healthy and cancerous
samples was similar and fall within a range of 69 mg mL
-1
to 75 mg mL
-1
. Protein
profiling was done using one-dimensional polyacrylamide gel electrophoresis (1D
SDS-PAGE) and LG3 was successfully found to be less expressed in cancerous
plasma and serum than in healthy samples. That was further proved by AFM imaging
study on tumor and control serum and plasma samples.
Chapter 7
135
7.1 Introduction
Angiogenesis is the development of new blood capillaries and is widely
involved in several physiologic and pathologic processes such as invasive tumour
growth [1]. In particular, it was first hypothesized by Folkman that tumour-growth is
angiogenesis dependant in 1971 [2]. However, it was only after the discovery of the
first angiogenesis inhibitor and the purification of the first angiogenesis protein in the
mid 1980s that resulted in the widespread acceptance of the concept. The discovery of
an efficacious angiogenesis protein inhibitor named endorepellin in recent times;
signify an exciting potential breakthrough in the detection of tumour cancers and its
subsequent cancer therapies [3].
Endorepellin (85-kDa) is the C-terminal domain of a large modular protein
called Perlecan (~470kDa) which is composing of five structural domains. Perlecan is
a basement membrane heparan sulphate proteoglycan that is involved extensively in
vascular growth and tumour angiogenesis. Endorepellin consists of three laminin-like
globular domains (LG1-LG3) and is found to interact solely with the α2β1 integrin, a
receptor for collagen I, in platelets and endothelial cells.
Being one of the key receptors of endothelial cells, α2β1 provides vital support
for vascular endothelial growth factor (VEGF) signalling, endothelial cell migration,
and tumour angiogenesis [4]. Therefore, by binding to α2β1 integrin, endorepellin
causes disorder to the cell’s cycloskeleton and adhesion properties [5]. On the whole,
endorepellin was shown to inhibit three major steps in angiogenesis namely adhesion,
migration and morphogenesis Research studies had shown that systematic delivery of
human recombinant endorepellin to tumour xenograft mice causes a considerable
suppression of tumour growth and metabolic rate as brought about by a continuous
Chapter 7
136
down-regulation of the tumour angiogenic network [6]. Apart from down-regulating
pro-angiogenic proteins, endorepellin can also attach to endostatin (another matrix-
derived inhibitor of angiogenesis that had been tested in clinical trials) and work
against its anti-angiogenic effects [3]. The superior anti-angiogenic abilities of
endorepellin further strengthen the belief that it will serve as a better biomarker and
therapeutic drug.
In particular, the last laminin-like globular domain, LG3 (~26kDa) is found to
acquire most of the biological activities and thus has most of the anti-angiogenesis
ability. LG3 can interact and be released by partial proteolysis during physiologic and
pathologic processes such as tissue remodelling and cancer growth [7]. This is proven
by the fact that LG3 fragments were found in the urine of patients with end-stage
renal failure and chronic allograft nephropathy, and in the amniotic fluid of pregnant
woman [8-10]. More importantly, it was shown for the first time that circulating LG3
levels in human breast cancer plasma was significantly lower than the LG3 levels in
healthy human plasma, indicating endorepellin, more specifically, LG3 as a potential
biomarker for cancer detection, progression and invasion [11].
Apart from its anti-angeogenis activity and its ability to reduce tumour to a
manageable size or inhibit tumour growth, other intrinsic characteristics of
endorepellin also justify its selection for this study. Being a protein-based inhibitor, it
does not induce resistance and the toxicity is low. It is able to work in low
concentration (i.e. nM) and it may also exert an anti-adhesive action on certain tumour
cells. It shows better anti-angiogenic properties and therefore a greater potential as a
tumour biomarker and therapeutic drug. Endorepellin is found to be in higher
concentration in normal healthy humans and lower concentration in cancer patients.
Chapter 7
137
The malignant transformation of a normal epithelial cell is generally thought
to be caused by genetic alterations or mutations that disrupt the regulation of
proliferation and apoptosis, in turn leading to an altered protein expression and
modification [12]. Alterations in protein levels can be detected not only in the cancer
cells, but also in the blood and other body fluids into which these proteins are
secreted. This can therefore aid in the identification of a normal cell transforming into
a cancerous state. Hence analysis of those body fluids by proteomic studies for
quantification of endorepellin will lead to the clue about the state of the tumour cells.
Electrophoresis is the separation of macromolecules in an electrically charged
field. For this, a support medium such as polyacrylamide or agarose is required. Gel
electrophoresis is a simple way to separate proteins prior to downstream detection or
analysis. PAGE is most commonly used to separate proteins in a sample based on
their molecular weight (or length of polypeptide chain). However, the general
electrophoresis methods cannot be used to separate proteins according to molecular
weight alone because the mobility of a substance in the gel is influenced by both
charge and size. In order to overcome this, the proteins undergoing electrophoresis are
treated with SDS, an anionic detergent, so that proteins have a uniform charge. The
method of SDS-PAGE that is currently being used, involving the use of a Tris-glycine
running buffer to carry out electrophoresis, was first described by Laemmli and is
better known as the Laemmli method [13].
Atomic force microscopy is an imaging technique which permits the
investigation of molecules in their native physiological buffer condition without
subjecting the sample to harsh treatments such as drying, crystallizing or vaporizing in
vacuum, thereby not limiting the range of measurable dynamical properties of the
Chapter 7
138
sample. This feature made this technique highly suitable for topographical imaging of
biological samples [14]. AFM can provide nanometer-resolution images of living cells
in gaseous and liquid environments.
In an AFM, a sharp stylus (approximately tenths of a nanometer) attached to
the end of a cantilever is approached to the surface. As a consequence, a force appears
between the tip and surface that can be attractive or repulsive causing the cantilever to
bend. When this bending is controlled with a feedback algorithm, it is possible to
obtain a topographic map by scanning the surface in a plane perpendicular to the tip.
By using this technique individual protein molecules in aqueous solutions can be
imaged directly at sub molecular resolution. If suitable antibody reagents were
available, this technology could be used to detect the presence of a specific protein by
identifying its protein-antibody complex.
In this present study, the structure and environment of the LG3 domain in the
endorepellin was identified using homology modelling and the presence of
endorepellin in plasma and serum samples was established by conducting
conventional proteomic studies i.e. SDS-PAGE for the quantification, separation and
identification of LG3 domain. Further, the expression of endorepellin in tumour
plasma and serum samples was detected by Atomic force microscopic imaging studies
and compared with control plasma and serum samples.
7.2 Experimental
7.2.1 Chemicals and reagents
Acetic acid, Acetone, Formic acid, Tris base (Merck); Bovine serum albumin
(BSA) standards, Bradford dye, bromophenol blue, dithiothreitol (DTT), glycerol,
glycine, (Sigma-Aldrich); ammonium persulphate, 30% bis/Acrylamide, Precision
Chapter 7
139
Plus protein all blue standards, SDS, N,N,N',N'-Tetramethylethylenediamine
(TEMED) (Bio-Rad Laboratories, Hercules, CA, USA); Silver Stain plus kit (Bio-Rad
laboratories), mouse monoclonal [a74] to heparan sulfate proteoglycan 2 antibody
(Anti-HSPG2) (Abcam, Cambridge, UK),
7.2.2 Water and solutions
Autoclaved water, 1x phosphate-buffered saline (PBS); 5x SDS/Glycine
electrophoresis buffer (15.1 g tris base, 72 g glycine and 5 g SDS); Silver stain
fixative solution (40% methanol, 10% acetic acid (v/v); Silver stain stop solution (5%
acetic acid, 95% water); 2x loading buffer (0.313 M Tris-HCl pH 6.8 at 25
o
C, 10%
SDS, 0.05% bromophenol blue, 50% glycerol, and 0.5 M DTT); upper Tris solution
(0.5 M Tris [pH 6.8], 0.4% SDS); lower Tris solution (1.6 M Tris [pH8.8], 0.4%
SDS); rehydration buffer (7 M urea, 2 M thiourea, 100 mM DTT, 4% CHAPS, 0.5%
carrier ampholytes pH 4–7, 0.01% Bromophenol blue (BPB) and 40 mM Tris).
7.2.3 Hardware and equipment
P-2, P-10, P-20, P-100, P-200 and P-1000 pipettes (eppendorf); 96 well
microtiter plate (Tecan Asia); 0.75 mm spacer plates, short glass plates, gel casting
stand and combs (Bio-Rad Laboratories); GS-800 calibrated densitometer,
UltraRocker Rocking Platform (Bio-Rad Laboratories); Pχ2 programmable thermal
cycler (Thermo Hybraid, Middlesex, TW, USA); bench top microcentrifuge for 0.5-
and 1.5 ml polypropylene tubes (Sanyo Gallenkamp PLC, Loughborough, UK);
PowerWaveX Select Microplate Spectrophotometer (BioTek, Winooski, VT, USA);
pH meter, Weighing Balance (Sartorius).
Chapter 7
140
7.2.4 Computer software
The PyMOL molecular graphics system (DeLano Scientific, Palo Alto, CA,
USA), Accerlys Discovery Studio 2.0 client (Accerlys Inc, San Diego, CA, USA),
KC4 (BioTek, Winooski, VT, USA); PDQuest version 7.2 software package (Bio-Rad
Laboratories,) Gwyddion
TM
2.29 (Czech republic).
7.2.5 Atomic force microscopy
The imaging of endorepellin expression was performed using NanoMan AFM
system (Veeco metrology group, USA) which allows contact and tap mode image,
multichannel data acquisition, and operates under ambient laboratory conditions, in
vacuum, or in solution. The system equipped with calibrated silicon nitride AFM
cantilever (OTR8- 35) with force constant of 0.57 N/m, tip size of 15 nm and resonant
frequency 300 kHz (Veeco).
7.2.6 Preparation of plasma and serum samples
Plasma (n=2) and serum (n=2) samples from a healthy being and ovarian
cancer patient were each obtained from the Department of Obstetrics & Gynaecology,
National University Hospital, Singapore. The fluids were centrifuged at 15,000 rpm
for 10 min at 4˚C. The supernatants were then divided into aliquots of 1 mL, snap
frozen in liquid nitrogen, and stored at -80˚C until analysis.
7.3 Methodology
7.3.1 Homology modelling
Homology Modelling is fundamentally made up of two principles. Firstly, the
structure of a protein is distinctly identified by its amino acid sequence [15]. This
implies that the sequence information alone is sufficient to obtain the protein
structure. Secondly, the structure is more highly conserved than the sequence,
Chapter 7
141
suggesting that the structure is more stable and changes less significantly during
evolution [16]. As such, similar sequences are assumed, and later proven, to fold into
practically identical structures and that distantly related sequences will still adopt
similar structures [17]. It is with these principles that allow modelling of an unknown
target based on the sequence similarity with other homologous proteins that have
known crystal structures. These homologous proteins are referred as templates in this
chapter.
The search for templates was first carried out using the PSI-BLAST and
BLASTp server at NCBI. Unfortunately, the search did not return with substantial
results, thus another technique called the fold recognition was also employed. This
technique specifically searches for similar secondary structures (such as the folding of
alpha helix or beta sheets etc) in addition to searching for similar sequences. Through
LOMETS, an automatic mail server for protein secondary structure prediction,
templates with the highest identities match were obtained (Table 7.1). The templates
were named as according to their Protein Data Bank (PDB) number.
Table 7.1
Top 2 templates results obtained through secondary structure prediction
Template
Title
Source
Resolution
Similarity
Identity
1dyk
Laminin alpha 2
chain LG 4-5 domain
House
mouse
2.00 Å
42.90%
25.00%
1pz7
Modulation of agrin
function by alternative
splicing and Ca
2+
binding
Chicken
1.42 Å
41.60%
21.50%
1dyk + 1pz7
-
-
1.68 Å
42.20%
22.60%
Chapter 7
142
From Table 7.1, it is evident that murine laminin α2LG4-5 domain has the
highest percentage of identity (25%) when matched with the endorepellin LG3
sequence. The low similarity and identity of all the templates are typical of homology
modelling among LG domains [18]. However, the low resolution of 1dyk posed as an
obstacle to creating a good homology model. With respect to this, the templates 1dyk
and 1pz7 were superimposed onto each other in an attempt to resolve the resolution
problem while not comprising much on the identity percentages. The newly generated
multiple sequence alignment was then aligned with the target LG3 sequence (Figure
7.1), thereby creating the basis of the final LG3 homology model. The overall
sequence identity obtained is 22.6% with the model having a resolution of 1.68Å.
7.3.2 Protein quantification, sample preparation, separation and identification
of LG3
7.3.2.1 Total protein quantification by the Bradford assay
The Bradford method is a colorimetric assay technique used to determine
protein concentration in a sample. It uses the Coomassie Brilliant Blue G-250 dye,
which has a maximum absorbance at 595 nm when bound to proteins. The dye binds
primarily to lysine and arginine residues on the protein, where it becomes ionised and
its maximum absorbance increases. The increase in absorbance at 595 nm is thus
proportional to the amount of protein present.
As the Bradford assay is only linear over a short range between 100 and 1500
μg mL
-1
, samples were diluted with a 100 factor before quantification begins.
Therefore, 5 µl of each samples were added with 495 µl of 1x PBS. Next, 250 µl of
the Bradford (Coomassie Brilliant Blue G-250) dye were added to 5 µl of each
standards and samples in a 96-well microtiter plate. Duplicate standards and samples
Chapter 7
143
were prepared and analysed at 595 nm using a micro plate spectrophotometer in each
run so that the average protein concentration could be calculated, thus taking into
account any intra-assay error. The results were then computed with the KC4 program.
The average protein concentration found in plasma and serum samples are 74.942 and
71.569 mg mL
-1
for healthy sample and 74.11 and 70.886 mg mL
-1
for cancer sample
respectively.
7.3.2.2 Acetone precipitation
The purpose of protein precipitation is to concentrate samples that have low
protein concentration, and to remove substances that may interfere with protein
separation by SDS-PAGE e.g. nucleic acids, lipids, polysaccharides and salts.
Acetone denatures the proteins and causes more hydrophobic areas of the protein to
be exposed. This causes the proteins to clump together and form a solid precipitate.
As a sample calculation, 133.436 (≈133.4) µL of healthy plasma and 141.072
(≈141.1) µL of cancer serum were needed in order to precipitate 100 µg of proteins.
Following which, five volumes of ice-cold acetone (667 µL for plasma and 705 µL
for serum) was added into the respective samples and mixed thoroughly, before
incubating overnight at -20 °C.
7.3.2.3 SDS-PAGE
7.3.2.3.1 Assembly of apparatus before casting the polyacrylamide gels
To prepare for casting the polyacrylamide gels, the 0.75 mm spacer and short
plates were cleaned with 70% ethanol. The cleaned 0.75 mm spacer and short plates
were then inserted into the casting frame, placed on the gasket and held together by
the casting stand.
Chapter 7
144
7.3.2.3.2 Preparation of SDS-PAGE
SDS-PAGE gels with 2 different acrylamide concentrations (10 and 12%)
were used in this study. The resolving gel mixture was prepared by mixing the
reagents listed in Table 7.2. The mixture was then loaded into the space between the
glass plates, and the resolving gel was left to polymerize at room temperature for 45
minutes. Once it had polymerized, the stacking solution (also prepared by mixing the
reagents listed in Table 7.2) was loaded above the resolving gel to the top of the short
glass plate. The 10-well Bio-Rad Laboratories comb was cleaned with 70% ethanol
and inserted into the stacking solution. The stacking solution was then left to
polymerise for at least 4 hours at room temperature or left overnight at 4 °C.
7.3.2.3.3 Running SDS-PAGE
Following acetone precipitation overnight, the plasma and serum samples
were thawed to solution before centrifugation at 13000 RPM was applied for 5
minutes. The supernatant was then removed and the pellet was air-dried for 1 minute,
after which, the pellet was re-solubilised in 50 µL of 1x PBS or rehydration buffer and
liquated into 5 aliquots of 10 µL each. 5 µL of re-dissolved sample were used in each
SDS-PAGE run.
The 5 µl of re-dissolved sample was mixed with 5 µl of 2x loading buffer
(0.313 M Tris-HCl, pH 6.8, 10% SDS, 0.05% bromophenol blue (BPB), 50%
glycerol, 0.5 M DTT) such that the resulting sample had a protein concentration of 1
μg/μl. The samples were then heated at 99
o
C for 7 minutes in a thermo-cycler, and
then centrifuged at 13,000 RPM for 10 minutes. 5 µl of protein standard (Precision
plus protein All blue
®
standards), control (2 x loading buffer) and samples were
loaded into the wells once the SDS-PAGE gels had polymerized. A constant voltage
Chapter 7
145
of 100V was applied and electrophoresis was run. Enhanced resolution of low
molecular weight (MW) protein bands was obtained by preparing 12% resolving gel
and increasing the final sample loading volume to 15 µl.
Table 7.2
Composition of mini-size (0.75mm thick) SDS-PAGE gel
Components of SDS-PAGE gel
Stacking gel mixture
Resolving gel mixture
10%
12%
Water
1.75ml
3.75ml
3.15ml
4×Tris (Upper/Lower)
625µl
2.25ml
2.25ml
30%AA
325µl
3 ml
3.6 ml
20%APS
25µl
25µl
25µl
TEMED
10µl
12.5µl
12.5µl
4x Lower Tris (1.6 M Tris, pH 8.8, 0.4% SDS) AA: Acrylamide/Bis Solution
4x Upper Tris (0.5 M Tris, pH 6.8, 0.4% SDS) APS: Ammonium persulphate
7.3.2.3.4 Gel staining
The proteins that have been separated on gels can be made visible by staining
them with dyes or metals. A number of different protein stains exist like the
Coomassie Blue stain, Ruby fluorescent stain and Silver stain. Each type of stain has
its own characteristics and limitations with regard to the sensitivity of detection and
the types of proteins that stain best[19]. In this study, silver staining was chosen as the
method for staining the gels.
Silver Stain Plus kits were used according to manufacturer’s instructions.
After electrophoresis, gels were taken out from the glass plates and placed with care
into plastic containers, which had already been cleaned with concentrated nitric acid
and deionised distilled water. The gels were fixed in approximately 50-100 ml of
fixative solution containing 40% methanol and 10% acetic acid (v/v) overnight on an
Chapter 7
146
UltraRocker Rocking Platform at room temperature. This was followed by rinsing and
washing the gels in deionised distilled water for 30 min. Gels were then stained in
developer solution until desired staining intensity was reached, and placed in 5%
acetic acid for 30 minutes to stop the reaction. The gels were then scanned using a
GS-800 calibrated densitometer and analyzed using the PDQuest version 7.2 software
programs.
7.3.3 AFM Imaging
7.3.3.1 Preparation of sample, substrate and antibody for imaging
The ovarian tumor and control samples were centrifuged at 15,000 RPM for
10 min at 4 °C. The supernatants were then divided into aliquots of 1 ml, snap frozen
in liquid nitrogen, and stored at -80°C until analysis. A stock concentration (1µg mL
-
1
) of anti-HSPG2 antibody in phosphate buffer was prepared. The buffer used was
prepared by dissolving one tablet of phosphate-buffered saline (PBS) in 200 mL
deionized water. The obtained solution consisted of a 10 mM phosphate buffer, 2.7
mM potassium chloride, and 137 mM sodium chloride. The pH of the solution at
25˚C is 7.2. The stock solution can be pipette in small aliquots (1 to 5 mL) into
eppendorf tubes and flash frozen in liquid nitrogen prior to storage at −80°C.
Two important criteria for the substrate preparation in this AFM study are (1)
the antibody affinity to the substrate must be adequately strong so that they can be
immobilized on surface without sacrificing their bio reactivity and (2) the substrate
should be smooth enough so that proteins can easily be identified from AFM
topographies. Mica surface is the most commonly used substrate for protein
adsorption because it is hydrophilic and atomically flat.
Chapter 7
147
The first step was to immobilize the antibody on the substrate. The stock
solution of anti-HSPG2 was diluted 2 and 4 fold into Milli Q water. Twenty
microliters of the Anti-HSPG2 was drawn off with a pipette and deposited on the
freshly cleaved mica substrate. Then the antibody covered mica substrate was
incubated for approximately 20 sec before rinsing in excess Milli Q water to remove
any weakly adsorbed antibody and residual salt deposits. After washing, the substrate
was dried in a stream of dry N
2
gas (1 bar pressure at a distance of several cm).
Rinsing can be achieved by running up to 5 ml of Milli Q water across the mica
sample while it is tilted at a 30 to 45° angle. The AFM imaging was done immediately
after evaporation of the solvent to prevent contaminations.
Subsequently, the target protein in the sample was applied to the antibody
adsorbed mica substrate and allowed to dry under a flow of N
2
gas. Immediately after
solvent evaporation, the antigen-antibody layer washed three times with water to
remove any residual deposits or loosely adsorbed proteins. The samples were then
allowed to dry completely and then incubated in a humid chamber at room
temperature for a specified period (60 min, 30 min) of time. The amount of antibody
binding depends on several factors, including degree of washing with water,
concentration of antibody, and other incubation conditions. The conditions of binding
with surface adsorbed protein are summarized in Table 7.3.
In the control experiments, Anti-HSPG2 was used with the same incubation
times and at the same concentrations as of tumor samples.
Chapter 7
148
Table 7.3
Summary of the Reaction Conditions for tumor plasma, serum, control samples
Sample size
Anti-HSPG2 Conc, µg/mg
incubation time,
h
1
0.5
0.5
0.5
20 µl
0.25
0.5
1
1
0.5
1
0.25
1
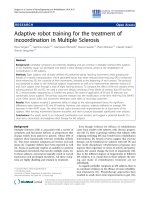
7.4 Results and discussion
7.4.1 Homology Modelling
Being a novel inhibitor of angiogenesis, endorepellin was coined as a
breakthrough in angiogenesis research with its promising capacity as an exceptional
biomarker and cancer therapeutic drug[20]. However, as of today, there is no known
crystal structure of the protein available. Therefore, in an attempt to further
comprehend the molecular factors of the biological activity and the chemistry
involved, computer aided structure model of endorepellin (or more specifically LG3)
was constructed using the 26kDa LG3 fragment sequence (Figure 7.1).
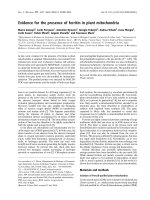
Figure 7.1 Part of human heparan sulphate proteoglycan 2 (HSPG2) sequence,
depicting endorepellin (D3681-S4381) and LG3 (in red G4182-S4381).
Chapter 7
149
Homology modelling methodology was used to construct structure model of
endorephilin, which is based on availability of homologous experimental crystal
structure (template) and proximity of their sequences identities. Two templates (PDB
ID: 1pz7 and 1dyk) were obtained from the database search and these were found to
be having low resolution. To circumvent the problems associated with individual
templates, multi-template paradigm was used (details in methodology section). The
sequence alignment between target (human LG3) and templates is shown in the figure
7.2. The multiple sequence alignment (figure 7.2) in conjunction with experimental
structures was used to generate structural model of human LG3 protein.
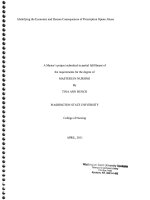
Figure 7.2 Sequence alignments of 1pz7, 1dyk and LG3. Identical alignment of
residues and similar alignment of residues are depicted by dark blue and light blue
colouring respectively. Red boxes depict residues that are found to coordinate to
calcium.
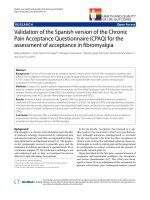
Thus obtained model of LG3 was thoroughly optimized and validated (details
in methodology). The model consists of β-sheets or β-sandwich made up of 15
antiparallel β strands which are depicted as the purple numerical arrows in Figure 7.2.
Most of these predicted β strands also coincides with areas of high identity/homology
between the LG3 sequence and the combined template. More importantly, LG3 was
found to be calcium coordinated by 5 residues namely – Aspartic acid4258,
Leucine4275, Asparagine4323, Alanine4325 and Asparagine4327 (Figure7.3 (A)) and
1
2
3
4
5
5
6
5
7
8
9
10
11
12
13
14
15
Chapter 7
150
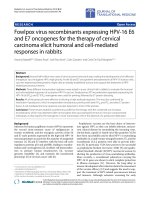
this coordination area is predicted to be the receptor for its biological activities since
calcium ion was also found to be partially exposed. The chemical structures of the
coordinating residues are shown in Figure 7.3 (B).
(A) (B)
Figure 7.3 (A) A ribbon diagram of the LG3 model showing the 15 anti-parallel β
strands (depicted as arrows) and the calcium ion (depicted as the pink sphere). (B)
Diagram showing the calcium ion (green sphere) with 5 coordinating residues. The
values on the dotted yellow lines depict the distance between the 2 species in
angstroms.
7.4.2 Proteomic study
7.4.2.1 Total protein quantification in samples using the bradford assay
The total protein concentration in each of the plasma and serum samples to be
used in this study must be known so that in the subsequent stage of protein separation
by SDS-PAGE, the same amount of protein for each plasma and serum sample is
loaded. This is to ensure that the protein band/spot intensity (which reflects the
amount of that protein present) between different samples will be without bias and can
be compared. The total protein concentration in each of the 2 plasma and serum
samples is shown in Table 7.4 and a sample absorbance versus concentration plot is
shown in Figure 7.4.
Chapter 7
151
Table 7.4
Total protein concentration in samples as measured using the Bradford assay
Sample Type
Total protein concentration (mg/ml)
Average
(mg/ml)
Sample 1
Sample 2
Control plasma
74.075
75.81
74.943
Tumor plasma
73.538
74.685
74.112
Control serum
71.157
71.98
71.569
Tumor serum
69.048
72.723
70.886
Figure 7.4 Sample plot of absorbance vs concentration (mg mL
-1
) for plasma and
serum samples.
From Table 7.4, it can be observed that the total protein concentration in both
healthy and cancerous samples was similar. In addition, the protein concentration
level in serum samples was found to be lower than the concentration level in plasma
samples. This could be explained by the fact that clotting proteins such as fibrinogen
had been removed in serum samples. Generally, this result is expected, as the
concentration differences in healthy and cancerous samples will only be more
prominent when the focus is on the individual biomarker’s concentration and not the
total protein concentration.
Chapter 7
152
7.4.2.2 SDS-PAGE and gel staining
SDS has a very hydrophobic end (the lipid-like dodecyl part) and a highly
charged sulphate group. It interacts with hydrophobic amino acids in proteins and
disrupts the secondary and disulphide bond-linked tertiary structures of the proteins,
which depends largely on interactions between hydrophobic amino acids in their core.
Being anionic, SDS has a negative charge over a wide pH range. Therefore, mixing
the proteins in a biological sample with SDS will result in proteins having the form of
linear polypeptide chains coated with negatively charged SDS molecules.
The polyacrylamide gel is a cross-linked matrix that acts as a three-
dimensional mesh. As the negatively charged protein molecules in the samples are
drawn towards the positively charged anode, they encounter resistance provided by
the polyacrylamide gel, thereby restraining larger molecules from migrating as fast as
the smaller molecules. As the mass to charge ratio is nearly the same for all the SDS-
denatured polypeptides, the final separation of proteins is dependent almost entirely
on the differences in relative molecular mass of polypeptides. The speed of migration
is dependent on the size of the ‘pores’ in the gel mesh which is in turn determined by
the percentage of acrylamide present in the gel.
The polyacrylamide gel consists of 2 parts: the stacking gel and the resolving
gel. The stacking gel is used to form the wells in which the protein sample is loaded.
It has a very low acrylamide concentration, which means that the ‘pores’ in the gel are
large and so the stacking gel does not even inhibit the migration of large proteins.
However, the amino acid residue glycine that is present in the running buffer
surrounding the gels is relatively uncharged at the lower pH (6.8) of the stacking gel,
thus resulting in a slow moving buffer. In contrast, the charged SDS-bound proteins in
Chapter 7
153
the sample are able to migrate much faster through the stacking gel, causing the
proteins to be compressed and ‘stacked’ into a tight band, less than 1 mm thick, at the
running front of glycine before it reaches the resolving gel.
Once the running buffer reaches the resolving gel, glycine is charged at the
higher pH (8.8) and migrates swiftly through the gel. The mobility of the proteins is
thus solely dependent on their mass here. The resolving gel can be of different
“percentage” strength (e.g. 8%, 10%, 15% etc.) depending on the concentration of
acrylamide present in the resolving gel mixture. High percentage gels contain a high
concentration of acrylamide, resulting in small ‘pores’ in the gel. Consequently, low
molecular weight proteins are better separated as they are able to migrate through the
gel better than the larger proteins.
Silver staining is chosen as the method of staining as it is more sensitive and
allows protein spots containing 10-100 nanograms of protein to be easily seen.
Generally in silver staining, silver ions bind to the proteins in the gel, and are reduced
to metallic silver, causing the protein bands in the gel to be visualized [21]. This
method forms the basis of the Silver Stain Plus kit (Bio-Rad laboratories), which was
used for staining in this study. In this method, the proteins are first fixed in the gel
with a solution containing methanol, acetic acid, and glycerol. The gels are then
soaked in a solution containing a silver-ammine complex bound to colloidal
tungstosilicic acid. Silver ions transfer from the tungstosilicic acid to the proteins in
the gel by means of an ion exchange or electrophilic process. Formaldehyde in the
alkaline solution reduces the silver ions to metallic silver to produce the images of
protein bands or spots. In this study, a 5 µL sample loading volume in a 10%
resolving gel SDS-PAGE was first attempted (Figure 7.5).
Chapter 7
154
Figure 7.5 Plasma and Serum protein bands in SDS-PAGE gel (10% resolving gel
with 5 µl of loaded sample). The healthy samples are depicted by “H prefix”, while
cancerous samples are depicted by “C prefix”.
The SDS-PAGE gel using 10% resolving gel and 5 µL of sample loading
volume (Figure 7.5) does not present any significant result. In fact, the 26kDa LG3
protein band cannot be seen in these parameters. These indicate that the loaded
protein volume is too low, resulting in lower concentration proteins not being stained
during the silver staining process. As such, another attempt on SDS-PAGE was done
using 10% resolving gel and 15 µL of loading sample volume (Figure 7.6).
Chapter 7
155
Figure 7.6 Plasma and Serum protein bands in SDS-PAGE gel (10% resolving gel
with 15 µl of loaded sample). The healthy samples are depicted by “H prefix”, while
cancerous samples are depicted by “C prefix”. The red arrows correspond to the LG3
protein band.
In Figure 7.6, the 26kDa LG3 protein band is visible, but barely, due to too
much background staining. This is most likely due to the poor technique and/or
contamination during the silver staining process. With this SDS-gel, it would be
impossible to compare accurately the LG3 intensity differences in healthy and
cancerous samples. In a bid to further improve the quality of the separation, SDS-
PAGE with 12% resolving gel and 15 µl of loading sample volume were attempted.
Chapter 7
156
Figure 7.7 Plasma and Serum protein bands in SDS-PAGE gel (12% resolving gel
with 15 µl of loaded sample). The healthy samples are depicted by “H prefix”, while
cancerous samples are depicted by “C prefix”. The red arrows correspond to the LG3
protein band.
The corresponding SDS-PAGE not only showed a clear visible 26kDa LG3
protein band, it also reflected the band’s intensity differences between healthy and
cancerous samples. This result clearly supported earlier research [22] that the
concentration of endorepellin is down-regulated significantly in cancer patient’s body
fluids and therefore serves as a potential biomarker.
7.4.3 Atomic force microscopic study
AFM is a versatile tool, which allows investigating the protein–protein
interactions from different perspectives. In this study, the interaction between LG3
and its associated antibody is important evidence for its magnitude of presence. The
interaction is highly specific and possesses a high degree of spatial and orientation
specificity. Several substrates were used for the protein complex detection from AFM
Chapter 7
157
topographies. Mica substrate is most commonly used for protein AFM imaging
because of its hydrophilic character, atomically flatness and it provides high affinity
for proteins [22, 23]. As a blank, a freshly cleaved mica substrate was probed by
atomic force microscopy (Figure 7.8 (A)). The average roughness of this substrate
determined by AFM image, recorded under contact mode in air with a commercial
silicon nitride cantilever was found to be about 0.07 nm across an area of 1 µm × 1
µm. According to the size of the proteins (
~
85-KDa) to be studied, mica is suitable for
the observation of such molecule.
The AFM experimental approach reported in this work is based on the
comparison between the AFM topographies and height histograms of antibody mica
surfaces before and after incubation with specific antigens. The height histograms
display a peak, its position is assumed to average height of the structures on the
surface.
In the first step of our experimental procedures, imaging of antibodies
absorbed to mica was preceded. Samples were prepared by passive adsorption anti-
HSPG2 to freshly cleaved mica surface. Thus, antibodies were diluted in PBS in a
concentration of about 1 µg mg
-1
. Figure 7.8 (A) shows the image of mica substrate
before any absorption. Figure 7.8 (B) shows anti-HSPG2 molecules on mica imaged
in contact mode. Most of the anti-HSPG2 molecules are isolated and moderately
homogenously distributed on mica when the concentration is 1 µg mg
-1
and
incubation time is 30 min. In addition, few anti-HSPG2 aggregates formed of two or
more molecules were present. The aggregate formation can be controlled by
optimization of exposure time and pH conditions. Furthermore, the height histogram