Fast and accurate mapping of next generation sequencing data
Bạn đang xem bản rút gọn của tài liệu. Xem và tải ngay bản đầy đủ của tài liệu tại đây (1.68 MB, 185 trang )
Fast and Accurate Mapping of Next
Generation Sequencing Data
Chandana Tikiri Bandara Tennakoon
(B.Sc.(Hons.), UOP )
A Thesis submitted for the degree of
Doctor of Philosophy
NUS Graduate School for Integrative Sciences and Engineering
National University of Singapore
2013
Declaration
I hereby declare that this thesis is my original work and it has been written by me in its
entirety. I have duly acknowledged all the sources of information which have been used
in the thesis. This thesis has also not been submitted for any degree in any university
previously.
Chandana Tikiri Bandara Tennakoon
7th May 2014
Acknowledgements
Starting doctoral studies is like a long journey undertaken by a navigator towards an
unknown destination with only a vague sense of direction. The seas are rough and
weather can be unpredictable. After five years of journey I have reached the shore. This
is how Columbus must have felt when he discovered America.
My journey would have been impossible without the guidance of my supervisor
Dr. Wing-Kin Sung. He was my unerring compass. Switching from my background as
a mathematics student to computer science went rather smoothly mainly because he
identified a suitable topic for me. I am also glad that he emphasized the importance of
developing practical tools to be used by bioinformaticians rather than concentrating
on toy programs. I am very grateful to him for helping me overcome my financial
difficulties and in understanding my family needs. I would also like to thank Prof. Tan
Kian Lee and Assoc. Prof. Leong Hon Wei in taking their valuable time to act as my
thesis advisory committee members.
Next I would like to thank my ship mates Jing Quan, Rikky, Zhi Zhou, Peiyong,
Hoang, Suchee and Hugo Willy. All of your discussions, suggestions and bug reports
helped improve my programs immensely. Without Jing Quan and Rikky, I probably
would have taken double the time to finish some of my projects. You guys also made
the lab a happy place and made me fitter by training with me for the RunNUS. I will
miss the fun times for sure. I also would like to thank Pramila, Guoliang, Charlie and
Adrianto from GIS for their collaborations.
i
A sailor cannot start his journey without a ship and provisions. I like to thank NGS
for their scholarship and School of Computing for recruiting me as a research assistant.
The facilities available at SoC, especially the Tembusu server were excellent. Without
the availability of these resources, processing of NGS data would have been impossible.
A journey through unchartered waters is hazardous. Fortunately, pioneering work by
Heng Li and the availability of open source software, especially the BWT-SW package
which forms a central part in my aligners, guided me immensely. I would also like to
thank all the people who disseminate their knowledge in the forums SEQanswers.com
and stackoverflow.com free of charge.
Finally I would like to thank my wife and two daughters for their patience. You
kept me motivated and happy during hard times.
ii
Contents
List of Figures
ii
Summary
ix
List of Abbreviations
xi
1 Introduction
1
1.1
Introduction . . . . . . . . . . . . . . . . . . . . . . . . . . . . . . . . . .
1
1.2
Next Generation Sequencing . . . . . . . . . . . . . . . . . . . . . . . . .
2
1.2.1
Algorithmic Challenges of NGS . . . . . . . . . . . . . . . . . . .
4
Applications of Sequencing . . . . . . . . . . . . . . . . . . . . . . . . .
5
1.3.1
De novo Assembly of Genomes . . . . . . . . . . . . . . . . . . .
5
1.3.2
Whole-genome and Targeted Resequencing . . . . . . . . . . . .
5
1.3.3
RNA-seq . . . . . . . . . . . . . . . . . . . . . . . . . . . . . . .
6
1.3.4
Epigenetic Studies . . . . . . . . . . . . . . . . . . . . . . . . . .
6
1.4
Future of Sequencing . . . . . . . . . . . . . . . . . . . . . . . . . . . . .
7
1.5
Aligning NGS Reads . . . . . . . . . . . . . . . . . . . . . . . . . . . . .
8
1.6
Contributions of the Thesis . . . . . . . . . . . . . . . . . . . . . . . . .
9
1.7
Organization of the Thesis . . . . . . . . . . . . . . . . . . . . . . . . . .
10
1.3
2 Basic Biology and NGS
11
iii
2.1
Introduction . . . . . . . . . . . . . . . . . . . . . . . . . . . . . . . . . .
11
2.2
Nucleic Acids . . . . . . . . . . . . . . . . . . . . . . . . . . . . . . . . .
12
2.2.1
DNA . . . . . . . . . . . . . . . . . . . . . . . . . . . . . . . . . .
12
2.2.2
RNA . . . . . . . . . . . . . . . . . . . . . . . . . . . . . . . . . .
13
Genes and Splicing . . . . . . . . . . . . . . . . . . . . . . . . . . . . . .
13
2.3.1
Genes . . . . . . . . . . . . . . . . . . . . . . . . . . . . . . . . .
13
2.3.2
Splicing . . . . . . . . . . . . . . . . . . . . . . . . . . . . . . . .
14
2.3.3
Alternative Splicing . . . . . . . . . . . . . . . . . . . . . . . . .
14
Sequencing Genomes . . . . . . . . . . . . . . . . . . . . . . . . . . . . .
15
2.4.1
Sanger Sequencing . . . . . . . . . . . . . . . . . . . . . . . . . .
15
2.4.2
Next Generation Sequencing . . . . . . . . . . . . . . . . . . . .
16
2.4.3
Roche 454 . . . . . . . . . . . . . . . . . . . . . . . . . . . . . . .
17
2.4.4
Illumina . . . . . . . . . . . . . . . . . . . . . . . . . . . . . . . .
17
2.4.5
SOLiD . . . . . . . . . . . . . . . . . . . . . . . . . . . . . . . . .
18
2.4.6
Polonator . . . . . . . . . . . . . . . . . . . . . . . . . . . . . . .
19
2.4.7
Ion Torrent . . . . . . . . . . . . . . . . . . . . . . . . . . . . . .
20
2.4.8
HeliScope . . . . . . . . . . . . . . . . . . . . . . . . . . . . . . .
20
2.4.9
PacBio . . . . . . . . . . . . . . . . . . . . . . . . . . . . . . . . .
21
2.4.10 Nanopores . . . . . . . . . . . . . . . . . . . . . . . . . . . . . . .
22
2.5
SMS vs Non-SMS Sequencing . . . . . . . . . . . . . . . . . . . . . . . .
23
2.6
Summary . . . . . . . . . . . . . . . . . . . . . . . . . . . . . . . . . . .
24
2.3
2.4
3 Burrows-Wheeler Transformation
25
3.1
Introduction . . . . . . . . . . . . . . . . . . . . . . . . . . . . . . . . . .
25
3.2
Definitions . . . . . . . . . . . . . . . . . . . . . . . . . . . . . . . . . . .
26
3.2.1
. . . . . . . . . . . . . . . . . .
27
Suffix Tries and Suffix Trees . . . . . . . . . . . . . . . . . . . . . . . . .
27
3.3.1
28
3.3
Exact String Matching Problem
Solution to the Exact String Matching Problem . . . . . . . . . .
iv
3.3.2
Suffix Trees . . . . . . . . . . . . . . . . . . . . . . . . . . . . . .
28
Suffix Array . . . . . . . . . . . . . . . . . . . . . . . . . . . . . . . . . .
29
3.4.1
Exact String Matching with Suffix Array . . . . . . . . . . . . .
30
3.5
The Burrows-Wheeler Transform . . . . . . . . . . . . . . . . . . . . . .
31
3.6
FM-Index . . . . . . . . . . . . . . . . . . . . . . . . . . . . . . . . . . .
34
3.6.1
Auxiliary Data Structures . . . . . . . . . . . . . . . . . . . . . .
34
3.6.2
Exact String Matching with the FM-index . . . . . . . . . . . . .
35
3.6.3
Converting SAT -Ranges to Locations . . . . . . . . . . . . . . .
36
Improving Decoding . . . . . . . . . . . . . . . . . . . . . . . . . . . . .
37
3.7.1
Retrieving Hits for a Fixed Length Pattern . . . . . . . . . . . .
38
3.8
Fast Decoding . . . . . . . . . . . . . . . . . . . . . . . . . . . . . . . . .
41
3.9
Relationship Between Suffix Trie and Other Indices . . . . . . . . . . . .
42
3.10 Forward and Backward Search . . . . . . . . . . . . . . . . . . . . . . .
42
3.4
3.7
4 Survey of Alignment Methods
43
4.1
Introduction . . . . . . . . . . . . . . . . . . . . . . . . . . . . . . . . . .
43
4.2
Basic Concepts . . . . . . . . . . . . . . . . . . . . . . . . . . . . . . . .
44
4.2.1
Alignments and Mapping Qualities . . . . . . . . . . . . . . . . .
44
4.3
Seeds . . . . . . . . . . . . . . . . . . . . . . . . . . . . . . . . . . . . . .
45
4.4
Mismatch Scanning With Seeds . . . . . . . . . . . . . . . . . . . . . . .
46
4.5
q-grams . . . . . . . . . . . . . . . . . . . . . . . . . . . . . . . . . . . .
47
4.6
Brief Overview . . . . . . . . . . . . . . . . . . . . . . . . . . . . . . . .
47
4.7
Seed-Based Aligners . . . . . . . . . . . . . . . . . . . . . . . . . . . . .
49
4.8
Suffix Trie Based Methods . . . . . . . . . . . . . . . . . . . . . . . . . .
51
4.9
Aligners and Hardware Improvements . . . . . . . . . . . . . . . . . . .
52
5 Survey of RNA-seq Alignment Methods
5.1
Introduction . . . . . . . . . . . . . . . . . . . . . . . . . . . . . . . . . .
v
56
56
5.2
Evolution of RNA-seq Mapping . . . . . . . . . . . . . . . . . . . . . . .
57
5.3
Classification of RNA-seq Mappers . . . . . . . . . . . . . . . . . . . . .
58
5.3.1
Exon-First and Seed-Extend
. . . . . . . . . . . . . . . . . . . .
58
5.3.2
Annotation-Based Aligners . . . . . . . . . . . . . . . . . . . . .
60
5.3.3
Learning-Based Approaches . . . . . . . . . . . . . . . . . . . . .
61
Splice Junction Finding . . . . . . . . . . . . . . . . . . . . . . . . . . .
61
5.4
6 k-Mismatch Alignment Problem
64
6.1
Introduction . . . . . . . . . . . . . . . . . . . . . . . . . . . . . . . . . .
64
6.2
Problem Definition . . . . . . . . . . . . . . . . . . . . . . . . . . . . . .
66
6.3
Description of the Algorithm . . . . . . . . . . . . . . . . . . . . . . . .
66
6.3.1
Seeding . . . . . . . . . . . . . . . . . . . . . . . . . . . . . . . .
66
6.3.2
Extension . . . . . . . . . . . . . . . . . . . . . . . . . . . . . . .
67
6.3.3
Increasing Efficiency . . . . . . . . . . . . . . . . . . . . . . . . .
70
6.3.4
Utilizing Failed Extensions . . . . . . . . . . . . . . . . . . . . .
70
6.4
The BatMis Algorithm . . . . . . . . . . . . . . . . . . . . . . . . . . . .
72
6.5
Implementation of BatMis . . . . . . . . . . . . . . . . . . . . . . . . . .
74
6.6
Results . . . . . . . . . . . . . . . . . . . . . . . . . . . . . . . . . . . . .
75
6.6.1
Ability to Detect Mismatches. . . . . . . . . . . . . . . . . . . . .
76
6.6.2
Mapping Real Data . . . . . . . . . . . . . . . . . . . . . . . . .
77
6.6.3
Multiple Mappings . . . . . . . . . . . . . . . . . . . . . . . . . .
78
6.6.4
Comparison Against Heuristic Methods . . . . . . . . . . . . . .
80
Discussion . . . . . . . . . . . . . . . . . . . . . . . . . . . . . . . . . . .
81
6.7
7 Alignment With Indels
84
7.1
Introduction . . . . . . . . . . . . . . . . . . . . . . . . . . . . . . . . . .
84
7.2
Dynamic Programming and Sequence Alignment . . . . . . . . . . . . .
85
7.3
The Pairing Problem . . . . . . . . . . . . . . . . . . . . . . . . . . . . .
86
vi
7.4
Mapping Reads With Indels . . . . . . . . . . . . . . . . . . . . . . . . .
87
7.5
Reverse Alignment . . . . . . . . . . . . . . . . . . . . . . . . . . . . . .
89
7.5.1
Determining F . . . . . . . . . . . . . . . . . . . . . . . . . . . .
89
7.6
Deep-Scan . . . . . . . . . . . . . . . . . . . . . . . . . . . . . . . . . . .
90
7.7
Quality-Aware Alignment Score . . . . . . . . . . . . . . . . . . . . . . .
91
7.8
The BatAlign Algorithm . . . . . . . . . . . . . . . . . . . . . . . . . . .
91
7.9
Extension of Seeds . . . . . . . . . . . . . . . . . . . . . . . . . . . . . .
93
7.10 Fast Method for Seed Extension
. . . . . . . . . . . . . . . . . . . . . .
93
7.10.1 Special Case of Alignment . . . . . . . . . . . . . . . . . . . . . .
94
7.10.2 Semi-Global Alignment for Seed Extension . . . . . . . . . . . .
97
7.11 Proof of Correctness . . . . . . . . . . . . . . . . . . . . . . . . . . . . . 100
7.12 Complexity of the Algorithm . . . . . . . . . . . . . . . . . . . . . . . . 101
7.13 Increasing Sensitivity, Accuracy and Speed . . . . . . . . . . . . . . . . 102
7.13.1 Making the Algorithms Faster. . . . . . . . . . . . . . . . . . . . 103
7.14 Calculating the Mapping Quality . . . . . . . . . . . . . . . . . . . . . . 103
7.15 Results . . . . . . . . . . . . . . . . . . . . . . . . . . . . . . . . . . . . . 105
7.16 Simulated Data . . . . . . . . . . . . . . . . . . . . . . . . . . . . . . . . 106
7.17 Evaluation on ART-Simulated Reads . . . . . . . . . . . . . . . . . . . . 107
7.17.1 Multiple Mappings . . . . . . . . . . . . . . . . . . . . . . . . . . 108
7.17.2 Evaluation on Simulated Pure-Indel Reads
. . . . . . . . . . . . 109
7.18 Mapping Real-Life Data . . . . . . . . . . . . . . . . . . . . . . . . . . . 109
7.18.1 Running Time . . . . . . . . . . . . . . . . . . . . . . . . . . . . 111
7.19 Discussion . . . . . . . . . . . . . . . . . . . . . . . . . . . . . . . . . . . 113
7.20 Acknowledgement . . . . . . . . . . . . . . . . . . . . . . . . . . . . . . . 115
8 RNA-seq Alignment
116
8.1
Introduction . . . . . . . . . . . . . . . . . . . . . . . . . . . . . . . . . . 116
8.2
An Alignment Score for Junctions . . . . . . . . . . . . . . . . . . . . . 117
vii
8.3
Basic Junction Finding Algorithm . . . . . . . . . . . . . . . . . . . . . 119
8.4
Finding Multiple Junctions . . . . . . . . . . . . . . . . . . . . . . . . . 120
8.5
Algorithm for Multiple Junctions . . . . . . . . . . . . . . . . . . . . . . 122
8.6
Details of Implementation . . . . . . . . . . . . . . . . . . . . . . . . . . 125
8.7
Mapping with BatAlign . . . . . . . . . . . . . . . . . . . . . . . . . . . 126
8.8
BatRNA Algorithm . . . . . . . . . . . . . . . . . . . . . . . . . . . . . . 127
8.8.1
8.9
Realignment of Reads . . . . . . . . . . . . . . . . . . . . . . . . 129
Results . . . . . . . . . . . . . . . . . . . . . . . . . . . . . . . . . . . . . 130
8.10 Accuracy and Sensitivity in Simulated Data . . . . . . . . . . . . . . . . 131
8.11 Mapping Junctions With Small Residues . . . . . . . . . . . . . . . . . . 132
8.12 Accuracy of High Confident Mappings . . . . . . . . . . . . . . . . . . . 132
8.13 Real-Life Mappings . . . . . . . . . . . . . . . . . . . . . . . . . . . . . . 133
8.14 Discussion . . . . . . . . . . . . . . . . . . . . . . . . . . . . . . . . . . . 135
8.15 Acknowledgement . . . . . . . . . . . . . . . . . . . . . . . . . . . . . . . 135
9 Conclusion
136
9.1
Introduction . . . . . . . . . . . . . . . . . . . . . . . . . . . . . . . . . . 136
9.2
BatMis . . . . . . . . . . . . . . . . . . . . . . . . . . . . . . . . . . . . . 137
9.3
BatAlign . . . . . . . . . . . . . . . . . . . . . . . . . . . . . . . . . . . . 138
9.4
Improving Results . . . . . . . . . . . . . . . . . . . . . . . . . . . . . . 139
9.5
BatRNA . . . . . . . . . . . . . . . . . . . . . . . . . . . . . . . . . . . . 139
9.6
BWT-based Algorithms . . . . . . . . . . . . . . . . . . . . . . . . . . . 140
9.7
Criteria for Benchmarking . . . . . . . . . . . . . . . . . . . . . . . . . . 141
9.8
Future Directions . . . . . . . . . . . . . . . . . . . . . . . . . . . . . . . 142
Bibliography
143
Appendices
162
viii
A Additional Mapping Results
163
A.1 List of Publications . . . . . . . . . . . . . . . . . . . . . . . . . . . . . . 163
A.1.1 Journal Publications . . . . . . . . . . . . . . . . . . . . . . . . . 163
A.1.2 Poster Presentations . . . . . . . . . . . . . . . . . . . . . . . . . 164
A.2 Additional Mapping Results . . . . . . . . . . . . . . . . . . . . . . . . . 164
A.3 Software . . . . . . . . . . . . . . . . . . . . . . . . . . . . . . . . . . . . 164
ix
Summary
Next Generation Sequencing (NGS) has opened up new possibilities in genomic studies.
However, studying the vast amounts of data produced by these technologies present
several challenges. In many applications, millions of reads will to be mapped to very
large genomes of size around 3 GB. Furthermore, the mapping needs to take into account
errors in the form of mismatches and indels.
In this thesis, I introduce fast and accurate techniques to solve NGS mapping
problems. Burrows-Wheeler transform (BWT) [20] is a data structure used prominently
by sequence aligners. I use BWT based indexing methods to compactly index genomes.
My first contribution is a fast and exact method called BatMis [135] to solve the
k-mismatch problem. Experiments show that BatMis is more accurate and faster than
existing aligners at solving the k-mismatch problem. In some cases, it can produce
the exact solution of the k-mismatch problem faster than heuristic methods that
produces partial solutions. BatMis can be used to accurately map short reads allowing
mismatches [134], and can also be used in pipelines where multiple k-mismatch mappings
are required [82, 73].
I next address the problem of mapping reads allowing a mixture of indels and
mismatches. This requirement is important to handle longer reads being produced by
current sequencing machines. I introduce a novel data structure that can be used to
efficiently find all the occurrences of two l-mer patterns within a given distance. With
the help of this data structure, I describe an algorithm called BatAlign to align NGS
x
reads allowing mismatches and indels.
In order to perform accurate and sensitive alignments, BatAlign uses two strategies
called reverse-alignment and deep-scan. Reverse-alignment incrementally looks for the
most likely alignments of a read, and deep scan looks for hits that are close to the best
hits. Finally, the candidate set of hits produced by reverse-alignment and deep scan are
examined to determine the best alignment. When handling long reads, BatAlign uses a
seed and extend method. I speed up this extension process considerably with the help
of a new alignment method and the use of SIMD operations. BatAlign can operate
with speeds close to the Bowtie2 aligner which is known for its speed, while producing
alignments with quality similar to the BWA-SW aligner which is known for its accuracy.
The last problem I address is mapping RNA-seq reads. I use BatAlign’s power to
accurately align exonic reads and recover possible junction locations. Furthermore, I
use my new data structure to device fast junction finding algorithms. Results from
both of these methods are used to determine the best alignment for RNA-seq reads.
Furthermore, the algorithm BatRNA uses a set of confident junctions to rectify incorrect
alignments and to align junctions having very short overhangs. Comparison with the
other state of the art aligners show that BatRNA produces best results in many measures
of accuracy and sensitivity, while being very fast.
In summary, the three mapping programs BatMis, BatAlign and BatRNA we present
in this theses will provide very attractive solutions to many sequence mapping problems.
xi
List of Abbreviations
BWT
Burrows-Wheeler Transform
BWT
Burrows-Wheeler Transform of string T
CIGAR
Compact Idiosyncratic Gapped Alignment Record
mapQ
Mapping Quality
NGS
Next Generation Sequencing
RSA
Reduced Suffix Array
SAT
Suffix array of the string T
SGS
Second Generation Sequencing
SNV
Single Nucleoride Polymorphism
SNV
Single Nucleoride Variation
SW
Smith-Waterman
xii
List of Tables
3.1
3.2
4.1
4.2
4.3
5.1
The BWT and the suffix array along with the sorted suffixes of string
acacag$. Note that the BWT of string can be easily compressed. . . . .
Size of the data structure LT,l,δ,D,κ for different values of l, where T is
the hg19 genome, δ = 4 and D = 30, 000. The size excludes the sizes of
BWT [1..n] and Dκ . . . . . . . . . . . . . . . . . . . . . . . . . . . . . .
40
The list of possible text operations in an edit transcript. A string can be
transformed into another string by applying these operations from left
to right on the original read. . . . . . . . . . . . . . . . . . . . . . . . .
Summary of several seed and q-mer based aligners. . . . . . . . . . . . .
Summary of several prefix/suffix trie based aligners. . . . . . . . . . . .
44
54
55
Summary of several RNA-seq aligners. Splice model denotes the approach
taken to resolve a junction. Biased methods prefer or only consider known
junction signals, while unbiased methods do not prefer any known junction
signal type. . . . . . . . . . . . . . . . . . . . . . . . . . . . . . . . . . .
62
Table showing the least mismatch mappings reported by aligners allowing
different numbers of mismatches. 1 000 000 reads from the datasets
ERR000577 (51bp) and ERR024201 (100bp) were mapped. All mappers
produce the same number of hits upto 2 mismatches and 5 mismatches
for 51bp and 100bp reads respectively. BatMis and RazerS2 consistently
performs well across all mismatches. However, other aligners report false
mappings or under reports hits at high mismatches. The extra mappings
in the bold entries for ZOOM are due to incorrect mappings. . . . . . .
6.2 Table showing the unique mappings reported by aligners allowing different
numbers of mismatches. 1 000 000 reads from the datasets ERR000577
(51bp) and ERR024201 (100bp) were mapped. All aligners report same
hits upto 2 mismatches and 3 mismatches for 51bp and 100bp reads
respectively. Only BatMis performs consistently across all mismatches.
Other aligners report false mappings or under reports hits at high mismatches. The extra mappings in the bold entries for ZOOM and RazerS2
are due to incorrect mappings. . . . . . . . . . . . . . . . . . . . . . . .
32
6.1
xiii
78
79
6.3
6.4
6.5
Number of multiple mappings reported by aligners for different numbers
of mismatches. 1 000 000 reads from the 100bp library ERR024201 were
aligned. Bold text shows mappings that contain invalid alignments. The
maximum number of invalid alignments reported is 168 by BWA at 5
mismatches. BatMis can recover all the correct mappings reported by
other programs. . . . . . . . . . . . . . . . . . . . . . . . . . . . . . . . .
Number of unique mappings reported when heuristic methods are used
by BWA and Razers2. The 51bp and 100bp reads used in the previous
experiments were mapped with the seeded mode of BatMis and the
default alignment mode of Razers2 which can produce 99% accurate
results. BatMis produces the largest number of correct hits. . . . . . . .
Timings for finding unique hits when mapping reads under the heuristic
modes of BWA and RazerS2. BatMis is either the fastest or has a
comparable speed to the fastest aligner. . . . . . . . . . . . . . . . . . .
80
82
82
7.1
The results of mapping simulated datasets of lengths 75bp, 100bp and
250bp and reporting the top 10 hits. The correct hits are broken down
by the rank of the hit. For 75bp and 100bp reads, BatAlign produces the
most number of correct hits within its top 10 hits. For 250bp BatAlign
misses only a small percentage of hits. . . . . . . . . . . . . . . . . . . . 108
7.2 The timing for mapping real-life data set of length 101bp. The baseline
for speed comparison is taken to be Stampy, and the speedup of other
methods compared to it are given. The fastest timing is reported by
GEM. BatAlign in its default mode is slower than Bowtie, but faster
than BWA aligners. In its faster modes, BatAlign is faster than or has a
similar timing to Bowtie2. . . . . . . . . . . . . . . . . . . . . . . . . . . 113
8.1
Statistics for different aligners when a simulated dataset of 2000 000
reads were mapped. The best two statistics of each column are shown in
bold letters. . . . . . . . . . . . . . . . . . . . . . . . . . . . . . . . . . . 132
8.2 Table showing the total percentage of junctions having short residues
of size 1bp-9bp that were recovered by each program. The final column
gives the total percentage of junctions having less than 9 bases that were
recovered. . . . . . . . . . . . . . . . . . . . . . . . . . . . . . . . . . . 133
8.3 The results of validating the junctions and exonic mappings found by
each aligner on a real dataset containing 2 000 000 reads. The validation
was done against known exons and junctions in the Refseq. . . . . . . . 134
A.1 Number of incorrect multiple mappings reported by aligners for different
numbers of mismatches. BatMis does not report any incorrect hits. . . . 165
A.2 Number of incorrect unique hits reported by BWA and Razers2 for
different numbers of mismatches when run in their heuristic modes. . . . 165
xiv
A.3 Number of least mismatch hits reported by aligners when mapping
simulated k-mismatch datasets containing 100 000 reads. Ideally, each
program should report 100 000 hits. . . . . . . . . . . . . . . . . . . . . 165
A.4 Number of multiple mappings reported by BWA in its heuristic mode
and with the exact algorithm of BatMis for a 100bp dataset containing 1
000 000 reads. . . . . . . . . . . . . . . . . . . . . . . . . . . . . . . . . 166
xv
List of Figures
1.1
Improvement of the cost to sequence a human sized genome with time.
Logarithmic scale is used for the Y axis. Data taken from www.genome.gov/sequencingcosts
8
2.1
(A) SMRT bell is created by joining two hairpin loops of DNA to a
genomic DNA fragment. The hairpin loop has a site for a primer (shown
in orange colour) to bind. (B) The SMRT bell is denatured to form a
loop, and the strand displacing polymerase (shown in gray) starts adding
bases to the loop. When it encounters the primer, it starts displacing
the primer and the synthesized strand from one side while adding bases
to the strand from the other side. Reproduced from Travers et. al. [139]
23
3.1
Illustration of the data structure for fast decoding of SAT -ranges. cccctgcggggccg$
gives an example string T . (a) shows the sorted positions of every nonunique 2-mer in the string. The label on top of of each list indicates the
2-mer and its SAT -range. (b) Data structure LT,2,2,3,κ that indexes each
2-mer by the starting position of each SAT -Range. The 2-mers ct and tg
are not indexed as they occur uniquely in T . cc is not included as it has
four occurrences. . . . . . . . . . . . . . . . . . . . . . . . . . . . . . . . 40
4.1
The graph shows the details of a collection of peer-reviewed sequence
aligners and their publication date. The graph plots DNA aligners in blue,
RNA aligners in red, miRNA aligners in green and bisulphite aligners
in purple. An update of a previous version is plotted connected by a
grey horizontal line to the original mapper. Reproduced from Fonseca et.
al. [38] . . . . . . . . . . . . . . . . . . . . . . . . . . . . . . . . . . . . .
49
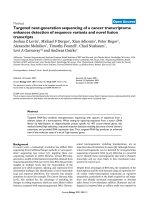
An illustration of exon-first and seed-extend methods. The black and
white boxes indicate exonic origins of some reads. (a) Exon-first methods
align the full reads to the genome first (exon read mapping), and the
remaining reads called IUM reads are aligned next, usually by dividing
them into smaller pieces and mapping them to the reference. (b) Seedextend methods map q-mers of the reads to the reference (seed matching).
The seeds are then extended to find splice sites (seed extend). Reproduced
from Garber et. al. [39] . . . . . . . . . . . . . . . . . . . . . . . . . . .
59
5.1
xvi
6.1
6.2
7.1
7.2
7.3
7.4
7.5
8.1
8.2
Timings for searching for least mismatch hits and unique hits in the
two real life datasets ERR000577 (51bp) and ERR024201 (100bp). Each
library contained 1 000 000 reads. The time is shown in logarithmic scale. 79
Timings for reporting multiple mappings allowing different numbers of
mismatches. 1 000 000 reads from the 100bp library ERR024201 were
mapped. The time axis is logarithmically scaled. BatMis consistently
reports the fastest timing. . . . . . . . . . . . . . . . . . . . . . . . . . . 80
(A) When performing seed extension, the seed portion of the reads R1
and R2 will be aligned to the genome. The seed will be on the left
half of R1 and the right half of R2. Neighbourhood of the area seeds
mapped to will then be taken; G1 to the right of R1, G2 to the left
of R2. Semi-global alignment can then be done between R1 − G1 and
R2 − G2, which will extend the seeds to right and left respectively. This
semi-global alignments can have gaps at only the right and left ends
respectively. (B) When the read R contains an insert in the left half of R
after the xth base, the right half of the read can be mapped completely
to the reference as shown. . . . . . . . . . . . . . . . . . . . . . . . . .
Mapping of simulated datasets containing reads of length 75bp and 100bp.
The reads were generated allowing 7% errors in a read, and a deviation
of 50bp from the exact origin of the read was allowed to account for
alignment errors and clippings. . . . . . . . . . . . . . . . . . . . . . . .
Comparison of aligners capabilities in detecting indels in pure-indel
datasets. The indel datasets were constructed by introducing indels of
different lengths to a million reads simulated from hg19 that were error
free. Among the aligners BatAlign shows the highest specificity and the
best F-measure. It is also robust in detecting indels of different lengths,
as can be seen by its stability of the F-measure. . . . . . . . . . . . . .
Mapping of real-life datasets containing reads of length 75bp, 101bp and
150bp. One side of paired-end datasets were mapped and if the mate of
a read was mapped within 1000bp with the correct orientation, the read
was marked as concordant. . . . . . . . . . . . . . . . . . . . . . . . . .
ROC curves of BatAlign’s fast modes compared with the ROC’s of other
aligners for a 100bp real life dataset. The faster modes of BatAlign still
perform well compared to other aligners. . . . . . . . . . . . . . . . . . .
98
107
110
112
114
Intron size distributions in human, mouse, Arabidopsis thaliana and fruit
fly genomes. The inset histograms continue the right tail of the main
histograms. For the histograms, bin sizes of 5 bp are used for Arabidopsis
and fruit fly, while 20 bp bins are used for human and mouse. Source [47]118
Total number of correct hits plotted against the total number of wrong
hits for 0-3 mismatch hits. Only the high quality hits with mapQ>0 were
considered. . . . . . . . . . . . . . . . . . . . . . . . . . . . . . . . . . . 134
xvii
Chapter 1
Introduction
1.1
Introduction
From the time immemorial, people have been seeking answers to questions about life.
These questions ranged from those that belonged to the realm of philosophy like “what
is the purpose of life” to those that can be treated scientifically like “How did life
originate?”, “How does life operate?” and “How does life propagate?”. Through
revolutionary thinking and technological breakthroughs in the last two centuries by
people like Darwin, Mendel, Crick, and Watson, the answers to the latter questions
have been shown to have a firm molecular basis.
With the publication of “The Origin of Species” in 1859, Charles Darwin initiated
a paradigm shift departing from the established view that life on earth was created
and is essentially static. He showed that organisms evolve to adapt to the changes in
the environment. Later work by Gregor Mendel demonstrated that the propagation of
characteristics of a species can be explained in terms of some inheritable factor, which
we now refer to as genes. In 1944, Oswald Theodore Avery showed that genetic material
is made out of DNA and these series of research finally culminated with the landmark
discovery of the double helical structure of DNA by Crick and Watson in 1953.
1
CHAPTER 1. INTRODUCTION
2
With the molecular basis of life thus established, scientists became interested in
interrogating the structure and the function of DNA. A major breakthrough happened
when Maxam, Gilbert [98] and Fred Sanger [126] discovered practical methods to
sequence stretches of DNA. This heralded the age of sequencing, and scientists were
able to sequence small genomes. In 1977, Sanger himself determined the genome of the
bacteriophage OX174 [125] and by 1995, the genome of the first free living organism
Haemophilus influenzae was completely sequenced [37]. With effective sequencing
technologies at hand, scientists launched ambitious projects to sequence the whole
genomes of various species having more complex genomes, and to annotate their genes.
These projects, especially the Human Genome Project that was launched in 1990,
helped take genomic sequencing to the next level. Due to the large amount of funding
pouring in and the competition among laboratories, government agencies, and private
entrepreneurs, genome sequencing became much efficient, cheap, and streamlined. Due
to this progress, the first draft of the human genome was finished in 2001 [67, 141], two
years ahead of its projected finishing date.
Along with the Human Genome, we now have the complete genomes of a wide
variety of species publicly available for free. Most of the model organisms like Mouse,
Fruit Fly, Zebra Fish, Yeast, Arabidopsis thaliana, C. elegans and E. coli have been
sequenced and their genes have been extensively annotated. Sequencing of well known
viruses like HIV (Human Immunodeficiency Virus) or HBV (Hepatitis B Virus), and
newly emerging pathogens like SARS (Severe Acute Respiratory Syndrome) virus have
also become routine.
1.2
Next Generation Sequencing
Maxam-Gilbert sequencing and Sanger sequencing are called first generation sequencing
technologies. Although they were introduced at the same time, Sanger’s method was
adopted for laboratory and commercial work due to its higher efficiency and lower
CHAPTER 1. INTRODUCTION
3
radioactivity. Sanger sequencing kept on improving in terms of its cost, ease of use and
accuracy. During the Human Genome Project, the sequencing process was parallelized
and automated. In 2005, a major improvement in sequencing technologies occurred
with the introduction of the 454 sequencer. In a single run, it was able to sequence
the genome of Mycoplasma genitalium [96]. In 2008, the 454 sequenced the genome of
James Watson [148]. The cost and the speed improvements brought forward by 454
were remarkable, and marked the beginning of the Next Generation Sequencing (NGS)
technologies, also known as the Second Generation Sequencing (SGS) technologies.
Other sequencers competing with 454 appeared within a short time. In 2006, two
scientists from Cambridge introduced the Solexa 1G sequencer [11]. The Solexa 1G was
able to produce 1GB of sequencing data in a single run for the first time in history. In
the same year, another competing sequencer the Agencourts’ SOLiD appeared and it
too had the ability to sequence a genome as complex as the Human Genome [102]. All
these founder companies were acquired by more established companies (454 by Roche,
Solexa by Illumina and Agencourt by ABI) and became the major players in SGS.
Newer approaches for sequencing kept on being invented. These include the use of
single molecular detection, scanning tunnelling electron microscope (TEM), fluorescence
resonance energy transfer (FRET) and protein nanopores [140]. Although there is no
accepted categorization, these technologies are sometimes claimed to be the third or
fourth generation sequencing technologies [62]. These methods have various advantages
and disadvantages compared to each other. Not all of these technologies are fully mature
or user friendly; for example, Oxford Nanopore has still not made their sequencer
commercially available. Some NGS technologies (e.g. Ion Torrent) are not capable of
producing sufficient sequencing coverage for whole genome studies, but are more suitable
for clinical applications due to their lower cost, accuracy and faster runtime. Sometimes
several sequencers can be used together to take advantage of strengths of each platform.
For example, Pacific Bioscience’s PacBio sequencer is best used in tandem with other
CHAPTER 1. INTRODUCTION
4
sequencing platforms. It produces very long reads but the number of reads produced is
small. One of its advantages of PacBio is that it does not show much of a sequencing
bias, and can be used to sequence regions with high GC content [117].
1.2.1
Algorithmic Challenges of NGS
NGS carries several algorithmic challenges with it. Compared to Sanger sequencing,
NGS produces smaller read lengths (though this is bound to change in near future)
having more errors. Sequencing methods that amplify and sequence DNA fragments
in clusters tend to accumulate errors due to the idiosyncrasies of individual members
in the clusters. As the sequencing progresses, these will result in “phasing errors”,
which causes mismatches to appear (see Chapter 2 for more details). Other methods
that sequence individual reads may fail to call bases due to the limits in the sensitivity
of measuring devices when homopolymer runs are present. This will result in indel
errors. Apart from these, other factors like imperfections in the chemistries will cause
sequencing errors too.
Algorithmically, handling exact matches is well studied and many data structures
exist to efficiently handle them. However, handling mismatches is not so straightforward,
and handling indels is more challenging. While algorithms exist to solve these problems,
they tend to be slow. When we take into consideration that millions of reads are
produced by NGS, we need to look beyond the classical solutions and towards novel
algorithms.
There are other problems associated with NGS. There might be biases in preferentially sequencing regions in genomes, depending on factors like the GC content and the
structure of the genome. These biases will result in uneven coverage and can become
a problem in the downstream analysis of sequencing data. However, algorithms can
employ various methods to compensate for these biases.