VISUAL ATTENTION IN DYNAMIC NATURAL SCENES 4
Bạn đang xem bản rút gọn của tài liệu. Xem và tải ngay bản đầy đủ của tài liệu tại đây (13.27 MB, 17 trang )
4.1 Methods
4.1.4 Normalization Schemes
The normalization of the saliency maps is necessary for the correct quantitative
analysis across movie frames on the same scale. We used z-score normalization
method, in which we subtract the mean saliency value from all the saliency values
and divide by the standard devia t i on of all the saliency values in a given map.
This resulted in some saliency va l u es below zero. We then removed larger saliency
values in the map by selecting a threshold in terms of a multiple of the standard
deviation (X). The intuition b ehind using thresholds in saliency maps was that
any region at X standard deviations away from the mean saliency was just as
salient as regions wit h a higher saliency value. A similar threshold can be applied
to negative values in a given saliency map. Thus resulting map had values in a
bounded interval of [XX]. This was akin to Normalized Scan path Saliency NSS
method (Peters et al., 2005).
4.1.5 Selection of Control Fixations
To assess the performance of the model against chance performan ce we selected
control fixations to compare against the human fixations. The control fixations
were selected in three di↵erent ways; random bias, su bject bias, and centre bias.
The random bias was ch ar acteri zed by selecting control fixations randomly sampled
from a uniform di st r ib u t i on over an entire saliency map.
The subject bias was defined by selecting the control fixations from a fixation
pool of other subjects on movies other than the movie to which the current saliency
map belongs to. The subject bias represents a stricter control compare to random
bias since we are accounting for the human eye movement pattern in selection of
the control fixations.
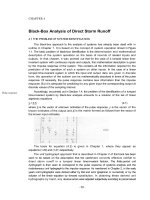
The centr e bias was a method of selecting control fixati on s randomly sampled
90
4.1 Methods
from a uniform distribution over a restricted region in centre of the saliency map
(see Figure 4.18). This type of control is strictest in computin g model’s perfor-
mance co m p a r e to chance performance due to its accounting of the photographer’s
bias.
4.1.6 Model Performance Metric
We have used two scoring methods to assess th e performance of di↵erent saliency
models, in predicting human fixations. The fi r st scoring method we u sed is named
as Area under the Reciver Operator Curve (ROC) otherwise known as AUC. This
scoring method has been reported often in literature to evaluate the eye fixation
prediction (Bruce & Tsotsos, 2009 ; Gao et al. 2008). In this scoring method we
first compute true positives from the saliency map using human fixation dat a . For
the false positive we sample the saliency map using random distribution, drawn
uniformly over the entire image. This is followed by the thresholding of the true
positive and false positive distributions, to get ROC values over an entire spectrum
of 0 to 1. The threshold is varied over a range of minimum and maximum saliency
values in the dataset. Subsequently ROC for false alarm rate (labeling non-fixated
location as fixated) as a function of the hit rate (labeling fixat ed l ocations as
fixated) is plotted. The advantage of this metric includes being non-parametric,
taking into consideration salience at the fixated and non-fixated location and hav-
ing upper and lower bounds (0.5 fo r chance discriminati o n , 1.0 or 0 for perfect
discrimination depending on if actual/human or control values are higher). The
area under the recei ver operator curve (AUC) indicates how well the sal i en cy map
predicts human fixations. An AUC score of 0.5 shows it’s not possi b l e to discrimi-
nate the two distributions (human and random) whil e score of 1.0 indicates perfect
discrimination and score of less than 0.5 suggests models is per for m i n g worse than
chance.
91
4.1 Methods
Frame # 54
Scene # 1
Saliency
Motion
Actual Fixations
Frame # 54
Scene # 1
Saliency
Motion
Random Bias
Frame # 54
Scene # 1
Saliency
Motion
Subject Bias
Frame # 54
Scene # 1
Saliency
Motion
o
o
o
o
o
o
o
o
o
o
o
o
o
o
o
o
o
o
o
o
o
o
o
o
.
.
.
.
.
.
.
.
.
.
.
.
.
.
.
.
.
.
.
.
.
.
.
.
.
.
.
.
.
.
.
.
.
.
.
.
.
.
.
.
.
.
.
.
.
.
.
.
.
.
.
.
.
.
.
.
.
.
.
.
.
.
.
.
.
.
.
.
.
.
.
.
.
.
.
.
.
.
.
.
.
.
.
.
.
.
.
.
.
.
.
.
.
.
.
.
.
.
.
.
.
.
.
.
.
.
.
.
.
.
.
. .
.
.
.
.
.
.
.
.
. .
.
.
.
.
.
.
.
.
.
.
.
.
.
.
.
.
.
.
.
.
.
.
.
.
.
.
.
.
.
.
.
.
.
.
.
.
.
.
.
.
.
.
.
.
.
.
.
.
.
.
. .
.
.
.
.
.
.
.
.
.
.
.
.
.
.
.
.
.
.
.
.
.
.
.
.
.
.
.
.
.
.
.
.
.
.
.
.
.
.
.
.
.
.
.
.
.
.
.
.
.
.
.
.
.
.
.
.
.
.
.
.
.
.
.
.
.
.
.
.
.
.
.
.
.
.
.
.
.
.
.
.
.
.
.
.
.
.
.
.
.
.
.
.
.
.
.
.
.
.
.
.
.
.
.
.
.
.
.
.
.
.
.
.
.
.
.
.
.
.
.
.
.
.
.
.
.
.
.
.
.
.
.
.
.
.
.
.
.
.
. .
.
.
.
.
.
.
.
.
.
.
.
.
.
.
.
.
.
.
.
.
.
.
.
.
.
.
.
.
.
.
.
.
.
.
.
.
.
.
.
.
.
.
.
.
.
.
.
.
.
.
.
.
.
.
.
.
.
.
.
.
.
.
.
.
.
.
.
.
.
.
.
.
.
.
.
.
.
.
.
.
.
.
.
.
.
.
.
.
.
.
.
.
.
.
.
.
.
.
.
.
.
.
.
.
.
.
.
.
.
.
.
.
.
.
.
.
.
.
.
.
.
.
.
.
.
.
.
.
.
.
.
.
.
.
.
.
.
.
.
.
.
.
.
.
.
.
.
.
.
.
.
.
.
.
.
.
.
.
.
.
.
.
.
.
.
.
.
.
.
.
.
.
.
.
.
.
.
.
.
.
.
.
.
.
.
.
.
.
.
.
.
.
.
.
.
.
.
.
.
.
.
.
.
.
.
.
.
.
.
.
.
.
.
.
.
.
.
.
.
.
.
.
.
.
.
.
.
.
.
.
.
.
.
.
.
.
.
.
.
.
.
.
.
.
.
.
.
.
.
.
.
.
.
.
.
.
.
.
.
.
.
.
.
.
.
.
.
.
.
.
.
.
.
.
.
.
.
.
.
. .
.
.
.
.
.
.
.
.
.
.
.
.
.
.
.
.
.
.
.
.
.
.
.
.
.
.
.
.
.
.
.
.
.
.
.
.
.
.
.
.
.
.
.
.
.
.
.
.
.
.
.
.
.
.
.
.
.
.
.
.
.
.
.
.
.
.
.
.
.
.
.
.
.
.
.
.
.
.
.
.
.
.
.
.
.
.
.
.
.
.
.
.
.
.
.
.
.
.
.
.
.
.
.
.
.
.
.
.
.
.
.
.
.
.
.
.
.
.
.
.
.
.
.
.
.
.
.
.
.
.
.
.
.
.
.
.
.
.
.
.
.
.
.
.
.
.
.
.
.
.
.
.
.
.
.
.
.
.
.
.
.
.
.
.
.
.
.
.
.
.
.
.
. .
.
.
.
.
.
.
.
.
.
.
.
.
.
.
.
.
.
.
.
.
.
.
.
.
.
.
.
.
.
.
.
.
.
.
.
.
.
.
.
.
.
.
.
.
.
.
.
.
.
.
.
.
.
.
.
.
.
.
.
.
.
.
.
.
.
.
.
.
.
.
.
.
.
.
.
.
.
.
.
.
.
.
.
.
.
.
.
.
.
.
.
.
.
.
.
.
.
.
.
.
.
.
.
.
.
.
.
.
.
.
.
.
.
.
.
.
.
.
.
.
.
.
.
.
.
.
.
.
.
.
.
.
.
.
.
.
.
.
.
.
.
. .
.
.
.
.
.
.
.
.
. .
.
.
.
.
.
.
.
.
.
.
.
.
.
.
.
.
.
.
.
.
.
.
.
.
.
.
.
.
.
.
.
.
.
.
.
.
.
.
.
.
.
.
.
.
.
.
.
.
.
.
. .
.
.
.
.
.
.
.
.
.
.
.
.
.
.
.
.
.
.
.
.
.
.
.
.
.
.
.
.
.
.
.
.
.
.
.
.
.
.
.
.
.
.
.
.
.
.
.
.
.
.
.
.
.
.
.
.
.
.
.
.
.
.
.
.
.
.
.
.
.
.
.
.
.
.
.
.
.
.
.
.
.
.
.
.
.
.
.
.
.
.
.
.
.
.
.
.
.
.
.
.
.
.
.
.
.
.
.
.
.
.
.
.
.
.
.
.
.
.
.
.
.
.
.
.
.
.
.
.
.
.
.
.
.
.
.
.
.
.
. .
.
.
.
.
.
.
.
.
.
.
.
.
.
.
.
.
.
.
.
.
.
.
.
.
.
.
.
.
.
.
.
.
.
.
.
.
.
.
.
.
.
.
.
.
.
.
.
.
.
.
.
.
.
.
.
.
.
.
.
.
.
.
.
.
.
.
.
.
.
.
.
.
.
.
.
.
.
.
.
.
.
.
.
.
.
.
.
.
.
.
.
.
.
.
.
.
.
.
.
.
.
.
.
.
.
.
.
.
.
.
.
.
.
.
.
.
.
.
.
.
.
.
.
.
.
.
.
.
.
.
.
.
.
.
.
.
.
.
.
.
.
.
.
.
.
.
.
.
.
.
.
.
.
.
.
.
.
.
.
.
.
.
.
.
.
.
.
.
.
.
.
.
.
.
.
.
.
.
.
.
.
.
.
.
.
.
.
.
.
.
.
.
.
.
.
.
.
.
.
.
.
.
.
.
.
.
.
.
.
.
.
.
.
.
.
.
.
.
.
.
.
.
.
.
.
.
.
.
.
.
.
.
.
.
.
.
.
.
.
.
.
.
.
.
.
.
.
.
.
.
.
.
.
.
.
.
.
.
.
.
.
.
.
.
.
.
.
.
.
.
.
.
.
.
.
.
.
.
.
. .
.
.
.
.
.
.
.
.
.
.
.
.
.
.
.
.
.
.
.
.
.
.
.
.
.
.
.
.
.
.
.
.
.
.
.
.
.
.
.
.
.
.
.
.
.
.
.
.
.
.
.
.
.
.
.
.
.
.
.
.
.
.
.
.
.
.
.
.
.
.
.
.
.
.
.
.
.
.
.
.
.
.
.
.
.
.
.
.
.
.
.
.
.
.
.
.
.
.
.
.
.
.
.
.
.
.
.
.
.
.
.
.
.
.
.
.
.
.
.
.
.
.
.
.
.
.
.
.
.
.
.
.
.
.
.
.
.
.
.
.
.
.
.
.
.
.
.
.
.
.
.
.
.
.
.
.
.
.
.
.
.
.
.
.
.
.
.
.
.
.
.
.
. .
.
.
.
.
.
.
.
.
.
.
.
.
.
.
.
.
.
.
.
.
.
.
.
.
.
.
.
.
.
.
.
.
.
.
.
.
.
.
.
.
.
.
.
.
.
.
.
.
.
.
.
.
.
.
.
.
.
.
.
.
.
.
.
.
.
.
.
.
.
.
.
.
.
.
.
.
.
.
.
.
.
.
.
.
.
.
.
.
.
.
.
.
.
.
.
.
.
.
.
.
.
.
.
.
.
.
.
.
.
. .
.
.
.
.
.
.
.
.
.
.
.
.
.
. .
.
.
.
.
.
.
.
.
.
.
.
.
.
.
.
.
.
.
.
.
.
.
.
.
.
.
.
.
.
.
.
.
.
.
.
.
.
.
.
.
.
.
.
.
.
.
.
.
.
.
.
.
.
.
.
.
.
.
.
.
.
.
.
.
.
.
.
.
.
.
.
.
.
.
.
.
.
.
.
.
.
.
.
.
.
.
.
.
.
.
.
.
.
.
.
.
.
.
.
.
.
.
.
.
.
.
.
.
.
.
.
.
.
.
.
.
.
.
.
.
.
.
.
.
.
.
.
.
.
.
.
.
.
.
.
.
.
.
.
.
.
.
.
.
.
.
.
.
.
.
.
.
.
.
.
.
.
.
.
. .
.
.
.
.
.
.
.
.
.
.
.
.
.
.
.
.
.
.
.
.
.
.
.
.
.
.
.
.
.
.
.
.
.
.
.
.
.
.
.
.
.
.
.
.
.
.
.
. .
.
.
.
.
.
.
.
.
.
.
.
.
.
.
.
.
.
.
.
.
.
.
.
.
.
.
.
.
.
.
.
. .
.
.
.
.
.
.
.
.
.
.
.
.
.
.
.
.
.
.
.
.
.
.
.
.
.
.
.
.
.
.
.
.
.
.
.
.
.
.
.
.
.
.
.
.
.
.
.
.
.
.
.
.
.
.
.
.
.
.
.
.
.
.
.
.
.
.
.
. .
.
.
.
.
.
.
.
.
.
.
.
.
.
.
.
.
.
.
.
.
.
.
.
.
.
.
.
.
.
.
.
.
.
.
.
.
.
.
.
.
.
.
.
.
.
.
.
.
.
.
.
.
.
.
.
.
.
.
.
.
.
.
.
.
.
.
.
.
.
.
.
.
.
.
.
.
.
.
.
.
.
.
.
.
.
.
.
.
.
.
.
.
.
.
.
.
.
.
.
.
.
.
.
.
.
.
.
.
.
.
.
.
.
.
.
.
.
.
. .
.
.
.
.
.
.
.
.
.
.
.
.
.
.
.
.
.
.
.
.
.
.
.
.
.
.
.
.
.
.
.
.
.
.
.
.
.
.
.
.
.
.
.
.
.
.
.
.
.
.
.
.
.
.
.
.
.
.
.
.
.
.
.
.
.
.
.
.
.
.
.
.
.
.
.
.
.
.
.
.
. .
.
.
.
.
.
.
.
.
.
.
.
.
.
.
.
.
.
.
.
.
.
.
.
.
.
.
.
.
.
.
.
.
.
.
.
.
.
.
. .
.
.
.
.
.
.
.
.
.
.
.
.
.
.
.
.
.
.
.
.
.
.
.
.
.
.
.
.
.
.
.
.
.
.
.
.
.
.
.
.
.
.
.
.
.
.
.
.
.
.
.
.
.
.
.
.
.
.
.
.
.
.
.
.
.
.
.
.
.
.
.
.
.
.
.
. .
.
.
.
.
.
.
.
.
.
.
.
.
.
.
.
.
.
.
.
.
.
.
.
.
.
.
.
.
.
.
.
.
.
.
.
.
.
.
.
.
.
.
.
.
.
.
.
.
.
.
.
.
.
.
.
.
.
.
.
.
.
.
.
.
.
.
.
.
.
.
.
.
.
.
.
.
.
.
.
.
.
.
.
.
.
.
.
.
.
.
.
.
.
.
.
.
.
.
.
.
.
.
.
.
.
.
.
.
.
.
.
.
.
.
.
.
.
.
.
.
.
.
.
.
.
.
.
.
.
.
.
.
.
.
.
.
.
.
.
.
.
.
.
.
.
.
.
.
.
.
.
.
.
.
.
.
.
.
.
.
.
.
.
.
.
.
.
.
.
.
.
.
.
.
. .
.
.
.
.
.
.
.
.
.
.
.
.
.
.
.
.
.
.
.
.
.
.
.
.
.
.
.
.
.
.
.
.
.
.
.
.
.
.
.
.
.
.
.
.
.
.
.
.
.
.
. .
.
.
.
.
.
.
.
.
.
.
.
.
.
.
.
.
.
.
.
.
.
.
.
.
.
.
.
.
.
.
.
.
.
.
.
.
.
.
.
.
.
.
.
.
.
.
.
.
.
.
.
.
.
.
.
.
.
.
.
.
.
.
.
.
.
.
.
.
.
.
.
.
.
.
.
.
.
.
.
.
.
.
.
.
. .
.
.
.
.
.
.
.
.
.
.
.
.
.
.
.
.
.
.
.
.
. .
.
.
.
.
.
.
.
. .
.
.
.
. .
.
.
.
.
.
.
.
.
.
.
.
.
.
.
.
.
.
.
.
.
.
.
.
.
.
.
.
.
.
.
.
.
.
.
.
.
.
.
.
.
.
.
.
.
.
.
.
.
.
.
.
.
.
.
. .
.
.
.
.
.
.
.
.
.
.
.
.
.
.
.
.
.
.
.
.
.
.
.
.
.
.
.
.
.
.
.
.
.
.
.
.
.
.
.
.
.
.
.
.
.
.
.
.
.
.
.
.
.
.
.
.
.
.
. .
.
.
.
.
.
.
.
.
.
.
.
.
.
.
.
.
.
.
.
.
.
.
.
.
.
.
.
.
.
.
.
.
.
.
.
.
.
.
.
.
.
.
.
.
.
.
.
.
.
.
.
.
.
.
.
.
.
.
.
.
.
.
.
.
.
.
.
.
.
.
.
.
.
.
.
.
.
.
.
.
.
.
.
.
.
.
.
.
.
.
.
.
.
.
.
.
.
.
.
.
.
.
.
.
.
.
.
.
.
.
.
.
.
.
.
.
.
.
.
.
.
.
.
.
.
.
.
.
.
.
.
.
.
.
.
.
.
.
.
.
.
.
.
.
.
.
.
.
.
.
.
.
.
. .
.
.
.
.
.
.
.
.
.
.
.
.
.
.
.
.
.
.
.
.
.
.
.
.
.
.
.
.
.
.
.
.
.
.
.
.
.
.
.
.
.
.
.
.
.
.
.
.
.
.
.
.
.
.
.
.
.
.
.
.
. .
.
.
.
.
.
.
.
.
.
.
.
.
.
.
.
.
.
.
.
.
.
.
.
.
.
.
.
.
.
.
.
.
.
.
.
.
.
.
. .
.
.
.
.
.
.
.
.
.
.
.
.
.
.
.
.
.
.
.
.
.
.
.
.
.
.
.
.
.
.
.
.
.
.
.
.
.
.
.
.
.
.
.
.
.
.
.
.
.
.
.
.
.
.
.
.
.
.
.
.
.
.
.
.
.
.
.
.
.
.
.
.
.
.
.
. .
.
.
.
.
.
.
.
.
.
.
.
.
.
.
.
.
.
.
.
.
.
.
.
.
.
.
.
.
.
.
.
.
.
.
.
.
.
.
.
.
.
.
.
.
.
.
.
.
.
.
.
.
.
.
.
.
.
.
.
.
.
.
.
.
.
.
.
.
.
.
.
.
.
.
.
.
.
.
.
.
.
.
.
.
.
.
.
.
.
.
.
.
.
.
.
.
.
.
.
.
.
.
.
.
.
.
.
.
.
.
.
.
.
.
.
.
.
.
.
.
.
.
.
.
.
.
.
.
.
.
.
.
.
.
.
.
.
.
.
.
.
.
.
.
.
.
.
.
.
.
.
.
.
.
.
.
.
.
.
.
.
.
.
.
.
.
.
.
.
.
.
.
.
.
. .
.
.
.
.
.
.
.
.
.
.
.
.
.
.
.
.
.
.
.
.
.
.
.
.
.
.
.
.
.
.
.
.
.
.
.
.
.
.
.
.
.
.
.
.
.
.
.
.
.
.
. .
.
.
.
.
.
.
.
.
.
.
.
.
.
.
.
.
.
.
.
.
.
.
.
.
.
.
.
.
.
.
.
.
.
.
.
.
.
.
.
.
.
.
.
.
.
.
.
.
.
.
.
.
.
.
.
.
.
.
.
.
.
.
.
.
.
.
.
.
.
.
.
.
.
.
.
.
.
.
.
.
.
.
.
.
. .
.
.
.
.
.
.
.
.
.
.
.
.
.
.
.
.
.
.
.
.
. .
.
.
.
.
.
.
.
. .
.
.
.
. .
.
.
.
.
.
.
.
.
.
.
.
.
.
.
.
.
.
.
.
.
.
.
.
.
.
.
.
.
.
.
.
.
.
.
.
.
.
.
.
.
.
.
.
.
.
.
.
.
.
.
.
.
.
.
. .
.
.
.
.
.
.
.
.
.
.
.
.
.
.
.
.
.
.
.
.
.
.
.
.
.
.
.
.
.
.
.
.
.
.
.
.
.
.
.
.
.
.
.
.
.
.
.
.
.
.
.
.
.
.
.
.
.
.
. .
.
.
.
.
.
.
.
.
.
.
.
.
.
.
.
.
.
.
.
.
.
.
.
.
.
.
.
.
.
.
.
.
.
.
.
.
.
.
.
.
.
.
.
.
.
.
.
.
.
.
.
.
.
.
.
.
.
.
.
.
.
.
.
.
.
.
.
.
.
.
.
.
.
.
.
.
.
.
.
.
.
.
.
.
.
.
.
.
.
.
.
.
.
.
.
.
.
.
.
.
.
.
.
.
.
.
.
.
.
.
.
.
.
.
.
.
.
.
.
.
.
.
.
.
.
.
.
.
.
.
.
.
.
.
.
.
.
.
.
.
.
.
.
.
.
.
.
.
.
.
.
.
.
. .
.
.
.
.
.
.
.
.
.
.
.
.
.
.
.
.
.
.
.
.
.
.
.
.
.
.
.
.
.
.
.
.
.
.
.
.
.
.
.
.
.
.
.
.
.
.
.
.
.
.
.
.
.
.
.
. .
.
.
.
.
.
.
.
.
.
.
.
.
.
.
.
.
.
.
.
.
.
.
.
.
.
.
.
.
.
.
.
.
.
.
.
.
.
.
. .
.
.
.
.
.
.
.
.
.
.
.
.
.
.
.
.
.
.
.
.
.
.
.
.
.
.
.
.
.
.
.
.
.
.
.
.
.
.
.
.
.
.
.
.
.
.
.
.
.
.
.
.
.
.
.
.
.
.
.
.
.
.
.
.
.
.
.
.
.
.
.
.
. .
.
.
.
.
.
.
.
.
.
.
.
.
.
.
.
.
.
.
.
.
.
.
.
.
.
.
.
.
.
.
.
.
.
.
.
.
.
.
.
.
.
.
.
.
.
.
.
.
.
.
.
.
.
.
.
.
.
.
.
.
.
.
.
.
.
.
.
.
.
.
.
.
.
.
.
.
.
.
.
.
.
.
.
.
.
.
.
.
.
.
.
.
.
.
.
.
.
.
.
.
.
.
.
.
.
.
.
.
.
.
.
.
.
.
.
.
.
.
.
.
.
.
.
.
.
.
.
.
.
.
.
.
.
.
.
.
.
.
.
.
.
.
.
.
.
.
.
.
.
.
.
.
.
.
.
.
.
.
.
.
.
.
.
.
.
.
.
.
.
. .
.
.
.
.
.
.
.
.
.
.
.
.
.
.
.
.
.
.
.
.
.
.
.
.
.
.
.
.
.
.
.
.
.
.
.
.
.
.
.
.
.
.
.
.
.
.
.
.
.
. .
.
.
.
.
.
.
.
.
.
.
.
.
.
.
.
.
.
.
.
.
.
.
.
.
.
.
.
.
.
.
.
.
.
.
.
.
.
.
.
.
.
.
.
.
.
.
.
.
.
.
.
.
.
.
.
.
.
.
.
.
.
.
.
.
.
.
.
.
.
.
.
.
.
.
.
.
.
.
.
.
.
.
.
. .
.
.
.
.
.
.
.
.
.
.
.
.
.
.
.
.
.
.
.
.
. .
.
.
.
.
.
.
.
. .
.
.
.
. .
.
.
.
.
.
.
.
.
.
.
.
.
.
.
.
.
.
.
.
.
.
.
.
.
.
.
.
.
.
.
.
.
.
.
.
.
.
.
.
.
.
.
.
.
.
.
.
.
.
.
.
.
.
. .
.
.
.
.
.
.
.
.
.
.
.
.
.
.
.
.
.
.
.
.
.
.
.
.
.
.
.
.
.
.
.
.
.
.
.
.
.
.
.
.
.
.
.
.
.
.
.
.
.
.
.
.
.
.
.
.
.
.
.
.
.
.
.
.
.
.
.
.
.
.
.
.
.
.
.
.
.
.
.
.
.
.
.
.
.
.
.
.
.
.
.
.
.
.
.
.
.
.
.
.
.
.
.
.
.
.
.
.
.
.
.
.
.
.
.
.
.
.
.
.
.
.
.
.
.
.
.
.
.
.
.
.
.
.
.
.
.
.
.
.
.
.
.
.
.
.
.
.
.
.
.
.
.
.
.
.
.
.
.
.
.
.
.
.
.
.
.
.
.
.
.
.
.
.
.
.
.
.
.
.
.
.
.
.
.
.
.
.
.
.
.
.
.
.
.
.
.
.
.
.
.
.
.
.
.
. .
.
.
.
.
.
.
.
.
.
.
.
. .
.
.
.
.
.
.
.
.
.
.
.
.
.
.
.
.
.
.
.
.
.
.
.
.
.
.
.
.
.
.
.
. .
.
.
.
.
.
.
.
.
.
.
.
.
.
.
.
.
.
.
.
.
.
.
.
.
.
.
.
.
.
.
.
.
.
.
.
.
.
.
.
.
.
.
.
.
. .
. .
.
.
.
.
.
.
.
.
.
.
.
.
.
.
.
.
.
.
.
.
.
.
.
.
.
.
.
.
.
.
.
.
.
.
.
. .
.
.
.
.
.
.
.
.
.
.
.
.
.
.
.
.
.
.
.
.
.
.
.
.
.
. .
.
.
.
.
.
.
.
.
.
.
.
.
.
.
.
.
.
.
.
.
.
. .
.
.
.
.
.
.
.
.
.
.
.
.
.
.
.
.
.
.
.
.
.
.
.
.
.
.
.
.
.
.
.
.
.
.
.
.
.
.
.
.
.
.
.
.
.
.
.
.
.
.
.
.
.
.
.
.
.
.
.
.
.
.
.
.
.
. .
.
.
.
.
.
.
.
.
.
.
.
.
.
.
.
.
.
.
.
.
.
.
.
.
.
.
.
.
.
.
.
.
.
.
.
.
.
.
.
.
.
.
.
.
.
.
.
.
.
.
.
.
.
.
.
.
.
.
.
.
.
.
.
.
.
.
.
.
.
.
.
.
.
.
.
.
.
.
.
.
.
.
.
.
.
.
. . .
.
.
.
.
.
.
.
.
.
.
.
.
.
.
.
.
.
.
.
.
.
. .
.
.
.
.
.
.
.
.
.
.
.
.
.
.
.
.
.
.
.
.
.
. .
.
.
.
.
.
.
.
.
.
.
.
.
.
.
.
.
.
.
.
.
.
.
.
.
.
.
.
.
.
. .
.
.
.
.
.
.
.
.
. .
.
.
.
.
.
.
.
.
.
.
.
.
.
.
.
.
.
.
.
.
.
.
.
.
.
.
.
.
.
.
.
.
.
.
.
.
.
.
.
.
.
.
.
.
.
.
.
.
.
.
.
.
.
.
.
.
.
.
.
.
.
.
.
.
.
.
.
.
.
.
.
.
.
. .
.
.
.
.
.
.
.
.
.
.
.
.
.
.
.
.
.
.
.
.
.
.
.
.
.
.
.
.
.
.
.
.
.
.
.
.
.
.
.
.
.
.
.
.
. .
.
.
.
.
.
.
.
.
.
.
.
.
.
.
.
.
.
.
.
.
.
.
.
.
.
.
.
.
.
.
.
.
.
.
.
.
.
.
.
.
.
.
.
.
.
.
.
.
.
.
.
.
.
.
.
.
.
.
.
.
.
.
.
.
.
.
.
.
.
.
.
.
.
.
.
.
.
.
.
.
.
.
.
.
.
.
.
.
.
.
.
.
.
.
.
.
.
.
.
.
.
.
.
.
.
.
.
. .
.
.
.
.
.
.
.
.
.
.
.
.
.
.
.
.
.
.
.
.
.
.
.
.
.
.
.
.
.
.
.
. .
.
.
.
.
.
.
.
.
.
.
.
.
.
.
.
.
.
.
.
.
.
.
.
.
.
.
.
.
.
.
.
.
.
.
.
.
.
.
.
.
.
.
.
.
. .
. .
.
.
.
.
.
.
.
.
.
.
.
.
.
.
.
.
.
.
.
.
.
.
.
.
.
.
.
.
.
.
.
.
.
.
.
. .
.
.
.
.
.
.
.
.
.
.
.
.
.
.
.
.
.
.
.
.
.
.
.
.
.
. .
.
.
.
.
.
.
.
.
.
.
.
.
.
.
.
.
.
.
.
.
.
. .
.
.
.
.
.
.
.
.
.
.
.
.
.
.
.
.
.
.
.
.
.
.
.
.
.
.
.
.
.
.
.
.
.
.
.
.
.
.
.
.
.
.
.
.
.
.
.
.
.
.
.
.
.
.
.
.
.
.
.
.
.
.
.
.
.
. .
.
.
.
.
.
.
.
.
.
.
.
.
.
.
.
.
.
.
.
.
.
.
.
.
.
.
.
.
.
.
.
.
.
.
.
.
.
.
.
.
.
.
.
.
.
.
.
.
.
.
.
.
.
.
.
.
.
.
.
.
.
.
.
.
.
.
.
.
.
.
.
.
.
.
.
.
.
.
.
.
.
.
.
.
.
.
. . .
.
.
.
.
.
.
.
.
.
.
.
.
.
.
.
.
.
.
.
.
.
. .
.
.
.
.
.
.
.
.
.
.
.
.
.
.
.
.
.
.
.
.
.
. .
.
.
.
.
.
.
.
.
.
.
.
.
.
.
.
.
.
.
.
.
.
.
.
.
.
.
.
.
.
. .
.
.
.
.
.
.
.
.
. .
.
.
.
.
.
.
.
.
.
.
.
.
.
.
.
.
.
.
.
.
.
.
.
.
.
.
.
.
.
.
.
.
.
.
.
.
.
.
.
.
.
.
.
.
.
.
.
.
.
.
.
.
.
.
.
.
.
.
.
.
.
.
.
.
.
.
.
.
.
.
.
.
.
. .
.
.
.
.
.
.
.
.
.
.
.
.
.
.
.
.
.
.
.
.
.
.
.
.
.
.
.
.
.
.
.
.
.
.
.
.
.
.
.
.
.
.
.
.
. .
.
.
.
.
.
.
.
.
.
.
.
.
.
.
.
.
.
.
.
.
.
.
.
.
.
.
.
.
.
.
.
.
.
.
.
.
.
.
.
.
.
.
.
.
.
.
.
.
.
.
.
.
.
.
.
.
.
.
.
.
.
.
.
.
.
.
.
.
.
.
.
.
.
.
.
.
.
.
.
.
.
.
.
.
.
.
.
.
.
.
.
.
.
.
.
.
.
.
.
.
Actual Fixations
Normalized histogram
High Saliency
Low Saliency
Random bias
Subject bias
Centre bias
Figure 4.18: Three di↵erent types of control biases shown on grey scale movie frame and
corresponding face modulated saliency map. Actual fixations are the real fixation by
di↵erent subject for this movie frame. Random bias (shown in cyan colour) show control
fixations sampled from uniform distribution over an entire image Subject bias (shown
in pink colour) show control fixations sampled from the fixation pool of other subjects
watching movies other than the one under consideration. Centre bias (shown in blue
colour) show control fixations by sampling from uniform distribution over a restricted
region in the centre of th e frame.
92
4.1 Methods
False alarm rate
Hit rate
Figure 4. 19: Receiver operator curve for movie cats. False alarm rate shows random
locations classified as fixated while hit rate shows human fixated locations classified as
fixated. Dotted line indicates chance level discrimination.
A second scoring scheme, often used by Itti and colleagues (Itti & Baldi, 20 0 9 ) ,
is .Kullback-Leibler (KL ) divergence (Kullback, 1959) scores. It measures the
di↵erence in shape, between t h e histogram of the saliency sampled at the fixated
location and saliency sampled at the control location.
KL(h|c)=
X
x
h(x)log
✓
h(x)
c(x)
◆
(4.5)
Here h is the probability deduced from human fixated saliency values and c
is the probability obtained from the control values. The control locations are
drawn from uniform spatial distribution over an entire image (random bias) or
from fi x at ion pool of subjects from other movies (subject bias) or uniform spatial
distribution over a restricted region in image (centre bias). Likewise AUC, if the
saliency sampled at the fixated location, predicted by the models, is significantly
better than the ch a n ce level then KL divergence scores between two histograms
93
4.2 Results
would be high and vice versa. The range of KL divergence is from 0 to 1. Higher
values indicate more dissimilarity in shape of the two distributions, implying model
is better predictor of the human fixati on data. The zero value indicates ch a n ce
performance, meaning that model is not doing any better than the control.
4.2 Results
Figure 4.20 demonstrates qualitat i ve comparisons between proposed model, gist
dependent control conditions, and previously proposed models of visual attention.
Previous computational models used for comparisons are Surprise Model Itti and
Baldi (2006), Saliency using natura l statistics (SUNDay) model (Zhang et al., 2009)
and dynamic visual attention model (D.V.A.) (Hou and Zhang, 2008). Compar-
isons to gist dependent control conditions (mentioned in section 4.1.3.6)aremade
to qual i t at i vely assess correct (labeled as Gist) and incorrect (ladled as Average
and Gist scrambled) modulations.
We show comparison s for 6 di↵erent movie frames. In first two columns we
show a m ovie frame along with the proposed model’s output at di↵erent stages.
The first stage is labeled as saliency map, obtained using motion intensity, spatial
coherency, and temporal coherency maps. The second stage is where we modulate
our salienc y map using face information. The third and final stage of our model’s
output is the modulation of face modulated saliency map using gist information.
In third and fourth column we show control condition modu l a t i on s for the gist
case. The last column shows saliency maps p r oduced by the previously proposed
models of visual attention in the literature.
To get an idea of how saliency values vary for sampled location across these
di↵erent maps we also show a fixation data from one subject, superimposed over
the maps in a green colour. The sampled value on each map is indicated on top of
94
4.2 Results
the respective maps. As shown the proposed model is good at capturing visually
salient locati on . Moreover the validity of correct gist modulation is confirmed by
low saliency values in control conditions.
We quantify ou r results using KL divergence and AUC scores. A quantitative
analysis is based on comparing fixated location with control fixations for a given
saliency map. The control fixation (random bias or subject bias or centre biased)
were sampled 100 times for a given fixated location (actual). It’s important to note
that many research studies sample control values from human fixated locations on
stimuli (also known as su bject biased) other than one und er consideration. The
claim behind employing this strategy is that randomly sampling control distribu-
tions over entire image result s in over estima t i on of the model’s prediction power.
However due to central bias in human eye movements, a very simple model like
Gaussian blob, centred on the image, may outperform many state-of-the-art com-
plex models (Parkhurst & Niebur 2003; Tatler et al., 2005). We report two scores
for these comparisons; KL d i vergence and AUC s cor es . KL divergence gives the
measure of sh a pe similarity between two arbitrary distributions. AUC scor es are
based on ROC curves which are used to overcome the subjectivity in threshold
selection. Moreover this method takes into a ccou nt the variability of saliency at
fixated location and non-fixat ed location (Tatler, Baddeley and Gilchrist, 2005).
Both of these scores are frequently repo r te d in literature for such model compar-
isons.
The Figure 4.21 illustrates the distribu t i o n of saliency values, sampled on di↵er-
ent maps, for 7846 human fixated locations versus control locations. The saliency
values were z-normalized per frame. The green bars represent the distribution from
control samp l i n g , while the blu e bars represent the dist r i b u t i on from human fixa-
tion targets in a frame. The data is shown for a movie I,Robot (2004). The error
95
4.2 Results
Control conditions
Proposed model
Previous models
Normalized histogram
High Saliency
Low Saliency
Frame 441
Gist 2x2 (0.74) Average 2x2 (0.41)
Gistswap 2x2 (0.48)
Surprise (0)
Saliency (0.53)
Gist 3x3 (0.72)
Average 3x3 (0.47)
Gistswap 3x3 (0.46)
D.V.A (0.5)
Face+Saliency (0.53) Gist 4x4 (0.75) Average 4x4 (0.46)
Gistswap 4x4 (0.44) SUNDay (0.54)
Frame 741
Gist 2x2 (0.87) Average 2x2 (0.18)
Gistswap 2x2 (0.21) Surprise (0.57)
Saliency (0.28)
Gist 3x3 (0.79)
Average 3x3 (0.22)
Gistswap 3x3 (0.18) D.V.A (0.03)
Face+Saliency (0.28) Gist 4x4 (0.91) Average 4x4 (0.21)
Gistswap 4x4 (0.24)
SUNDay (0.19)
Figure 4.20: A qualitative comparison of proposed saliency model with previous models
of visual attention in the literature. We show comparisons for 6 di↵erent frames from our
movie data set. In all the examples we show a fi x at i on point ( gre en ) from on e subject
superimposed on di↵e re nt maps and sampled saliency value at the location in respective
maps. As shown saliency maps produced by proposed model is much sparser compared
to previous models.
96
4.2 Results
Control conditions
Proposed model
Previous models
Normalized histogram
High Saliency
Low Saliency
Frame 520
Gist 2x2 (0.83) Average 2x2 (0.64)
Gistswap 2x2 (0.72) Surprise (0.42)
Saliency (0.86)
Gist 3x3 (0.89)
Average 3x3 (0.81)
Gistswap 3x3 (0.57)
D.V.A (0.7)
Face+Saliency (NaN) Gist 4x4 (0.83) Average 4x4 (0.71)
Gistswap 4x4 (0.76) SUNDay (0.43)
Frame 1020
Gist 2x2 (0.84) Average 2x2 (0.27)
Gistswap 2x2 (0.24) Surprise (0.03)
Saliency (0.21)
Gist 3x3 (0.78)
Average 3x3 (0.28)
Gistswap 3x3 (0.2)
D.V.A (0.12)
Face+Saliency (NaN) Gist 4x4 (0.72) Average 4x4 (0.27)
Gistswap 4x4 (0.38)
SUNDay (0.03)
Figure 4.20 (continued)
97
4.2 Results
Frame 598
Gist 2x2 (0.7) Average 2x2 (0.61)
Gistswap 2x2 (0.55) Surprise (0.53)
Saliency (0.8)
Gist 3x3 (0.86)
Average 3x3 (0.56)
Gistswap 3x3 (0.58)
D.V.A (0.45)
Face+Saliency (NaN) Gist 4x4 (0.88) Average 4x4 (0.56)
Gistswap 4x4 (0.55) SUNDay (0.61)
Control conditions
Proposed model
Previous models
Frame 331
Gist 2x2 (0.89) Average 2x2 (0.22)
Gistswap 2x2 (0.22) Surprise (0.5)
Saliency (0)
Gist 3x3 (0.9)
Average 3x3 (0.3)
Gistswap 3x3 (0.14) D.V.A (0.17)
Face+Saliency (0.87) Gist 4x4 (0.89) Average 4x4 (0.25)
Gistswap 4x4 (0.33)
SUNDay (0.36)
Normalized histogram
High Saliency
Low Saliency
Figure 4.20 (continued)
98
4.2 Results
bars were obtained by constructing 1000 surrogates of human and control distri-
butions, each sampled from their respective original distributions, using bootstrap
method (Efron and Tibshirani, 1994). For each condition we report mean KL
divergence and AUC scores wit h ±1stdover1000surrogates.
We found KL divergence and AUC scores were significantly above th e chance
level (95% confidence intervals were well above chance) for all three control con-
ditions and for all the di↵erent maps. With modulation of fa ce locations in our
baseline/Spatio-Temporal saliency map we significantly improved performance of
the proposed model. Follow up scene category dependent gist modulation further
improved the results, as reflected by histograms of saliency values at human fixated
locations and scoring metrics. We found the gist modu l at i o n consistently improved
the model’s performance across the movies (see Figure 4.22). On x-axis we plotted
AUC scores obtained by face modulation of baseline saliency map and on Y-axis we
plotted AUC scores obtained by Gist modulation of face modulated saliency maps.
The diagonal marks the chance performance . Any movie point below the diagonal
would indicate that gist modulation resulted in degradation of performance over
face modulation. On the contrary if the m ovie point was above the diagonal that
would indicate that gist modulation resulted in improvement of performance over
the face modulation. As illustrated majority of the movie points were found to be
well above the diagonal (t-test p<0.01). However for some of the movies, espe-
cially those with faces, we observed marginal improvements with gist modulations,
as shown by 2.5
th
and 97.5
th
percentile error bars. One explanat i on of such result
is that with face modulation the AUC scores were al re ad y saturating t o the limit
(i.e., theoretical limit of 1). So with additional gist modulation it did not made
stark di↵erence. However in movies with less frequent faces (such as Galapagos)
we saw a significant i m p r ovement in prediction, as reflected in AUC scores well
above the diagonal.
99
4.2 Results
0 2 4
0
2000
4000
6000
Motion
KL 1.366 ±0.367
AUC 0.866 ±0.072
Random Bias
0
2 4
0
2000
4000
6000
KL 1.027 ±0.328
AUC 0.755 ±0.100
Subject Bias
0
2 4
0
2000
4000
6000
KL 0.812 ±0.323
AUC 0.786 ±0.091
Centre Bias
0 2 4
0
2000
4000
6000
KL 0.993 ±0.341
AUC 0.749 ±0.085
0 2
4
0
2000
4000
6000
KL 0.725 ±0.295
AUC 0.663 ±0.075
0 2 4
0
2000
4000
6000
KL 0.666 ±0.251
AUC 0.676 ±0.074
0 2 4
0
2000
4000
6000
KL 1.243 ±0.449
AUC 0.612 ±0.049
0 2 4
0
2000
4000
6000
KL 0.865 ±0.473
AUC 0.608 ±0.029
0 2 4
0
2000
4000
6000
KL 0.799 ±0.235
AUC 0.619 ±0.023
0 2 4
0
2000
4000
6000
KL 1.544 ±1.549
AUC 0.648 ±0.022
0 2 4
0
2000
4000
6000
KL 0.719 ±0.634
AUC 0.641 ±0.018
0 2 4
0
2000
4000
6000
KL 0.564 ±0.062
AUC 0.648 ±0.012
0 2 4
0
2000
4000
6000
KL 1.873 ±0.895
AUC 0.875 ±0.020
0 2 4
0
2000
4000
6000
KL 1.481 ±0.311
AUC 0.878 ±0.008
0 2 4
0
2000
4000
6000
KL 1.528 ±0.177
AUC 0.881 ±0.005
0 2 4
0
2000
4000
6000
Gist 2x2 x
KL 1.911 ±0.393
AUC 0.942 ±0.032
0
2 4
0
2000
4000
6000
KL 1.650 ±0.429
AUC 0.926 ±0.041
0 2 4
0
2000
4000
6000
KL 1.593 ±0.390
AUC 0.887 ±0.050
I,Robot (7486 fixations)
0 2 4
0
2000
4000
6000
KL 1.983 ±0.394
AUC 0.943 ±0.032
Random Bias
0 2 4
0
2000
4000
6000
KL 1.707 ±0.422
AUC 0.931 ±0.040
Subject Bias
0
2 4
0
2000
4000
6000
KL 1.550 ±0.359
AUC 0.892 ±0.050
Centre Bias
0 2 4
0
2000
4000
6000
KL 1.930 ±0.368
AUC 0.943 ±0.032
0 2 4
0
2000
4000
6000
KL 1.755 ±0.421
AUC 0.930 ±0.040
0 2 4
0
2000
4000
6000
KL 1.579 ±0.376
AUC 0.892 ±0.049
Gist 3x3 x
Gist 4x4 x
Human Fixations Control Fixations
0.4
0.5
0.6
0.7
0.8
0.9
1
0
1
2
3
4
5
Chance level
Random bias
Subject bias
Centre bias
Motion
Spatial Coherency
Temporal Coherency
Saliency
Saliency + Face
Gist x ( Saliency + Face )
Gist 2x2
Gist 3x3
Gist 4x4
Motion
Spatial Coherency
Temporal Coherency
Saliency
Saliency + Face
Gist x ( Saliency + Face )
Gist 2x2
Gist 3x3
Gist 4x4
Figure 4.21: A Histogram of sampled saliency values at human fixated locations (shown
by blue colour) and control locations (shown by green colour) for a movie I,Robot (2004).
The KL divergence and AUC scores for each condition were found to be significantly
higher than chance level (se e 95% confidence intervals). As observed with integration of
face and gist information to our baseline saliency map we have significantly improved
proposed model ’ s predi ct i on performance. All the maps were z-normalized per frame.
The data is shown for total of 7846 human fixations.
100
4.2 Results
0.75
0.8 0.85
0.9
0.95
0.75
0.8
0.85
0.9
0.95
Random bias
2x2
0.5
0.6 0.7
0.8
0.9
0.5
0.6
0.7
0.8
0.9
subject bias
0.5
0.6 0.7
0.8
0.9
0.5
0.6
0.7
0.8
0.9
Centre bias
0.75
0.8
0.85 0.9
0.95
0.75
0.8
0.85
0.9
0.95
3x3
0.5 0.6
0.7
0.8 0.9
0.5
0.6
0.7
0.8
0.9
0.5
0.6 0.7 0.8
0.9
0.5
0.6
0.7
0.8
0.9
0.75
0.8
0.85
0.9
0.95
0.75
0.8
0.85
0.9
0.95
4x4
0.5
0.6
0.7
0.8
0.9
0.5
0.6
0.7
0.8
0.9
0.5
0.6 0.7 0.8
0.9
0.5
0.6
0.7
0.8
0.9
Face + saliency
Gist x (Face + saliency)
Animals
Cats
Everest
BigLebowski
Galapagos
Matrix
IRobot
KungFuHustle
Flirtingscholar
Hitler
Wongfeihong
ForbiddenCityCop
Error bars show 2.5th and 97.5th percentile
Figure 4.22: A comparison of improvement in model’s prediction power after Gist mod-
ulation. The AUC score is shown for each movie (colour coded) with corresponding 2.5
th
and 97.5
th
percentiles. Improvements in Gist modulated scores are significantly higher
as compared to face modulation of baseline saliency map.
101
4.2 Results
One can argue tha t high scores in gist based modulation are due to centre bias
e↵ect. As explained in section 4.1.3.4 gist modulation was done via scene category
specific and center bias intact fixation map. This would result in saliency maps
with all the peripheral activity suppressed, leaving only central regions active. Al-
though this would not result in overall degradation of performance since in general
we observe a significant centre bias in human fixation patterns for dynamic stimuli
(Tseng et al., 2009; Berg et al., 2009; Dorr et al., 2010). Non et h el ess it was impor-
tant to th o ro u g h l y test any improvements due to gist modulation are not merely
equivalent to addition of centre bias.
To address this issue we formulated two control conditions, as explained in
section 4.1.3.6. In first control condition(average condition) the face modulated
saliency maps were modulated using fixation maps averaged across th e scene cat-
egories. In second control condition (scrambled gist condition) we scrambled the
fixation maps across scene category, thus modulating the saliency map of one scene
type with another scene type fixation map. In Figure 4.23 we show comparison of
AUC scores between gist mo d u l a t i on and control condition s, for each movie across
our entire movie data set. Again each movie is illustra t ed using a colour coded cir-
cle on the plot. The gist dependent control modulation scores are plotted on x-axis
while correct gist modulation scores are plotted on y -ax i s. The diagonal line marks
the crossover. For any given movie if the score was improved more with the correct
modulation than with control condition modulations we sh o u l d find it above the
diagonal. However if the score was im p r oved more with gi st dep e n d ent control
modulation we should find i t below the diagonal. As illustrated the co r r ect scene
category based gist modulation is very important in significant improvement of the
model’s performanc e. In comparison the mere addition of centre bias (Average)
or modulating with wrong scene category based gist (Gist scrambled condition)
results in degraded performance.
102
4.2 Results
Random bias
2x2
subject biasCentre bias
3x3
4x4
Average x (Face + saliency)
Gist x (Face + saliency)
Animals
Cats
Everest
BigLebowski
Galapagos
Matrix
IRobot
KungFuHustle
flirtingscholar
hitler
wongfeihong
ForbiddenCityCop
Error bars show 2.5th and 97.5th percentile
0.8
0.85
0.9
0.95
0.5
0.6 0.7
0.8 0.9
0.5
0.6
0.7
0.8
0.9
0.5 0.6 0.7
0.8
0.9
0.5
0.6
0.7
0.8
0.9
0.75
0.8
0.85
0.9
0.95
0.75
0.8
0.85
0.9
0.95
0.5
0.6
0.7 0.8 0.9
0.5
0.6
0.7
0.8
0.9
0.5 0.6
0.7
0.8
0.9
0.5
0.6
0.7
0.8
0.9
0.75
0.8 0.85
0.9 0.95
0.75
0.8
0.85
0.9
0.95
0.5
0.6
0.7 0.8 0.9
0.5
0.6
0.7
0.8
0.9
0.5
0.6
0.7 0.8
0.9
0.5
0.6
0.7
0.8
0.9
0.75
0.8
0.85
0.9
0.95
0.75
0.75
0.8
0.85
0.9 0.95
0.75
0.8
0.85
0.9
0.95
0.5
0.6 0.7
0.8 0.9
0.5
0.6
0.7
0.8
0.9
0.5 0.6 0.7
0.8
0.9
0.5
0.6
0.7
0.8
0.9
0.75
0.8 0.85 0.9
0.95
0.75
0.8
0.85
0.9
0.95
0.5 0.6
0.7
0.8 0.9
0.5
0.6
0.7
0.8
0.9
0.5
0.6
0.7
0.8 0.9
0.5
0.6
0.7
0.8
0.9
0.75
0.8 0.85
0.9 0.95
0.75
0.8
0.85
0.9
0.95
0.5
0.6 0.7 0.8 0.9
0.5
0.6
0.7
0.8
0.9
0.5
0.6
0.7
0.8 0.9
0.5
0.6
0.7
0.8
0.9
Random bias
2x2
subject biasCentre bias
3x3
4x4
Scrambled gist x (Face + saliency)
Gist x (Face + saliency)
Figure 4.23: A comparison between correct gist modulation and gist dependent control
condition modulations. A mean AUC score is shown for each movie with wi t h corre-
sponding 2.5
th
and 97.5
th
percentile confidence intervals. As illus tr at ed with correct
gist modulation the scores are significantly higher (t-test p<0.01) compare d to gist
dependent control modulations(average and gist scrambled conditions).
103
4.2 Results
Motion
Spatial
Coherency
Temporal
Coherency
Saliency
Face + Saliency
Gist 2x2
Gist 3x3
Gist 4x4
0.6
0.7
0.8
0.9
1
Area under the ROC curve (AUC) scores
Random Bias
Subject Bias
Center Bias
Gist x (Face + Saliency)
Figure 4.24: Performance of each channel in proposed model, measured by area under
the receiver operator curve (AUC) metric. The mean AUC score(indicat ed by cross)
for each channel is computed over 12 movies with ±1 st and ard error in mean used for
confidence intervals (shown by error bars). These scores are reported for all three types
of biases. As evident the gist modulated saliency outperforms all other feature channels,
including the face modulation of baseline saliency map
In Figure 4.24 we show overall performance of each channel. The performance
is reported in AUC me tr i c for all th e movies and di ↵er ent types of biases. The
mean AUC score was computed over 12 movies with confidence i ntervals computed
using stand a r d error in mean. As ill u st ra t ed each channel is performing well above
chance l evel of 0.5. Since the critical feature of our model is saliency due to
motion it scores the highest among other feature channels like spatial coherency
and temporal coherency. This validates previous findings that visual attention
in dynamic stimuli is frequently deployed to the location of high motion energy
(Abrams and Christ, 2003). The score of baseline saliency map based only on
motion, spatial coherency and temporal coherency feature is significantly improved
with face and subsequent gist modulations. (K-S test p<0.01).
For comparison with state -o f-t h e- ar t models of visual attention, data is ag-
gregated over all the movies. Figu r e 4.25 shows the histogram of saliency values
sampled from all the early human fixation (37298 fixation s in total) for all the
104
4.2 Results
movies. Again we sh ow compariso n s for three types of biases f or the proposed and
other models. As evident from histograms a lower proportion of human fixations
were made to locations with very low saliency compared to those from the control
distribution. The di↵erence is much larger for the proposed computational model
than for any other model. This results in significantly higher AUC (0.9) and KL di-
vergence (1.6) scores as compared to other models. Although Itti and Baldi (2006)
model was found to be a close runner up (AUC score = 0.84 and KL divergence
score = 1.18).
105
4.2 Results
Total fixations :37298
0
2
3
4 5
0
2
3
4
4
Proposed model Gist x ( Face + Saliency )
KL ±
AUC ±
0 2
3 4 5
0
2
3
4
4
KL ±
AUC ±
0
2 3 4 5
0
2
3
4
4
KL ±
AUC ±
0 2
3 4 5
0
2
3
4
4
KL ±
AUC ±
0 2
3
4 5
0
2
3
4
4
KL ±
AUC ±
0 2
3 4 5
0
2
3
4
4
KL ±
AUC ±
0
2 3 4 5
0
2
3
4
4
KL ±
AUC ±
0 2
3 4 5
0
2
3
4
4
KL ±
AUC ±
0
2
3
4 5
0
2
3
4
4
KL ±
AUC ±
0 2
3 4 5
0
2
3
4
4
KL ±
AUC ±
0
2 3 4 5
0
2
3
4
4
KL ±
AUC ±
0
2
3 4 5
0
2
3
4
4
KL ±
AUC ±
Human Fixations
Control Fixations
Figure 4.25: A Quantitative comparison amon g di↵erent models. The comparisons are
quantified by reporting KL divergence and AUC scores.
106