Study on membranes and cathode catalysts in microbial fuel cells
Bạn đang xem bản rút gọn của tài liệu. Xem và tải ngay bản đầy đủ của tài liệu tại đây (16.74 MB, 110 trang )
STUDY ON MEMBRANES AND
CATHODE CATALYSTS IN
MICROBIAL FUEL CELLS
LU MIN
(BSc. Nanjing University)
A THESIS SUBMITTED
FOR THE DEGREE OF DOCTOR OF
PHILOSOPHY
DEPARTMENT OF CHEMISTRY
NATIONAL UNIVERSITY OF
SINGAPORE
2013
DECLARATIONS
I hereby declare that this thesis is my original work and it has been written
by me in its entirety, under the supervision of Prof. Sam Li Fong Yau,
Department of Chemistry, National University of Singapore, between Aug
2009 and July 2013.
I have duly acknowledged all the sources of information which have been
used in the thesis.
This thesis has also not been submitted for any degree in any university
previously.
The content of the thesis has been partly published in:
(1) Critical Reviews in Environmental Science and Technology
(2) Biosensors & Bioelectronics
(3) Journal of Power Sources
Name
Signature
II
Date
ACKNOWLEDGEMENT
First and foremost, I would like to extend my sincere gratitude to my
supervisor Professor Sam Li Fong Yau for his guidance and support during my
graduate study. His open mindedness and friendly disposition will deeply
impact on my life and future career.
I am thankful to my collaborators from Department of Civil &
Environmental Engineering (CEE), Professor Ng How Yong and Shailesh
Kharkwal.
To all the members in Professor Sam Li’s lab who provide such a suitable
learning environment, encouragement and support, thank you. I would like to
specially mention some of them in our wastewater team: Dr. Wu Huanan., Ms.
Guo Lin, Ms. Lee Si Ni, Mr. Lai Linke., Ms. Zhang Lijuan, and also my past
honors and UROPS students, Mr. Leonard Bay and Mr. Yap Chen Xi, who
have injected much fun and enthusiasm in the research life.
I would like to thank a few important colleagues and friends in the NUS
Environmental Research Institute (NERI): Ms. Elaine Tay, Mdm Frances Lim,
Ms. Per Poh Geok who have provided support for my experiment in NERI
from every aspect. My heartfelt gratitude goes to Ms. Suriawati Binte Sa'ad in
Department of Chemistry, always helping me in my graduate study, from
admission to graduation.
I would like to express my loving thanks to my husband Xie Xiaoji. His
love, encouragement and sometimes excellent ideas motivated me towards the
accomplishment documented in this thesis. Last, but not least, I wish to
dedicate this thesis to my parents. Without their love and understanding, I
would not have completed my doctoral study.
The financial support of National University of Singapore is gratefully
acknowledged.
III
TABLE OF CONTENTS
DECLARATIONS ........................................................... II
ACKNOWLEDGEMENT.............................................. III
TABLE OF CONTENTS ............................................... IV
SUMMARY ..................................................................... IX
LIST OF TABLES .......................................................... XI
LIST OF FIGURES ...................................................... XII
CHAPTER 1. INTRODUCTION .................................... 1
1.1 FUNDAMENTALS ABOUT MFCS ................................ 3
1.1.1 Thermodynamic fundamentals....................................................... 3
1.1.2 Electrochemical losses of MFCs- an overview .............................. 7
1.2 MEMBRANES IN MFCS. ................................................ 9
1.3 CATHODE REACTIONS IN MFCS. ........................... 10
1.3.1 Electron acceptors in MFCs ......................................................... 12
1.3.2 Oxygen reduction catalysts in MFCs. .......................................... 14
1.3.3 Summary ...................................................................................... 18
1.4 OBJECTIVES AND SIGNIFICANCE OF THIS
THESIS. ........................................................................................ 21
IV
REFERENCES ...................................................................... 23
CHAPTER 2. NANOPOROUS HYDROPHILIC
POLYMER MEMBRANES AS ALTERNATIVE
SEPARATORS IN MICROBIAL FUEL CELLS ............. 27
2.1 INTRODUCTION ........................................................... 27
2.2 EXPERIMENTAL........................................................... 27
2.2.1 MFC configuration....................................................................... 27
2.2.2 Membrane selection ..................................................................... 28
2.2.3 MFC operation ............................................................................. 28
2.2.4 Analysis........................................................................................ 29
2.3 RESULTS AND DISCUSSIONS.................................... 30
2.3.1 Membrane characterization. ......................................................... 30
2.3.2 Power output of different MFCs .................................................. 32
2.4 CONCLUSION ................................................................ 35
REFERENCES ...................................................................... 37
CHAPTER 3. CARBON NANOTUBE SUPPORTED
MnO2 CATALYSTS FOR OXYGEN REDUCTION
REACTION ........................................................................... 38
3.1 INTRODUCTION ........................................................... 38
3.2 EXPERIMENTAL........................................................... 41
3.2.1 Synthesis of MnO2 Nanomaterials ............................................... 41
V
3.2.2 Electrode Fabrication ................................................................... 42
3.2.3 MFC Test System Setup .............................................................. 43
3.2.4 Electrochemical Measurement ..................................................... 45
3.3 RESULTS AND DISCUSSIONS.................................... 45
3.3.1 Characterization of Manganese Dioxide ...................................... 45
3.3.2 Cyclic Voltammetry ..................................................................... 50
3.3.3 Performance of the Cubic MFCs with Different Cathode Catalysts
...................................................................................................................... 56
3.4 CONCLUSION ................................................................ 58
REFERENCES ...................................................................... 59
CHAPTER 4. MANGANESE-POLYPYRROLECARBON NANOTUBE COMPOSITE AS OXYGEN
REDUCTION CATALYST ................................................. 61
4.1 INTRODUCTION ........................................................... 61
4.2 EXPERIMENTAL........................................................... 62
4.2.1 Preparation of manganese-polypyrrole-carbon nanotube
composite ..................................................................................................... 62
4.2.2 Electrode fabrication .................................................................... 64
4.2.3 Electrochemical measurement ..................................................... 64
4.2.4 Air-cathode MFC set-up .............................................................. 64
4.3 RESULTS AND DISCUSSIONS.................................... 65
4.3.1 Synthesis and Characterization of the catalysts ........................... 65
VI
4.3.2 Electrochemical characterization of Mn-PPY-CNT composite ... 70
4.3.3 MFC performances with various catalysts ................................... 73
4.4 CONCLUSION ................................................................ 75
REFERENCES ...................................................................... 76
CHAPTER 5. POLYELECTROLYTE
FUNCTIONALIZED-SINGLE WALL CARBON
NANOTUBES AS OXYGEN REDUCTION CATALYST.
................................................................................................ 77
5.1 INTRODUCTION ........................................................... 77
5.2 EXPERIMENTAL........................................................... 78
5.2.1 Synthesis of polyelectrolyte-SCNT composite catalyst ............... 78
5.2.2 Electrode fabrication .................................................................... 79
5.2.3 Electrochemical measurement ..................................................... 79
5.2.4 MFC setup and operation ............................................................. 80
5.3 RESULTS AND DISCUSSIONS.................................... 81
5.3.1 Characterization of polyelectrolyte-SCNT composites catalysts 81
5.3.2 Catalytic capability towards ORR with polyelectrolyte-SCNT
composites.................................................................................................... 82
5.3.3 MFC Performances with different cathode catalysts ................... 84
5.4 CONCLUSION ................................................................ 85
REFERENCES ...................................................................... 87
VII
CHAPTER 6. CONCLUSION AND OUTLOOK ....... 88
6.1 CONCLUSION ................................................................ 88
6.2 OUTLOOK OF MFC DEVELOPMENT. .................... 91
6.2.1 Bottlenecks of MFC scaling up. ................................... 91
6.2.1.1 Design constraints as determined by wastewater application ... 91
6.2.1.2. Design constraints as determined by scaling up ...................... 92
6.2.2 Future trend of MFC development. ............................ 93
REFERENCES ...................................................................... 95
PUBLICATION & CONFERENCE.................................... 96
VIII
SUMMARY
Microbial fuel cell (MFC) is a device harnessing microorganisms to
harvest electricity from wastewater. It shows great promise because of its
ability for simultaneous energy recovery and wastewater treatment. However,
it is still in its infancy with problems to be solved. For the membrane, it needs
to be selective for target molecules, corrosion-resistant and affordable. In the
cathode chamber, oxygen is often applied in the presence of expensive
platinum-based catalyst to achieve good performance, which brings high cost
and thus hinders further practical applications of MFCs. In this thesis, these
two elements are optimized in two parts.
In the first part (Chapter 2), nanoporous membranes are examined as
separators to substitute ion exchange membrane. It was found that membranes
with different pore sizes and materials performed differently. Polyethersulfone
membrane-based MFC yielded the highest power, 92% comparing with that
based on cation exchange membrane. It also possessed the lowest internal
resistance among the selected membranes possibly because of better proton
conductivity. Considering other parameters, polyethersulfone membrane
showed less satisfactory results because of the bigger pore size allowing
organics and electrons to cross over the membrane to cathode chamber,
resulting in lower COD removal and lower columbic efficiency. From a
general point of view, polyethersulfone membrane could be a cheaper
alternative as MFC separators. As for other membranes, comparable power
outputs with varied COD removal efficiencies were also achieved.
IX
In the second part (Chapter 3-5), cathode catalysts in microbial fuel cells
were studied. Several noble metal-free catalysts, namely manganese dioxide,
manganese-polypyrrole-carbon nanotube composite and polyelectrolytecarbon nanotube composite, have been synthesized and demonstrated as
efficient and stable cathode catalysts for oxygen reduction reaction (ORR).
Prepared by various methods, these catalysts were comprehensively
characterized. Subsequently, electro-catalytic capability of these novel
catalysts in neutral electrolyte was investigated by cyclic voltammetry. To
further verify catalytic capability of these catalysts, they were utilized as the
cathode catalysts in air-cathode MFCs. It was found that these catalysts
yielded efficient and stable performance with maximum power comparable to
platinum/carbon black (Pt/C) catalyst. Furthermore, the catalysts showed good
long-term stability which is essential for MFC study. Compared to Pt/C
catalyst, these noble metal-free catalysts sacrificed electricity generation
performance to some extent and reached a compromise between power output
and capital cost, thus increasing the feasibility towards MFC practical
applications. In addition, the three catalysts developed in this dissertation
represent three promising research directions for noble metal-free oxygen
reduction catalysts, and more effort could be made for further improvement by
applying different components.
In the future, novel application of MFCs such as bioremediation reactor or
on-line sensors could be explored, and our cost-effective catalysts will
facilitate this progress.
X
List of Tables
Table 1. Reactions for various electron acceptors reviewed...................... 5
Table 2. Power output parameters summarized for MFCs. ..................... 33
Table 3. Tunnel Size of Different Crystallographic Forms of MnO2. ..... 39
Table 4. Summary of air-cathode MFC performances with different
catalysts on day 11 when the MFCs have reached their performance
stabilization. ..................................................................................... 57
Table 5. Elemental content (N, Mn) and conductivity for Mn-PPY-CNT
and other composites........................................................................ 67
Table 6. Summary of air-cathode MFC performances with different
catalysts when the MFCs have reached their performance
stabilization. ..................................................................................... 75
Table 7. Elemental contents of different composites. .............................. 82
Table 8. Detailed breakdown of N1s signal with peak position and
relative composition of different nitrogen groups. .......................... 83
Table 9. Performance of air-cathode MFCs based on different cathode
catalysts. ........................................................................................... 85
XI
List of Figures
Figure 1. Diagram for basic structure of a microbial fuel cell. .................. 2
Figure 2. Polarization curve (electrochemical losses) and power curve of
MFCs.................................................................................................. 7
Figure 3. Typical cell configurations applied in MFC reactors. .............. 11
Figure 4. Schematic illustration of three main categories of cathode
catalysis in MFCs. ............................................................................ 16
Figure 5. Radar plots to summarize performances of various catalysts by
evaluating six elements. ................................................................... 20
Figure 6. Morphologies of various membranes before (a) and after (b)
applications in MFCs together with their polymer structures (c). ... 31
Figure 7. Voltage versus time curves in MFCs with different membranes
in one batch. ..................................................................................... 32
Figure 8. Polarization (A) and power (B) curves of MFCs. .................... 34
Figure 9. Schematic presentation of MnO6 unit from different viewing
direction. .......................................................................................... 38
Figure 10. Different crystalline structures of MnO2 nanomaterials. ........ 40
Figure 11. Schematic diagram of MFC reactor configuration. ................ 43
Figure 12. A representative photo of an MFC system. ............................ 44
Figure 13. XRD patterns of prepared MnO2 samples. ............................. 46
Figure 14. Typical SEM images of three types of MnO2 nanoparticles,
and the prepared catalyst mixtures coated on GCEs. ....................... 47
Figure 15. SEM images of MnO2 nanomaterials at different dwelling
time. ................................................................................................. 48
XII
Figure 16. XRD patterns of β-MnO2 nanomaterials at different dwelling
time. ................................................................................................. 49
Figure 17. CVs for ORR in 0.2 M NaCl solution between 0.2 and -1.0 V
at the scan rate of 50 mVs-1 with different catalysts and conditions.
.......................................................................................................... 50
Figure 18. CVs for β-MnO2 based catalyst supported by CNTs (line a)
and graphite powder (line b) for ORR respectively. ........................ 52
Figure 19. CVs for β-MnO2 based catalyst supported by CNTs for ORR
with different scan rates. .................................................................. 53
Figure 20. Optimization of β-MnO2 based catalyst by varying component
and loading amount. ......................................................................... 54
Figure 21. Polarization and power curves for air-cathode MFCs
respectively on Day 11 when MFCs have reached their performance
stabilization. ..................................................................................... 56
Figure 22. Schematic representation of the preparation procedure for
manganese-polypyrrole-carbon nanotube composite. ..................... 62
Figure 23. FTIR spectrum of PPY prepared by chemical-oxidation
polymerization, the same method for Mn-PPY-CNT preparation
except the addition of pyrrole and CNTs. ........................................ 66
Figure 24.
X-ray photoelectron
spectroscopy of Mn-PPY-CNT
composite. ........................................................................................ 67
Figure 25. Morphology for composites prepared by solvothermal method.
.......................................................................................................... 68
Figure 26. XRD pattern of Mn-CNT and standard Mn3O4 XRD pattern.69
Figure 27. CVs for ORR in 0.2 M NaCl solution between 0.2 and -1.0 V
at the scan rate of 50 mVs-1 with different catalysts and conditions.
.......................................................................................................... 70
XIII
Figure 28. Morphology (A) and electrochemical characterization (B) for
Mn-PPY-CNT composite prepared in ethanol with the same
solvothermal method. ....................................................................... 71
Figure 29. CVs for Mn-PPY-CNT-based catalyst for ORR with different
scan rates. ......................................................................................... 73
Figure 30. Polarization and power curves for air-cathode MFCs
respectively
when
MFCs
have
reached
their
performance
stabilization. ..................................................................................... 74
Figure 31. Illustration of the proposed catalytic mechanism(A).
Interaction between O2 and composite catalysts. Polyelectrolytes
used
are
(B)
poly[bis(2-chloroethyl)
(dimethylamino)propyl]urea]
and
ether-alt-1,3-bis[3(C)
poly(diallyldimethylammonium chloride). ...................................... 79
Figure 32. SEM images of different composites. .................................... 81
Figure 33. CVs for ORR with different catalysts and conditions. ........... 82
Figure 34. XPS spectra of N1s for different composites. ........................ 84
Figure 35. Polarization and power curves for air-cathode MFCs. ........... 85
XIV
Chapter 1. Introduction
Chapter 1. Introduction
In the past decades, owing to the shortage of fossil fuels and significant
influences of global warming, alternative energy sources have been urgently
required and research work in this field has greatly intensified. Biomass
energy is a promising renewable alternative because of its ultimate source of
sunlight and availability in large amounts as residual biomass. However, it is
an inconvenient energy carrier for industrial use because of its low energy
density and impracticable transportation. Therefore, it would be ideal to
convert it into other energy forms, including methane, hydrogen gas and
bioelectricity. On the other hand, the large amount of residual biomass still
needs special treatments with considerable energy consumption if not properly
utilized for energy recovery. Microbial fuel cell (MFC) comes into being in
response to these demands/ problems.1
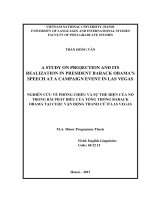
Briefly, an MFC is a reactor to convert energy in biomass residue
(especially wastewater) into bioelectricity (Figure 1). It comprises a bioanode,
a cathode and normally a separator. Exoelectrogenic microbes (electroactive
bacteria) form a biofilm on the surface of anode to degrade organic matters
into small molecules with electrons and protons. Electrons travel along the
external circuit from the anode to cathode for electron acceptor reduction,
while protons migrate through the separator in the opposite direction to
complete a whole circuit. The net result of an MFC is simultaneous organic
matter degradation in wastewater and electricity recovery, presenting great
promise in terms of energy recovery.
1
Chapter 1. Introduction
Figure 1. Diagram for basic structure of a microbial fuel cell.
Nonetheless, challenges still remain in MFC development, e.g.
exoelectrogenic bacteria species,2 scalable configurations,3 high capital cost,4
etc. To achieve higher power output, electron acceptor at the cathode is one of
the key factors to be optimized.5 In an MFC, the overall voltage generated is
determined by the potential gap between cathode and anode. For a fixed anode
potential, the higher the cathode potential induced by electron acceptors, the
higher the overall voltage is. Till now, many compounds have been
investigated as electron acceptors, e.g. ferricyanide, nitrate and oxygen. 6
In the following part of introduction chapter, fundamentals of MFCs will
first be introduced, and then membranes and various electron acceptors are
2
Chapter 1. Introduction
addressed. Following on, oxygen is selected as the electron acceptor and
catalysts for oxygen reduction reaction (ORR) are discussed and evaluated;
strengths and limitations of previous catalysts are addressed, leading to the
objective of this thesis.
1.1 FUNDAMENTALS ABOUT MFCS
1.1.1 Thermodynamic fundamentals
MFC is a galvanic cell. Redox reactions occur spontaneously at anode and
cathode, inducing a negative Gibbs free reaction energy. Therefore the
standard cell voltage for an MFC could be calculated accordingly.
'
'
∆Eθ ' = − ∑ vi ∆Giθ, products − ∑ v j ∆Gθ,educts / nF
Equation 1
j
θ
Here, the values of ∆ G represent the free energies for the formation of
respective products and educts, v is the stoichiometry factor of the redox
reaction, n (dimensionless) is the number of electrons transferred in the
reaction and F (96500 Cmol-1) is the Faraday’s constant.
A positive standard cell voltage would be generated, because of a negative
Gibbs free reaction (Equation 1), making MFC an exergonic device. For a
single electrode, the theoretical ideal potential could be predicted from the
electrode reaction by Nernst Equation thermodynamically (Equation 2):
RT
ln(Π)
Equation 2
nF
where Eθ’ (V) is the theoretical potential generated for reactions under the
Eθ ' = Eθ −
experimental conditions, Eθ (V) is the standard potential under standard
conditions (chemical activity = 1 for all reactants and products, 298 K), R
(dimensionless) is ideal gas constant, T (K) is the reaction temperature, and Π
(dimensionless) is the chemical activity of products divided by those of
reactants.
θ'
C2 H 4 O2 +2H 2O → 2CO 2 +8H + +8e- Eanode = −290mV
Equation 3
Acetate is a common choice of substrate in a lab-scale MFC reactor.
When it is applied as the anodic half reaction and combined with various
3
Chapter 1. Introduction
cathode reactions, a large range of standard cell voltages could be generated
(Table 1). In a practical situation, however, the effective cell voltage is
considerably lowered in presence of electrochemical overpotential (losses), ηi.
θ
Ecell = ∆Eθ ' − ∑ηi = ( ECat' − Eθ ' ) − ∑ηi
An
Equation 4
Thus, the occurrence of overpotential leads to the fact that less energy is
produced in a galvanic cell than thermodynamically possible (lower cell
voltage). The sources of the electrochemical losses that cause the reduction of
the cell voltage are illustrated in the following section.
4
Chapter 1. Introduction
Table 1. Reactions for various electron acceptors reviewed.
Electron
Cathode reaction
Eθ a/ V
Eθ’ a/ V
∆Eθ a/ V
∆Eθ’ a/ V
Conditions
Fe(CN)63-
Fe(CN)63-+e-→Fe(CN)64-
0.36
0.36
0.65
0.65
[Fe(CN)63-] = [Fe(CN)64-]
MnO4-
MnO4-+3e-+4H+→MnO2+2H2O
1.70
1.10
1.99
1.39
[MnO4-] = 5 mM, pH = 7
O2
O2+4e-+4H+→2H2O
1.23
0.80
1.52
1.10
pO2 = 0.2, pH = 7
NO3-
2NO3-+10e-+12H+→N2+6H2O
1.25
0.73
1.54
1.02
[NO3-] = 5 mM, pN2 = 0.2, pH =7
NO3-
NO3-+2e-+2H+→NO2-+H2O
0.84
0.42
1.12
0.71
[NO3-] = [NO2-], pH=7
ClO4-
ClO4-+8e-+8H+→Cl-+4H2O
1.29
0.87
1.58
1.16
[ClO4-] = [Cl-], pH = 7
S2O82−
S2O82−+2e−→2SO42−
1.96
1.96
2.25
2.25
[S2O82−] = [SO42−] = 5 mM
Cr2O72-
Cr2O72-+6e-+14H+→2Cr3++7H2O
1.36
0.42
1.65
0.71
[Cr2O72-] = [Cr3+] = 5 mM, pH = 7
VO2+
VO2++ e-+2H+→VO2++H2O
1.00
0.17
1.29
0.46
[VO2+] = [VO2+], pH=7
Cu2+
Cu2++2e-→Cu(s)
0.34
0.27
0.63
0.56
[Cu2+] = 5 mM
acceptor
5
Chapter 1. Introduction
-N=N-
−N=N−+2e-+2H+→−NH=NH−
N. A. b
N. A.
N. A.
N. A.
N. A.
-N=N-
−N=N−+4e-+4H+→‒NH2‒NH2‒
N. A.
N. A.
N. A.
N. A.
N. A.
O2
O2+2e-+2H+→H2O2
0.70
0.33
0.99
0.62
pO2 = 0.2, [H2O2] = 5 mM, pH = 7
N. A.
N. A.
N. A.
N. A.
N. A.
6CO2+12e-+12H+→-C6H12C6-
CO2
(biomass)+3O2
a.
Eθ is the standard potential for the oxidant at 25 oC. Note: Chemical reactivities of all the reactants and products were 1 M, for
gaseous component, p=1, p is pressure; Eθ’ is the potential calculated using Equation 2 and standard potential (Eθ) under practical conditions
(indicated as conditions) at 298 K. Note: M stands for mol/L; ∆Eθ and ∆Eθ’ are the potentials calculated when combined with the anode
reaction in Equation 3.
b.
N. A. represented “not available”.
6
Chapter 1. Introduction
1.1.2 Electrochemical losses of MFCs- an overview
MFCs
In this section, an overview on the major electrochemical losses in MFCs is
MFC
provided and the sources of these losses are identified. 6
As shown in Figure 2, a polarization curve is plotted by cell voltage against
current flow while a power curve is plotted by power output against current flow.
According to different polarization levels indicated by current flow, four
categories of losses could be summarized.
Figure 2. Polarization curve (electrochemical losses) and power curve of MFCs.
Open circuit region: There is a negative deviation at OCV because of two
major losses. Both losses are not related to current flow but rather related to
catalyst properties. The thermod
thermodynamic overpotential (ηthermo.) refers to the
refer
deviation from the standard cell voltage calculated at respective experimental
he
conditions due to the presence of reaction cascades, i.e. in a bioanode, the loss is
7
Chapter 1. Introduction
determined by the corrected biological standard potential of substrate, the
extracellular electron transfer species and the outer membrane cytochrome. Side
reaction overpotential (ηsidereact) is introduced by the unwanted reactions
decreasing not only the efficiency in electron utilization (coulombic efficiency)
but also the voltage generated due to mixed potential formation. Incomplete
reactions, substrate crossover with internal current, biomass production by
metabolism in biofilms (bacteria survival and proliferation) are the major
categories of side reactions.
Region I
MFC
combines
conventional
heterogeneous
electrocatalysis
and
bioelectrocatalysis in both electrodes. In a conventional heterogeneous
electrocatalysis (e.g. at metals or metal oxides), the overpotential is brought by
the interfacial kinetics (ηsur.kinet.) at low current flow. However, in a
bioelectrocatalysis system, another rate-limiting step because of metabolism is
introduced as turnover rate (ηturnover), making the actual substrate conversion
reaction departed from for the interfacial kinetics. Nevertheless, the loss by
turnover rate often occurred at high current flow, and would be further illustrated
in Region III.
Region II
In this region, the ohmic overpotential (ηohm) is caused by the resistance of the
electrodes, electrolyte solution, and the separator membrane against the flux of
ions as well as of the electrode materials against the electron flow. Both the
electron flow and ion flux resistance obey Ohm’s law. Thus, the ohmic
polarization is proportional to the current: ηohm= i×Rin, where i is the current flow,
and Rin is the total cell resistance, comprising electronic, contact and ionic
resistances. Therefore, the polarization curve exists in linear pattern in this region
with the slope of ohmic resistance. Moreover, it was easily to be calculated that
when the external resistance (Rex) equals Rin, maximum power on external
8
Chapter 1. Introduction
resistance (Pmax) will be generated as illustrated in the power curve (Figure 2).
Region III
The concentration overpotential (ηconc.) is caused by fast reactant consumption
with insufficient substrate supply as well as accumulation of products at the
electrode surfaces at high current flow. The generation of pH gradients could also
be viewed as concentration overpotential. It typically exists in biological systems
which mostly operated at near-neutral pH range and at often low ionic strength,
attributed to the insufficient proton transfer across the membranes. Other than
this, loss determined by kinetics also exists in bioelectrocatalyst system as
substrate turnover at the catalytic active sites (ηturnover). At increasing current
density the catalytic centre of a biocatalyst (enzyme or microorgansim) is not able
to further increase the supply of oxidation/reduction equivalents to respective
electrodes. This is simply determined by the microbial metabolic rate and it shows
similar appearance in a polarization plot to the concentration overpotential in
region III. 6
Ecell = ∆Eθ ' − ∑ηohm − ∑ηconc. − ∑ηthermo. − ∑ηsidereact . − ∑ηsur .kinet . − ∑ηturnover
1442443 144444444
244444444
3
operational −losses
catalyst −based −losses
Equation 5
As summarized in Equation 5, the potential losses can be divided into (i)
operational losses that are determined by fuel cell design (membrane selection,
section 1.2), mass transfer limitation, electrolyte conditions (pH, ionic strength)
and (ii) catalyst based losses that are associated with electrocatalysts (section 1.3)
1.2 MEMBRANES IN MFCS.
In MFCs, membranes are mainly used as separator/barrier to keep the oxidant
in the cathode side from reaching the anode biofilm and also keep the liquid
containing the organic matters in the anode chamber from reaching the cathode to
reduce internal current. The membrane could be immersed with aqueous
electrolyte in dual-chamber MFCs and always saturated, and it could also be used
in single-chamber MFCs by incorporating membrane-cathode-assembly (MCA)
9
Chapter 1. Introduction
configuration.
The main challenge in choosing a membrane is to find one selective for the
target charge-carrying species. Protons are generated at the anode by
exoelectrogenic bacteria, and consumed at the cathode through electron acceptor
reduction, but it is not the only choice as dominant charge-carrying species
through the membrane. Cations, such as K+ and Na+, present at higher
concentrations than H+, possess higher possibility to be the charge-carrying
species. This transfer of positive charges rather than protons induces pH
imbalances around the electrodes. Bipolar membrane could possibly be used to
solve the problem. In addition, non-selective nanoporous membranes allowing
both the cation and anion to pass through under the driving force of concentration
gradient could be tried. Another function of the membrane is to reduce the oxygen
diffusion from cathode to anode, and therefore maintain the dominant species as
exoelectrogenic bacteria in anode biofilm. Considering these, Nafion membrane is
normally selected as proton exchange membrane (PEM); with the use of buffer
solution for pH stabilization, and cation exchange membrane could also be used.
These two types of membranes are quite expensive, and nowadays some cheap
materials are applied despite sacrificing some performance, to facilitate future
scaling up. 7
1.3 CATHODE REACTIONS IN MFCS.
As described in section 1.1, the voltage generated by MFC could be calculated
using Equation 4. With a fixed anode (material, bacteria, wastewater feature, etc.),
θ
the cell voltage is related to the electron acceptor species ( E cat ), operation-related
losses
(
∑η
thermo.
∑η
− ∑η
(
ohm
− ∑ηconc. ),
sidereact
and
also
catalyst-related
losses
− ∑ηsur.kinet. − ∑ηturnover ). The inevitable operation-related
losses are quite dependent on the cell configurations (Figure 3) and electrolyte
condition, while the selection of electron acceptor species and the catalysts for
10
Chapter 1. Introduction
reaction acceleration could be optimized for higher electricity generation.
Ecell = E θ −
RT
RT
θ
θ
ln(Π ) − ∑ηi =
Ecat
− Ean −
ln(Π )
{
zF
zF
acceptor − related
− ∑ηohm − ∑ηconc. − ∑ηthermo. − ∑η sidereact . − ∑η sur .kinet . − ∑ηturnover
1442443 144444444
244444444
3
operational −losses
catalyst − based −losses
Equation 6
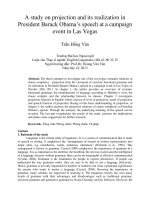
Figure 3. Typical cell configurations applied in MFC reactors.
.
a). H-type MFC; b). Single
type
Single-chamber cubic MFC; c). Double-chamber cubic MFC; d). Single
chamber
Singlechamber tubular MFC; e). Double-chamber tubular MFC. Note: the electrode materials could
Double chamber
be varied, e.g. plain carbon paper, carbon cloth, carbon felt, carbon brush and granular
graphite; DAS: data acquisition system; Rex: external resistor.
:
Till now, many electron acceptors and catalyst species have been investigated.
In this section, two parts would be discussed as (1) electron acceptors applied in
acceptors
MFCs, (2) electrocatalysts applied in air
air-cathode MFCs.
11