Luminescent materials for organic light emitting diodes (OLEDs) and bioimaging
Bạn đang xem bản rút gọn của tài liệu. Xem và tải ngay bản đầy đủ của tài liệu tại đây (4.02 MB, 211 trang )
LUMINESCENT MATERIALS FOR ORGANIC LIGHT-EMITTING DIODES
(OLEDS) AND BIOIMAGING
YAO JUN HONG
NATIONAL UNIVERSITY OF SINGAPORE
2007
LUMINESCENT MATERIALS FOR ORGANIC LIGHT-EMITTING DIODES
(OLEDS) AND BIOIMAGING
YAO JUN HONG
A THESIS SUBMITTED FOR THE DEGREE OF DOCTOR OF SCIENCE
DEPARTMENT OF CHEMISTRY
NATIONAL UNIVERSITY OF SINGAPORE
2007
Acknowledgements
I would like to express my deepest sense of gratitude to my supervisor Dr. Chen Zhi
Kuan for his valuable guidance, discussions, advice, continued encouragement and
inspirations throughout my Ph. D. study. With sincere thanks, I want to thank my co-
supervisor, Assoc. Professor Loh Kian Ping for his constant support and suggestion
during the years. I gratefully appreciate his kind help and concern.
I wish to express my gratitude to our group members, Soon Yee, Huang Chun,
Chang Gua, Richard, Meili, Ahmed, Mdm. Xiao Yang and Kok Haw. It is a big pleasure
to have the opportunity to work together and learn from them. I feel lucky to work in
such a harmonious lab.
I am also grateful to Dr. Li Xu and Dr. Khine Yi Mya who have devoted their
valuable time to instruct me in micelle sample preparation and property measurements. I
would also say thanks to Mr. Loh Xian Jun for GPC measurement and Ms. Shen Lu for
patient AFM training.
Special thanks and appreciation are due to my good friends in China for their non-
stop support all the time.
I would like to express my thanks to Institute of Materials Research and
Engineering (IMRE) and National University of Singapore (NUS) for the award of the
research scholarship.
Finally, I wish to pay my gratitude to my loving family members, my parents and
my cousin Sun Lei for their encouragement and moral support throughout my studies.
i
Table of contents
Acknowledgment i
Table of contents ii
List of abbreviation and symbols vii
List of Tables xi
List of Figures xii
Summary xvi
Part I Phosphorescent materials for OLEDs
Chapter 1 Introduction 1
1.1 Mechanism and structures of organic light-emitting diodes
(OLEDs) 2
1.2 Light-emitting materials for OLEDs 7
1.2.1 Fluorescent materials 9
1.2.2 Phosphorescent materials 12
1.2.2.1 Transitional metal complexes 13
1.2.2.2 Iridium complexes and their advantages 15
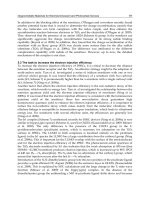
1.3 Challenges for the phosphorescent OLEDs research 24
1.4 Objectives and significance 25
References 28
ii
Chapter 2 Development of highly efficient small molecular iridium complex
for OLEDs
2.1 Molecular design 35
2.2 Synthesis and characterization 38
2.3 Experimental details 43
2.4 Results and discussion 55
2.4.1 Optical analysis 55
2.4.2 Thermal analysis (TGA and DSC) 58
2.4.3 Electrochemical properties 61
2.4.4 Device structure and performance 64
2.5 Conclusions 76
2.6 Outlook 78
References 80
Chapter 3 Development of highly efficient polymeric Ir complexes for
OLEDs
3.1 Molecular design 84
3.2 Synthesis and characterization 87
3.2.1 Monomer synthesis 87
3.2.2 Polymer synthesis 92
3.3 Results and discussion 94
3.3.1 Polymer synthesis 95
3.3.2 Optical analysis 95
iii
3.3.3 Thermal analysis 96
3.3.4 Electrochemical properties 98
3.4 Conclusion 99
3.5 Outlook 100
References 101
Part II Fluorescent materials for bioimaging
Chapter 1 Introduction 103
1.1 Block copolymer 103
1.1.1 Preparation techniques for micelles 106
1.1.2 Critical aggregation concentration (CAC) 106
1.1.3 Morphology of amphiphilic block/copolymers in selective solvent 108
1.2 Characterization methods 113
1.2.1 Chemical structure characterization 113
1.2.1.1 Nuclear magnetic resonance (NMR) 113
1.2.1.2 Gel permeation chromatography (GPC) 114
1.2.2 Optical property 115
1.2.2.1 UV-vis absorption spectroscopy 115
1.2.2.2 Photoluminescence (PL) 116
1.2.3 Light scattering 117
1.2.3.1 Static light scattering (SLS) 117
1.2.3.2 Dynamic light scattering (DLS) 118
1.2.4 Morphology 119
iv
1.2.4.1 Atomic force microscopy (AFM) 120
1.2.4.2 Transmission electron microscopy (TEM) 121
1.3 Application of block copolymer micellar systems 122
1.4 Luminescent materials and their applications in biolabelling 124
1.4.1 Organic fluorescent probes 125
1.4.1.1 Organic dyes 125
1.4.1.2 Fluorescent proteins 126
1.4.2 Inorganic fluorescent probes 127
1.4.2.1 Quantum dots (QDs) 127
1.4.2.2 Silica nanoparticles (SNs) 128
1.5 Objectives and significance 129
References 132
Chapter 2 Design and synthesis of fluorescent amphiphilic graft copolymer
2.1 Molecular design 139
2.2 Experimental details 144
References 157
Chapter 3 Results and discussion
3.1 Synthesis and characterization 159
3.1.1 Monomer synthesis 159
3.1.2 Polymer synthesis and characterization 160
3.2 Light scattering measurements 163
v
3.2.1 CAC measurement and size distribution 164
3.2.2 Aggregation number and apparent molecular weight
measurement 169
3.3 Morphology characterization 171
3.3.1 Atomic force microscopy (AFM) 171
3.3.2 Transmission electron microscopy (TEM) 176
3.4 Optical property 179
3.4.1 Steady fluorescence spectroscopy 180
3.4.2 Time-resolved fluorescence spectroscopy 184
3.5 Cytotoxicity evaluation and biolabeling 187
References 188
Chapter 4 Conclusions
4.1 Conclusions 190
4.2 Outlook 192
vi
List of Abbreviations and Symbols
acac acetyl acetone
a. u. arbitrary unit
AFM atomic force microscopy
Alq tris-(8-hydroxyquinoline)aluminum (III)
3
BCP 2,9-dimethyl-4,7-diphenyl-1,10-phenanthroline
BuL butyl lithium
CAC critical association concentration
CBP 4,4’-N, N’-dicarbazole-biphenyl
CDCl deuterated chloroform
3
CIE commission Internationale de l’Echairage
CV cyclic voltammetry
DCM dichloromethane
DSC differential scanning calorimetry
DLS dynamic light scattering
EBL electron-blocking layer
EL electroluminescence
EQE external quantum efficiency
ETL electron transport layer
GPC gel permeation chromatography
HBL hole-blocking layer
1
H-NMR proton nuclear magnetic resonance spectroscopy
vii
HOMO highest occupied molecular orbital
HTL hole transport layer
ITO indium tin oxide
LS light scattering
LUMO lowest unoccupied molecular orbital
MLCT metal-ligand charge transfer
MS mass spectrometry
NPB N, N’-diphenyl-N, N’-bis(1-naphthyl)–(1,1’-biphenyl)-4,4’-
diamine
NBS N-bromoosuccinimide
NMR nuclear magnetic resonance
OLEDs organic light emitting diodes
PBD 2-(4-biphenylyl)-5-(4-tert-butylphenyl)-1,3,4-oxadiazole
PDI polydispersity index
Pd(PPh ) tetrakis(triphenylphosphine)palladium (0)
3 4
PE power efficiency
PEDOT/PSS poly(3,4-ethylenedioxythiophene)/polystyrene sulfonate
PEO poly(ethylene oxide)
PEG poly(ethylene glycol)
PF polyfluorene
PL photoluminescence
PPO poly(propylene oxide)
PPP poly (para-phenylene)
viii
PPV poly (phenylenevinylene)
PS poly(styrene)
PT polythiophene
PVK poly (vinylcarbazole)
QD quantum dots
RT room temperature
SLS static light scattering
TAZ 3-(4-biphenyl)-4-phenyl-5-tert-butylphenyl-1,2,4-triazole
TBAPF tetrabutylammonium hexafluorophosphate
6
TCSPC time-correlated single-photon counting
TCTA 4,4’,4’’-tris (N-carbazolyl)-triphenylamine
TEM transmission electron microscopy
TGA thermogravimetric analysis
THF tetrahydrofuran
TPBI 2,2’,2’’-(1,3,5-phenylene)tris(1-phenyl-1H-benzimidazole)
TPD N,N’-diphenyl-N, N’-bis(3-mehtylphenyl)-1,1’-biphenyl-4, 4’-
diamine
UV-vis ultraviolet-visible
δ chemical shift
λ wavelength
second virial coefficient
A
2
dn/dc refractive index increment
eV electron volt
ix
E
pa
anodic peak potential [V]
E
pc
athodic peak potential [V]
fs femtosecond
M number averaged molecular weight
n
M weight averaged molecular weight
w
M apparent molecular weight of aggregates
w,agg
N aggregation number
agg
ppm parts per million
R radius of gyration
g
R hydrodynamic radius
h
τ lifetime
T glass transition temperature
g
x
List of Tables
Part I
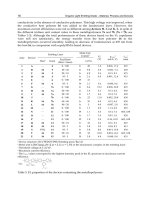
Table 2.1 Photophysical properties of Ir complexes in anhydrous DCM. 58
Table 2.2 Electrochemical properties of Ir complexes in anhydrous DCM. 63
Table 2.3 Summary electroluminescence (EL). 69
Table 2.4 Device characteristics of Ir complexes C1-C7. 75
Table 3.1 Molecular weights and PDIs of phosphorescent polymers P1-P4. 94
Table 3.2 Photophysical properties of Ir complexes P1-P4 in anhydrous DCM. 96
Table 3.3 Onset temperature of weight loss and temperature for 5% weight loss
under N
2
97
Table 3.4 Electrochemical properties of the copolymers films in acetonitrile. 99
Part II
Table 2.1 Molecular weights and PDIs of all the amphiphiles. 156
Table 3.1 CAC values and radii of hydrodynamic (R
h
) of amphiphilic polymers
in aqueous solution at room temperature. 166
Table 3.2 Summary of UV-vis absorption and PL spectra amphiphilic graft
copolymers in DCM and aqueous solutions at room temperature 183
Table 3.3 Fluorescence quantum yields of polymeric micelles in aqueous
solution at room temperature. 183
Table 3.4 Fluorescence lifetime of OFP1, RFP and FFP3 in aqueous solution
at room temperature. 186
xi
List of Figures
Part I
Figure 1.1 Molecular structures of Alq , TPD and PPV. 2
3
Figure 1.2 Sandwich structure of OLEDs. 3
Figure 1.3 Structures of PEDOT/PSS and CuPc. 4
Figure 1.4 Hole-transporting materials for OLEDs. 5
Figure 1.5 Electron-transporting materials for OLEDs. 6
Figure 1.6 Schematic energy level diagram of an (a) single-layer OLED and (b)
OLED with additional hole-injection/hole transport/hole-blocking
/electron injection layers. 6
Figure 1.7 Simplified Jablonski diagram. 8
Figure 1.8 Structures of small molecular fluorescent materials for OELDs. 9
Figure 1.9 Structures of conjugated polymers. 11
Figure 1.10 Phosphorescent cyclometalated complexes for OLEDs. 14
Figure 1.11 Structure of green, red and blue light-emitting Ir complexes. 16
Figure 1.12 Structures of RGB Ir dendrimeric complexes. 18
Figure 1.13 Energy levels of an efficient host and guest system. 20
Figure 1.14 Host materials of TCTA and PVK. 21
Figure 1.15 Structure of PF-Cz-Ir complexes. 22
Figure 1.16 Structures of PF-Py-Ir and PF-T-Ir complexes. 23
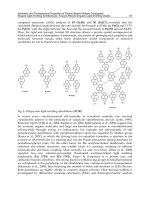
Figure 2.1 3D structure of spirobifluorene. 35
Figure 2.2 Structures of spirobifluorene based ligands. 37
Figure 2.3 Structures of bis-cyclometalated Ir complexes. 38
Figure 2.4 Stereochemical representations of chloride-bridged dimer, heteroleptic
and homoleptic Ir complexes. 43
Figure 2.5 UV-vis absorption spectra of Ir complexes in anhydrous DCM. 56
xii
Figure 2.6 PL Spectra of complex C1-C7 in anhydrous DCM. 57
Figure 2.7 Thermalgravimetric analysis of Ir complex C1 in nitrogen atomosphere 59
Figure 2.8 Thermalgravimetric analysis of Ir complex C3 in a nitrogen atmosphere. 60
Figure 2.9 DSC trace of C1 under nitrogen atmosphere. 61
Figure 2.10 Cyclic voltammogram of Ir complex C1 in anhydrous DCM containing
TBAPF as supporting electrolyte. 63
6
Figure 2.11 Device configuration for Ir complexes. 65
Figure 2.12 EL spectra of complex C1-C7. 67
Figure 2.13 CIE coordinates of all the Ir complexes C1-C7. 69
Figure 2.14 V-I-L curves of device based on Ir complexes C1-C7. 71
Figure 2.15 Luminance efficiency and external quantum efficiency of the devices
based on Ir complex C1-C7. 73
Figure 3.1 Chemical structure of triphenylamine. 85
Figure 3.2 Chemical structure of polymeric Ir complexes. 87
Figure 3.3 NMR spectra of phosphorescent polymer P1-P4 in d-CD Cl
2 2
. 94
Figure 3.4 UV and PL spectra of M1 and P1-P4 in anhydrous DCM solution. 95
Figure 3.5 Thermalgravimetric analyses of copolymers under nitrogen atmosphere 97
Figure 3.6 Cyclic voltammagrams of P4 films in acetonitrile solution at room
temperature under nitrogen. 98
Part II
Figure 1.1 Architecture of copolymer chains. 104
Figure 1.2 Schematic representations of the most common self-organization
structures of diblock copolymers in solution. 109
Figure 1.3 Schematic representation of micellization process. 111
Figure 1.4 Schematic diagram of GPC. 115
Figure 1.5 Fluorescent image of tissues. 125
xiii
Figure 1.6 Chemical structures of rhodamine and fluorescein. 126
Figure 1.7 Size dependent color of QDs. 128
Figure 2.1 Structures of fluorescent amphiphilic graft copolymers. 144
1
H NMR spectrum of RFP in d-chloroform. 156
Figure 2.2
Figure 3.1 PL spectra of BF, TF, OFP1, OFP2 and OFP3 in THF. 161
Figure 3.2 GPC spectrum of RFP (a) before purification and (b) after purification 162
Figure 3.3 GPC spectrum of FFP3 (a) before purification and (b) after purification 162
Figure 3.4 Variation of scattering light intensity as a function of sample
concentration of RFP. 165
Figure 3.5 Hydrodynamic diameter distributions of (a) OFP1 at 1 mg/mL
concentration, (b) OFP2 at 1 mg/mL concentration (c) OFP3 at 1
mg/mL concentration, (d) RFP at 0.1 mg/mL concentration, (e) FFP1 at
0.01 mg/mL concentration and (f) FFP2 at 0.01 mg/mL concentration in
H
O at room temperature. 168
2
Figure 3.6 Zimm plot of OFP1, the concentration c changes from 1.0 to 3.0
mg/mLin water at 25
◦
C. 170
Figure 3.7 AFM height images (tapping mode) on mica of OFP1 with the
concentration of (a) 1 mg/mL, (b) 0.5 mg/mL and (c) 3-D image at the
concentration of 0.5 mg/mL. 172
Figure 3.8 AFM height images (tapping mode) on mica of OFP3 at the
concentration of 0.08 mg/mL. 173
Figure 3.9 AFM height image (tapping mode) of RFP at concentration of 0.6
mg/mL on mica (a) 10 μm* 10 μm, (b) 2 μm* μm, (c) 3-D image. 174
Figure 3.10 AFM height image of FFP1 at the concentration of 0.008 mg/mL on
mica. 175
Figure 3.11 AFM height image of FFP1 on mica at the concentration of 0.01 mg/mL.
176
Figure 3.12 Stained TEM micrographs of (a) & (b) OFP1 and (c) & (d) OFP2 on
400-mesh carbon-coated copper grid at the concentration of 0.5 mg/mL. 177
Figure 3.13 Stained TEM micrographs of RFP on 400-mesh carbon-coated copper
grid with the concentration of 0.6 mg/mL. 178
xiv
Figure 3.14 Stained TEM micrographs of FFP3 on 400-mesh carbon-coated copper
grid at the concentration of 0.01 mg/mL. 179
Figure 3.15 UV-vis absorption and PL emission spectra of OFP1, OFP3, RFP and
FFP3 in DCM and water at room temperature. 180
Figure 3.16 TCSPC decay profiles of OFP1 in DCM and aqueous solution at the
concentration of 1 mg/mL, observation wavelengths were 430 nm and
530 nm, respectively. 185
Figure 3.17 The effect of culture time and concentration of fluorescent micelles on
the growth of BV-2 cells 187
Figure 3.18 Confocal images of activated BV-2 cells cultured for 2 hours in the
presence of fluorescent micelles solution (0.003 mg/g) after stimulated
by stimulating agent (SA) for 24 hours at different concentration 188
xv
Summary
Luminescent materials can find wide application in flat-panel-display and biolabeling
technologies. The focuses of this project are the design and synthesis of phosphorescent
small molecules and polymers for organic light-emitting diodes (OLEDs) and fluorescent
amphiphilic graft copolymers for bioimaging.
The first topic is the design, synthesis and application of phosphorescent small
molecular iridium complexes based on three dimensional spirobifluorene ligands. Yellow
to red light emission of iridium complexes were obtained by modifying ligand structures.
All the iridium complexes have been obtained in good yields with well-defined facial
conformation structures. The device based on new guest materials and PVK host
materials realized highest external quantum efficiency of 10%. The device performance
can be improved further by optimizing device structure.
The second topic is related to the synthesis and characterization of phosphorescent
polymers with fluorene-co-diphenylamine backbones and iridium complex pendant group.
The feed ratio of iridium complexes was changed from 4% to 10%, 15% and 20 % in
mole fractions to tune the energy levels of the polymers. The energy gap of the polymers
decreased with the increase of iridium complex. All the resulting polymers demonstrated
excellent thermal stability and film-forming ability.
The last section is referred to the synthesis, characterization and application of a
series of fluorescent amphiphilic graft copolymers containing oligofluorene/polyfluorene
backbones and poly(ethylene glycol) side chains. The copolymers self-assemble into
nano-scaled micelles. The water solubility and micelle size were tuned in wide range by
structure modification. Monodispersed fluorescent nanoparticles have been developed.
xvi
Their self-assembling behaviors and morphologies were studied by light scattering, TEM
and AFM. Their optical properties were investigated by steady state and time-resolved
fluorescence spectroscopy. Preliminary biocharacterization of the fluorescent micelles
demonstrated excellent stability and non-cytotoxicity. Potential application of the
micelles for bio-imaging has been substantiated by BV-2 cells.
Keywords: Phosphorescent materials, spirobifluorene, iridium complex, organic
light-emitting diodes (OLEDs), polyfluorene, triphenylamine, Suzuki coupling,
fluorescence, amphiphilic graft copolymer, PEG, self assembling, micelle, bioimaging.
xvii
Part I Phosphorescent materials for OLEDs Chapter 1
1. Introduction
Electroluminescence (EL) is a non-thermal generation of light resulting from the
application of an electric field to an active material by radiative decay of an excited state
of the material.
1
The process responsible for electroluminescence requires injection of
electrons from one electrode and holes from the other, the capture of oppositely charged
carriers (recombination), and the radiative decay of the excited electron-hole state pairs
(excitons) produced by this process.
Electroluminescence was first discovered by Destriau et al from inorganic materials
(ZnS) in 1936,
1
while organic materials from anthracence until 1963.
2
However, at the
beginning, organic materials didn’t catch people’s eyes due to the high operation voltage
and low efficiency. Until 1987, Tang and Van Slyke fabricated an organic light-emitting
diode (OLED) based on tris(8-hydroxyquinolinato)aluminum (Alq
3
), together with N,N’-
diphenyl-N, N’-bis(3-methylphenyl)-1,1’-biphenyl-4, 4’-diamine(TPD) to achieve very
bright green emission at a low driving voltage of 10V. The brightness was higher than
1000 cd/m
2
and external quantum efficiency (EQE) reached around 1%.
3
Following this
success, in 1990, Friend et al. fabricated polymer LEDs by spin-coating a precursor
conjugated polymer poly (phenylenevinylene)(PPV) as emitter in a similar device
structure(Figure 1.1).
1,4-6
These great progresses attracted extensive studies to OLEDs
and contributed greatly to their rapid development. Owing to their thin-film, light-weight,
fast-response, wide-viewing-angle, high-contrast, full color and low-power attributes,
OLEDs showed their unlimited potential to be mainstream of flat-panel-display
technologies and they will be able to compete with the now-dominant liquid-crystal
displays (LCDs) in the future display market.
1
Part I Phosphorescent materials for OLEDs Chapter 1
NN
CH
3
CH
3
N
O
N
O
Al N
O
n
PPV
TPD
Alq
3
Figure 1.1. Molecular structures of Alq , TPD and PPV.
3
1.1 Mechanism and structure of organic light-emitting diodes (OLEDs)
Electroluminescence is obtained from light-emitting diodes (LEDs) when
incorporating the light-emitting layer between the anode and cathode. Single layer OLED
device includes anode, light-emitting layer and cathode, which is the basic and simplest
OLED structure. However, due to different mobility between holes and electrons, the
combining areas tend to close to one electrode, causing charge consumed on the electrode
surface and thus affecting the device efficiency. Improved device performance was
achieved when a more complicated multilayer device configuration was adopted (Figure
1.2).
7
Hole injection/transport layer (HTL) and electron injection/transport layer (ETL)
were inserted to balance the charge injection and transport and control the recombination.
In order to confine charges in active layer, hole-blocking layer (HBL) and electron-
blocking layer (EBL) were added to prevent holes and electrons leakage. Multilayer
structures permit improvement in charge injection, transport and recombination. When a
voltage is applied onto the device, holes are injected from the anode and electrons from
the cathode, then they migrate through the hole transport layer and electron transport
layer, respectively. Finally they recombine in the organic light-emitting layer to form
2
Part I Phosphorescent materials for OLEDs Chapter 1
excitons. The relaxation of the excitons from excited state to ground state will produce
light emission and the color of light depends on the energy difference between the excited
states and the ground states. In short, the fundamental physical process of the OLEDs can
be divided into four steps: charge injection, transport, recombination and radiative
exciton decay.
Cathode
Electron Transport Layer
Hole Block Layer
Organic Emitter Layer
Electron Block Layer
Hole Transport Layer
Anode (ITO)
Glass Substrate
Figure 1.2. Sandwich structure of OLEDs.
For OLEDs, indium-tin-oxide (ITO)-coated glass substrate is a universal choice for
their anode. Up to now, other non-ITO anodes are seldom used. ITO is composed of
indium oxide (In
2
O ) and a small amount of tin oxide (SnO
3 2
). Its high work function,
high transparency (90%) to visible light, wide band gap (E
g
=3.5 - 4.3 eV), conductive and
good adhesion ability with organic layer are the main considerations. Before using, ITO
must be cleaned ultrasonically in detergent solution and rinsed in deionized water in
sequence. After cleaning, further surface treatment, such as, using plasma or UV-ozone to
3
Part I Phosphorescent materials for OLEDs Chapter 1
enhance its work function further to 5 eV and facilitate its hole injection. The sequent
ITO treatment is very important, which will improve the efficiency and stability of
OLED.
8-10
However, the work function of treated ITO is still lower than the highest occupied
molecular orbital (HOMO) of most hole transport materials. For further improved device
performance, a hole-injection layer is inserted between ITO and hole transporting layer.
This layer will enhance hole injection at interface. Copper phthalocyanine (CuPc)
11,12
and
poly(3,4-ethylene dioxythiophene )–poly(styrene sulfonic acid) (PEDOT/PSS)
13,14
are
popular choices, especially the latter, PEDOT/PSS can smooth the surface of ITO,
decrease device turn-on voltage, reduce the probability of electrical short circuits. The
structures of PEDOT/PSS and CuPc are shown in Figure 1.3.
+
OO
S
n
SO
3
H
n
PEDOT/PSS
C
u
P
c
N
N
N
Cu
N
N
N
N
N
Figure 1.3. Structures of PEDOT/PSS and CuPc.
For the cathode, usually electropositive and low work function metals are used,
because they minimize the energy barrier for electron injection from cathode to the
organic materials and offer high current density.
15,16
The attempt to use Ca, K and Li for
4
Part I Phosphorescent materials for OLEDs Chapter 1
effective cathode materials revealed that they exhibit poor corrosion resistance and high
chemical reactivity with the organic layer. One solution is to use low-work function metal
alloys such as Mg-Ag and Al-Li, which have better stability. Currently, bilayer cathode,
such as LiF/Al was adopted and exhibited pronounced boost in device performances, thus
it has been widely used in OLEDs.
In OLEDs, electron and hole transport layers are used to guarantee balanced charges,
which will improve the device efficiency. Because most organic materials prefer to
transport only one kind of charges, i.e., electrons or holes, with the mobility ranging from
10
-8
to 10
-2
cm
2
/(V·s).
1
Hole-transporting materials account for the majority of organic
materials due to their intrinsic low electron affinity. Numerous hole-transporting
materials have been developed. Among them, triarylamine and carbazole derivatives are
prevalent, such as, N,N’-diphenyl-N,N’-bis(1-naphthyl)–(1,1’-biphenyl)-4,4’-diamine
(NPB),
17
4,4′-N,N′-dicarbazol-biphenyl (CBP),
18
and TPD
19
(Figure 1.4). To date, the
most widely used electron transport materials are some metal chelates (Alq
3
, Be and Zn
chelates).
20 20
PBD, 2,2’,2’’-(1,3,5-phenylene)tris(1-phenyl-1H-benzimidazole)
(TPBI),
18,21,22
3-(4-biphenyl)-4-phenyl-5-tert-butylphenyl-1,2,4-triazole (TAZ) (Figure
1.5),
23,24
and oxadiazole derivatives have also been widely used in preparing organic EL
devices as an electron transporting material.
25,26
NN
NN
NN
NPB
CBP
TPD
Figure 1.4. Hole-transporting materials for OLEDs.
5
Part I Phosphorescent materials for OLEDs Chapter 1
N
N
N
R
O
N
N
N
N
NN
N
N
TAZ
TPBI
PBD
Figure 1.5. Electron-transporting materials for OLEDs.
The energy diagram of single layer OLEDs and multilayer OLEDs are shown in
Figure 1.6.
27,28
It can be seen that the introduction of hole and electron injection layers
helps to effectively reduce the barrier for charge injection. Matched energy levels will
greatly enhance the device efficiency.
According to the mechanism and structure of OLEDs, the performance of an OLED
depends on two key factors: device configuration and light-emitting material. In this
project, we mainly focus on luminescent material research.
6