Experimental and theoretical studies on adsorbed natural gas storage system using activated carbons 2
Bạn đang xem bản rút gọn của tài liệu. Xem và tải ngay bản đầy đủ của tài liệu tại đây (944.66 KB, 13 trang )
Appendix A
185
Appendix A Determination of Regeneration
Temperature for the Activated Carbons
The regeneration temperature is applied to the adsorbent sample during the evacuation
process to desorb the pre-adsorbed adsorbate molecules. The temperature has to be
reasonably higher to provide enhancement in desorption process, although the
maximum possible regeneration temperature depends on the adsorbent material
properties particularly the burn off temperature. Generally the carbon materials burn
out at temperatures from (650 to 750) °C in presence of air. However, the regeneration
temperature for the activated carbons is observed to be much lower because of their
porous surface structure.
In this study, the regeneration temperature is determined experimentally for the
activated carbon (AC) samples used in the experiments. The Computrac Max 5000
Moisture Analyzer is used for this purpose where the AC sample pre-adsorbed with
methane is heated up at different higher temperatures.
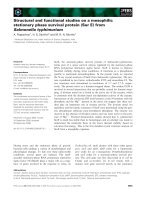
Figure A.1 Computrac Max 5000 Moisture Analyzer
Sample
Holder
Ceramic
Oven
Dis
p
la
y
RTD mounted
near the Heater to
measure Oven
Temperature
Appendix A
186
This moisture analyzer operates for the temperature range of (25 to 600) °C and
it takes only (2 to 3) minutes to reach the set temperature. The operating range is (0.2
to 600) g with an accuracy of 0.1 mg in mass measurement. Figure A.1 shows the
pictorial view of the moisture analyzer indicating the ceramic oven, sample holder,
RTD for temperature measurement, and the display.
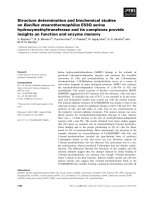
The AC samples pre-adsorbed with methane are heated up at different
temperatures ranging from (100 to 300) °C, and the adsorbate removal rates are
recorded as function of time. Figure A.2 provides typical plots for the percentage of
adsorbate removed and the removal rate at temperatures 160 °C and 200 °C,
respectively for the AC sample type Maxsorb III. In these plots, the “% Moisture” of
the vertical axis should be considered as “the percentage of adsorbate removal”. It can
be seen that the percentage of adsorbate removal from the AC sample becomes steady
after about 20 minutes of heating at temperature 160 °C whereas it is gradually
increasing in case of temperature 200 °C. These observations confirm that there is no
significant adsorbate removal in the extended period of heating at 160 °C. However,
the gradual increase of the percentage in case of heating at 200 °C is not exactly due to
the adsorbate removal rather it is because of burn out of the AC sample.
(a) 160 °C (b) 200 °C
Figure A.2 The percentage and the rate of adsorbate removal as function of
time
% of adsorbate removal
is gradually increasing
% of adsorbate
removal is constant
Appendix A
187
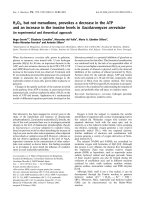
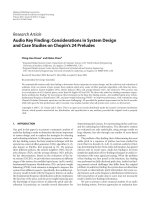
Figure A.3 shows the bar plot for the ratio of final mass and initial mass of the
Maxsorb III sample at different temperatures. It can be seen that the changes in mass
ratio are sharp below 120 °C and they are very close (indicated by red circle) for the
temperatures (140 to 180) °C. Again, the sharp changes in mass ratio (indicated by
blue circle) are observed for temperatures above 200 °C which indicates the possibility
of burn out of the AC sample at higher temperatures above 200 °C. Therefore, the
regeneration temperature is estimated at temperatures (140 to 160) °C for the AC
samples and this temperature range is also maintained in other studies (Himeno et al.,
2002; Saha et al., 2007; Akkimaradi et al., 2009; Wang et al., 2010) when activated
carbons are used as adsorbents.
0.9894
0.9877
0.9870
0.9867
0.9863
0.9858
0.9846
0.9840
0.9823
0.9800
0.978
0.980
0.982
0.984
0.986
0.988
0.990
0.992
100 120 140 160 180 200 220 240 260 280
Mass Ratio (m
final
/m
initial
)
Temperature ( °C)
Figure A.3 The ratios of final mass and initial mass of the Maxsorb III sample at
different higher temperatures
Appendix B
188
Appendix B Experimental Adsorption Uptake Data
Table B.1 Experimental uptake data for adsorption of methane onto Maxsorb III
Pressure
(MPa)
Uptake
(kg/kg)
Pressure
(MPa)
Uptake
(kg/kg)
Pressure
(MPa)
Uptake
(kg/kg)
Pressure
(MPa)
Uptake
(kg/kg)
Temperature = 5 ºC Temperature=15 ºC Temperature=25 ºC Temperature=35 ºC
0.050 0.015 0.050 0.012 0.057 0.011 0.060 0.010
0.127 0.033 0.135 0.029 0.140 0.025 0.152 0.022
0.217 0.050 0.233 0.045 0.234 0.038 0.245 0.034
0.310 0.066 0.331 0.059 0.331 0.050 0.344 0.045
0.411 0.080 0.429 0.071 0.428 0.061 0.443 0.055
0.510 0.093 0.526 0.082 0.526 0.071 0.543 0.064
0.646 0.109 0.655 0.096 0.652 0.083 0.678 0.076
0.784 0.123 0.800 0.109 0.792 0.095 0.820 0.087
0.934 0.136 0.946 0.121 0.948 0.108 0.974 0.098
1.138 0.152 1.155 0.137 1.157 0.122 1.175 0.111
1.340 0.167 1.354 0.150 1.344 0.134 1.373 0.122
1.550 0.180 1.561 0.163 1.563 0.147 1.571 0.133
1.754 0.191 1.762 0.174 1.756 0.157 1.771 0.143
1.949 0.201 1.968 0.184 1.960 0.167 1.975 0.153
2.158 0.211 2.166 0.193 2.157 0.176 2.178 0.161
Temperature =45 ºC Temperature=55 ºC Temperature=65 ºC Temperature=75 ºC
0.061 0.008 0.065 0.008 0.067 0.007 0.071 0.006
0.148 0.019 0.160 0.017 0.157 0.015 0.162 0.013
0.248 0.029 0.255 0.026 0.254 0.023 0.263 0.020
0.348 0.039 0.354 0.035 0.350 0.030 0.362 0.027
0.445 0.048 0.458 0.043 0.456 0.038 0.464 0.034
0.540 0.056 0.555 0.050 0.555 0.045 0.561 0.040
0.665 0.065 0.680 0.059 0.681 0.053 0.686 0.047
0.815 0.076 0.823 0.069 0.826 0.061 0.835 0.055
0.966 0.086 0.974 0.078 0.978 0.070 0.987 0.063
1.170 0.099 1.204 0.091 1.188 0.081 1.198 0.073
1.368 0.110 1.389 0.100 1.393 0.091 1.401 0.083
1.585 0.121 1.593 0.110 1.589 0.100 1.603 0.091
1.777 0.130 1.799 0.120 1.795 0.108 1.806 0.099
1.975 0.139 1.984 0.127 1.990 0.116 2.015 0.107
2.203 0.136 2.187 0.124 2.198 0.114
Appendix B
189
Table B.2 Experimental uptake data for adsorption of methane onto ACF (A-
20)
Pressure
(MPa)
Uptake
(kg/kg)
Pressure
(MPa)
Uptake
(kg/kg)
Pressure
(MPa)
Uptake
(kg/kg)
Pressure
(MPa)
Uptake
(kg/kg)
Temperature = 5 ºC Temperature=15 ºC Temperature=25 ºC Temperature=35 ºC
0.057 0.012 0.056 0.010 0.059 0.008 0.059 0.007
0.128 0.022 0.143 0.022 0.144 0.018 0.146 0.015
0.218 0.034 0.242 0.032 0.252 0.028 0.247 0.023
0.332 0.045 0.343 0.041 0.350 0.036 0.352 0.031
0.437 0.055 0.443 0.049 0.451 0.043 0.445 0.037
0.549 0.063 0.550 0.057 0.550 0.050 0.545 0.043
0.672 0.072 0.699 0.066 0.688 0.058 0.694 0.051
0.855 0.082 0.838 0.074 0.838 0.066 0.846 0.058
0.981 0.089 0.997 0.082 0.999 0.073 0.998 0.065
1.162 0.097 1.205 0.091 1.199 0.081 1.204 0.073
1.358 0.105 1.401 0.099 1.401 0.089 1.404 0.080
1.572 0.113 1.601 0.106 1.605 0.095 1.599 0.086
1.780 0.120 1.799 0.112 1.805 0.101 1.820 0.092
1.981 0.126 2.008 0.118 2.000 0.107 2.034 0.098
2.202 0.132 2.207 0.123 2.206 0.112 2.201 0.102
2.412 0.137 2.406 0.128 2.402 0.117 2.433 0.108
Temperature=45 ºC Temperature=55 ºC Temperature=65 ºC Temperature=75 ºC
0.062 0.006 0.051 0.004 0.067 0.004 0.059 0.003
0.157 0.014 0.157 0.012 0.147 0.009 0.151 0.008
0.261 0.021 0.254 0.018 0.249 0.015 0.249 0.013
0.354 0.027 0.360 0.024 0.358 0.020 0.346 0.017
0.452 0.032 0.453 0.029 0.457 0.025 0.445 0.021
0.561 0.038 0.562 0.034 0.551 0.029 0.544 0.025
0.694 0.044 0.711 0.041 0.702 0.035 0.723 0.032
0.845 0.051 0.854 0.047 0.861 0.041 0.850 0.037
1.001 0.057 1.005 0.053 1.009 0.047 1.027 0.042
1.206 0.065 1.200 0.059 1.203 0.053 1.198 0.048
1.414 0.072 1.407 0.066 1.403 0.059 1.403 0.053
1.602 0.078 1.609 0.072 1.599 0.064 1.603 0.058
1.804 0.083 1.803 0.077 1.833 0.070 1.825 0.064
2.038 0.090 1.995 0.082 2.005 0.074 2.001 0.068
2.230 0.094 2.198 0.087 2.236 0.080 2.199 0.072
2.394 0.098 2.416 0.091 2.403 0.083 2.402 0.075
Appendix B
190
Table B.3 Experimental uptake data for adsorption of methane onto
Chemviron
Pressure
(MPa)
Uptake
(kg/kg)
Pressure
(MPa)
Uptake
(kg/kg)
Pressure
(MPa)
Uptake
(kg/kg)
Pressure
(MPa)
Uptake
(kg/kg)
Temperature = 5 ºC Temperature=15 ºC Temperature=25 ºC Temperature=35 ºC
0.048 0.017 0.059 0.016 0.052 0.012 0.066 0.011
0.146 0.033 0.148 0.028 0.152 0.024 0.169 0.022
0.268 0.045 0.262 0.039 0.272 0.035 0.290 0.031
0.390 0.054 0.382 0.048 0.391 0.042 0.394 0.037
0.516 0.061 0.494 0.054 0.530 0.049 0.514 0.043
0.672 0.068 0.641 0.060 0.691 0.056 0.680 0.050
0.826 0.073 0.800 0.066 0.851 0.061 0.859 0.055
0.987 0.078 0.953 0.070 0.996 0.065 0.977 0.059
1.184 0.083 1.189 0.076 1.180 0.069 1.182 0.063
1.386 0.087 1.405 0.080 1.393 0.073 1.356 0.068
1.607 0.089 1.678 0.084 1.572 0.077 1.600 0.072
1.795 0.092 1.886 0.087 1.780 0.079 1.831 0.074
2.035 0.094 2.103 0.089 1.976 0.082 2.052 0.078
2.269 0.094 2.333 0.091 2.164 0.084 2.272 0.081
2.535 0.095 2.552 0.092 2.361 0.085 2.548 0.084
Temperature =45 ºC Temperature=55 ºC Temperature=65 ºC Temperature=75 ºC
0.060 0.009 0.069 0.008 0.064 0.006 0.072 0.006
0.157 0.018 0.178 0.017 0.177 0.015 0.180 0.013
0.292 0.028 0.264 0.022 0.288 0.021 0.285 0.018
0.413 0.034 0.394 0.029 0.388 0.025 0.385 0.022
0.527 0.039 0.503 0.033 0.508 0.030 0.504 0.027
0.684 0.045 0.664 0.042 0.668 0.035 0.632 0.031
0.875 0.051 0.836 0.047 0.814 0.039 0.775 0.037
1.066 0.056 0.998 0.051 0.998 0.043 0.950 0.041
1.276 0.060 1.230 0.055 1.227 0.049 1.193 0.046
1.462 0.063 1.438 0.058 1.565 0.055 1.410 0.050
1.705 0.067 1.688 0.063 1.857 0.060 1.647 0.053
1.925 0.071 1.906 0.066 2.136 0.063 1.882 0.057
2.141 0.073 2.127 0.068 2.399 0.066 2.132 0.060
2.374 0.075 2.343 0.071 2.614 0.068 2.356 0.062
2.609 0.077 2.575 0.073 2.624 0.065
Appendix C
191
Appendix C Drawings and Dimensions of the Cryostat
The detail drawings and dimensions of the cryostat, which was built to maintain constant low temperature of the adsorption cell, are given below.
Figure C.1 Cryostat for the Adsorption Cell (Top View)
Flange:ISONW16KF
Liq.N
2
outletline
Liq.N
2
inletline
130φ
All dimensions are in mm
Appendix C
192
Figure C.2 Cryostat for the Adsorption Cell (Front Sectional View)
Appendix D
193
Appendix D Drawings and Dimensions of the Storage
Cylinder and AC Bed Heat Exchanger
Description
Shell : Pipe DN300 SCH40S 1000mmL
Top/Bottom Cover ASME DN300 CL300# .RF
Top/Bottom Flange ASME DN300 CL300# S0.RF
Paper based Rings Gasket
Stud Bolts and 2 Nuts 1-1/8" 8 UNC 200mmL
Water Inlet/Outlet Tube DN25 SCH40S
Feed Through 3000# DN15 NPT
Gas Inlet/Outlet Tube DN8 SCH80S
Tube DN10 SCH80S
Material
SS 316L
SS 316L
SS 316L
Asbestos
SS 316L
SS 316L
SS 316L
SS 316L
SS 316L
Qty
1
2
2
2
32
4
3
1
3
Item
1
2
3
4
5
6
7
8
9
All dimensions are in mm
Design Pressure 40 bar.g
Design Temperature 90 °C
Figure D.1 Drawings and dimensions of the Storage Cylinder
Appendix D
194
Description
Fins (112 mmx112mm) x 0.1mmT
Tube OD10mm x 1.0mm T x 810mmL
Top Header (173mm x 157mm x 48mm) 5mmT
Bottom Header (173mmx157mmx48mm) 5mmT
Divider at Top Header (147mm x 43mm) 5mmT
Header Flange and HX End Plate Connected
with bolts and nuts
Water In/Out Tube (OD26mm x 2mmT)
Material
Cu/Ni
Cu/Ni
SS 316L
SS 316L
SS 316L
SS 316L
SS 316L
Qty
94
20
1
1
1
2
4
Item
1
2
3
4
5
6
7
All dimensions are in mm
Design Pressure 40 bar.g
Design Temperature 90 °C
y
z
x
Figure D.2 Drawings and dimensions of the AC Bed Heat Exchanger
Appendix E
195
Appendix E Details of Leak Test of the Storage
Cylinder and AC Bed Heat Exchanger
The below is the Pressure Test Certificate provided by the manufacturer for the
Storage Cylinder and the AC Bed Heat Exchanger
Appendix E
196
The storage cylinder was tested in our laboratory for pressure keeping the heat
exchanger inside the cylinder before activated carbon was packed. After the end covers
bolted with the flanges, the cylinder was filled with water and pressurized up to 40 bar
using the hydraulic pump. A slight pressure drop was observed after long hours which
could be due to the room temperature fluctuations and also because of the sieving
effect of water through the asbestos gaskets. Figure E.1 shows the pressure test
arrangement for the storage cylinder.
Figure E.1 Pressure test arrangement for the Storage Cylinder
Figure E.2 Pressure test arrangement for the AC Bed Heat Exchanger
Appendix E
197
Similarly, the AC bed heat exchanger was also tested for pressure in the
laboratory after the activated carbon was packed. The heat exchanger was internally
pressurized up to 6 bar using the hydraulic pump and no pressure drop was observed
for more than 12 hours. Figure E.2 shows the pressure test arrangement for the AC bed
heat exchanger.
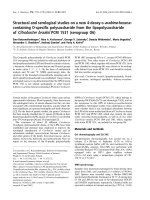
To determine the leak rate, the storage cylinder assembly was pressurized with
pure helium gas with the AC bed heat exchanger inside the cylinder. The pressure
readings were recorded with time and the pressure versus time plot is shown in Figure
E.3 which shows a slight pressure drop of about 0.1 bar in 16 hours. Since the charge
and discharge processes are continued only for three hours, this leaking rate is
considered negligible. However, it is taken into consideration in the simulation of the
cyclic processes for the ANG storage system.
Figure E.3 Leak test report of the Storage Cylinder charged with pure helium