Characteristics of flow in the wake region of a bluff vertical cylinder in the presence of waves,currents and combined wave current flows 1
Bạn đang xem bản rút gọn của tài liệu. Xem và tải ngay bản đầy đủ của tài liệu tại đây (14.33 MB, 195 trang )
CHARACTERISTICS OF FLOW IN THE WAKE REGION OF A BLUFF
VERTICAL CYLINDER IN THE PRESENCE OF WAVES, CURRENTS
AND COMBINED WAVE-CURRENT FLOWS
JIMMY NG KEONG TARK
M. Eng., National University of Singapore
B. Eng. (Hons), National University of Singapore
A THESIS SUBMITTED
FOR THE DEGREE OF DOCTOR OF PHILOSOPHY
DEPARTMENT OF CIVIL AND ENVIRONMENTAL ENGINEERING
NATIONAL UNIVERSITY OF SINGAPORE
2012
i
Dedicated to my Late Father
ii
Acknowledgements
This dissertation would not be possible without the very kind help of several people.
I like to express my heartfelt gratitude and thanks to my PhD supervisors, Prof Chan Eng Soon and
Dr. John E. Halkyard for their confidence, patience and faith in me during the course of this study.
Special thanks are extended to Professor Chan Eng Soon for his very kind support that had enabled
me to carry out research on a full time basis. I am especially appreciative of Dr. John E. Halkyard for
his vast insight and knowledge in offshore structures and hydrodynamics, his patient guidance and
encouragement, and mentoring that had in so many ways, made me a better and stronger person.
Much of the experimental work had been kindly assisted by the outstanding personnel of the
Hydraulics Laboratory. I give thanks to Sit Beng Chiat, Krishna Sanmugam, Shaja Khan, Semawi Sadi
and Roger Koh for their synergy, dedication and untiring help, and being great colleagues and
friends. The set up of the parallel cluster and STAR CCM+ CFD system is credited to the excellent
knowhow of Adrian Tan Seck Wei, who is a whiz in these systems. I am extremely grateful to my
‘Bro’ Kanaram Roopsekhar of TMSI, who had rendered great help and advice in both experiments
and CFD simulations.
I am very grateful for the technical and research advice given by Dr. Allan Magee of Technip Inc. who
had spent many hours with me to fine tune my research study, despite his busy schedule, as well as
the modelling help rendered by Ms. Jaime Tan of Technip KL. Invaluable lessons were learnt from
Dr. Mike Khoo of TSI, who is an excellent instructor and specialist in PIV systems. Your time has been
much appreciated.
I like to extend my gratitude to a buddy and old classmate Professor Ng How Yong, who is always
there with a listening ear and great advice when the going got tough.
My family had been my pillar of strength during the five years of this PhD study, and this is credited
to the unwavering faith and support of my wife and mother. Thank you, Lih Jiuan and Irene, for
being there all the time, and believing in me.
iii
Summary
This study is concerned with the flow in the wake of a bluff vertical cylinder, in combined wave and
current flows. Past model tests in the industry had revealed the existence of a beat phenomenon in
the relative motion responses of two tandem offshore structures in collinear waves and currents.
The beat phenomenon gave rise to high responses that posed potential risks to mooring and
tethering systems. The present work explores the beat phenomenon further, for flow parameters of
U
c
/ U
w
of 0.8 to 2.8, and wave KC numbers of 0.25 to 0.50. Flow kinematics in the wake flow is
mapped out for the range of flows, where the beat phenomenon is identified.
The experiments are performed using a specially built tow carriage system to simulate currents in
the 39m long wave flume, by towing the models and instrumentation. Noise and sound insulation,
as well as intelligent electronic controls are incorporated in the design and implementation of the
tow carriage so that steady uniform currents are simulated.
Kinematics mapping over the cylinder wake region revealed selected locations in the wake where
beat phenomenon is obvious. Forces acting on a downstream cylinder placed at these identified
locations are measured using a purpose built instrumented downstream cylinder, where a 50 mm
section of the cylinder measured hydrodynamic forces. Results of measured forces showed that
amplitude modulation in the transverse force signatures is very pronounced at x/D = 1 ½, y/D = 0.6
offset, and the inline and transverse force amplitudes can be much larger than wave only flows. The
physics of the wake characteristics in the beat phenomenon is captured through the PIV flow
visualization method, which offers quantitative measure of the flows.
Experimental flow visualization methods had a limited time capture window, and this work is
extended numerically using a computational fluid dynamics software package STAR CCM+. The
complexity and turbulence in the cylinder wake require a Detached Eddy Simulation (DES) solver,
together with Volume of Fluid (VOF) method for surface waves. CFD simulations are performed for
iv
a single upstream cylinder, as well as tandem cylinders for the downstream cylinder locations x = 1 ½
D, y = 0 and 0.6 D, for current only flow, wave only flow, as well as combined wave current flows.
CFD results showed similar beating characteristics in the kinematics, forces and wave elevation time
signatures in combined flows. As CFD permits a full record for the flow characteristics from
initialization of simulation to steady beating, analyses of the wake flow field, together with vorticity
plots and isosurface plots conclude that the beat phenomenon arise from a time dependent wave-
current-structure interaction, that causes asymmetrical flow patterns in the upstream cylinder wake,
that results in periodic differentials in the wake flow that correspond with the beat frequency. Both
experiments and CFD simulations show that beating evolved as a gradual process that lead to steady
beat modulation.
Similar flow characteristics and beat parameters are obtained from both experiments and CFD
simulations, attesting to the suitability of CFD simulation as a numerical tool to predict the beat
phenomenon obtained in combined wave current flows around bluff cylinders in low U
c
/U
w
and KC
flows.
A dynamic one degree of motion model is developed in this study, where kinematics measured in
the upstream cylinder wake is used to estimate the surge and sway motion responses of a flexibly
suspended downstream cylinder. This model demonstrated that the downstream cylinder response
is greatly enhanced in combined wave current flows, as compared to wave only conditions. This
model is extended to use measured forces on the downstream cylinder to predict its motion
responses. Again, the amplified effects contributed by combined wave current flows are
demonstrated.
This study establishes the existence of a beat phenomenon occurrence around a bluff cylinder body
in the presence of wave and currents, at selected U
c
/ U
w
ratios and low KC flows. It is hoped that
the findings from this study will encourage further interest in research of combined wave current
flows in the said flow parameters, which are commonly encountered in the offshore environment.
v
Table of Contents
Acknowledgements
Summary
Table of Contents
List of Figures
List of Tables
List of Symbols
List of Abbreviations
Page
ii
iii
v
x
xix
xxi
xxiii
Chapter 1. Introduction
1.1 Background
1.2 Review of Past Research
1.2.1 Cylinders in Uniform Flow
1.2.2 The Phenomenon of lock-In for Flows Past Cylinders
1.2.3 Cylinder in Waves
1.2.4 Combined Waves and Currents on a Cylinder
1.2.5 Tandem Cylinders in Current Flows
1.2.6 Kinematics Characteristics in Cylinder Near Wake
1.2.7 Kelvin Waves Estimation in Bluff Cylinder Wake
1.2.8 Flow Parameters in Present Study
1
1
5
6
7
10
14
17
19
22
23
Chapter 2 Objectives of the Present Study
2.1 Questions leading to the objectives of this study
2.2 Objectives of this study
25
25
26
vi
Chapter 3. Experiments - Design, Construction and Implementation
3.1 Similitude, Scaling and Flow Regimes
3.1.1 Currents
3.1.2 Waves
3.2 Dimensions, Ranges and Undisturbed Flow Characteristics
3.3 Wave generation
3.4 Tow Carriage Design
3.4.1 Ladder Chassis
3.4.2 Drive Train
3.4.3 Cable Train and Cabling
3.4.4 Model and Instrumentation frame
3.4.5 Structural Response of Tow Carriage
3.4.6 Ramp Up acceleration rates
3.4.7 Controls and Safety
3.5 Kinematics Measurement
3.6 Wave Elevation Measurements
3.7 Force Measurements
3.8 Flow Visualization
3.8.1 PIV Technique
3.8.2 PIV system overview
3.8.3 PIV Measurements in the Flume
3.8.4 Seedling material
3.8.5 Timing Setup
3.8.6 Processing of PIV Raw Images
28
28
29
31
32
33
36
38
38
40
41
42
43
43
44
45
46
51
51
52
54
58
58
59
Chapter 4. Experimental Study of Flow Field in the Wake of a Bluff Cylinder
4.1 Kinematics in the Wake of a Bluff Cylinder
61
61
vii
4.1.1 Wake Characteristics in Current Flows
4.1.2 Wake Characteristics in Wave Flows
4.1.3 Wake Characteristics in Combined Wave and Current Flows
4.2 Wave Surface Elevations Alongside Bluff Cylinder
4.3 Forces Acting on a Slender Cylinder in the Wake of a Bluff Cylinder
4.3.1 Force Characteristics on a Downstream Slender Cylinder in Current Flows
4.3.2 Force Characteristics on a Downstream Slender Cylinder in Wave Only
Flows
4.3.3 Force Characteristics on a Downstream Slender Cylinder in Combined
Wave Current Flows
4.4 Flow Vector Visualization using PIV
4.4.1 Test Matrix
4.4.2 Visualization frame of reference
4.4.3 Flow Vector Characteristics in the Bluff Cylinder Wake
4.4.3.1 Typical Flow Vector Visualization Plot
4.4.3.2 Single Bluff Cylinder Wake Flow Characteristics, T = 0.7s
4.4.3.3 Bluff Cylinder Wake Characteristics with Slender Cylinder at x = 1 ½
D, y = 0. T = 0.7s
4.4.3.4 Bluff Cylinder Wake Characteristics with Slender Cylinder at x = 1 ½
D, y = 0. T = 0.7s
63
65
66
69
71
72
72
73
84
84
84
85
85
86
87
88
Chapter 5. Computation Fluid Dynamics Modelling
5.1 Model and Meshing
5.2 Turbulence Modelling in STAR CCM+
5.3 Free Surface Modelling
5.4 Boundary Conditions
5.5 Initial Conditions
5.6 Wave Absorption and Reflection in the Numerical Wave Tank
97
98
99
100
101
102
103
viii
5.7 Mesh Convergence and Time Step Sensitivity Tests
5.8 Test Matrix and Data Monitoring on CFD Runs
104
107
Chapter 6. Results of Numerical Modelling
6.1 Wave Elevations at Locations in the Wave Tank
6.2 Flow Field in the Wake of the Bluff Cylinder
6.3 Forces on the Downstream Cylinder
6.4 Vector and Vorticity Plots
6.5 Iso – Surface Plots
6.5.1 Evolution of Iso – surface Patterns for T = 0.7s, C = 50 mm/s Flows
6.5.2 Periodicity of Distorted Iso – surface Patterns
6.6 Comparison of Results Obtained in Experiments and CFD Simulations
6.6.1 Kinematics in the Wake of the Bluff Upstream Cylinder
6.6.2 Forces on Downstream Cylinder in the Wake of a Bluff Cylinder
6.6.3 Flow Vector Visualization around Downstream Cylinder in PIV and CFD.
6.7 Wake Flow Characteristics in Beat Phenomenon
6.7.1 Features of Flow around Slender Downstream cylinder at x = 1 ½ D, y = 0
6.7.2 Features of Flow around Slender Downstream cylinder at x = 1½ D, y= 0.6D
110
110
117
129
136
146
146
146
153
153
159
163
167
167
170
Chapter 7. Discussion on Beat Phenomenon in a Bluff Cylinder Wake
7.1 Origins of the Beat Phenomenon
7.2 Beat Periods in Combined Wave Current Flows
7.3 Drag Coefficients in the Bluff Cylinder Wake
7.4 Velocity Spectrum in Measured Flow Velocities at x = 1 ½ D Downstream
7.5 Effects of Beat Phenomenon on Simulated Motions of Downstream Cylinder
7.5.1 One Degree of Freedom Model
172
172
183
186
187
190
190
ix
7.5.2 Surge Responses of Downstream Cylinder
7.6 Vorticity patterns in Upstream Cylinder Wake, with Downstream Cylinder at x =
1 ½ D, y = 0
192
195
Chapter 8. Conclusions and Recommendations
8.1 Conclusions of this study
8.2 Recommendations for future work
197
197
199
References
201
Appendices
Appendix A Time Series of Experimental Kinematics
208
Appendix B Time Series of Experimental Forces on Downstream Cylinder
280
Appendix C Flow Visualization from PIV Experiments (Fixed PIV Frame of Reference)
299
Appendix D Time Series of CFD Calculated Wake Velocities
318
Appendix E Time Series of CFD Calculated Forces on Downstream Cylinder
335
Appendix F Time Series of CFD Calculated Wave Elevations
344
Appendix G CFD Calculated Velocity Vector and Vorticity Plots
357
Appendix H Iso Surface Plots of Numerical Wave Tank 374
Appendix I Deviation of Similarity Scale factors using Dimensional Analysis
399
x
List of Figures
Figure 1. Photograph of a semi-submersible drill ship working alongside the Neptune SPAR
platform.
Figure 2. A drawing of a typical TAD semi-submersible (left) and SPAR platform (right) moored
next to each other.
Figure 3. Spectra density plot of SPAR and TAD responses in collinear waves and currents (in
red) and waves only (in blue), from Haslum (2006).
Figure 4. Plot of the relative motions between the SPAR and TAD models when subjected to
collinear wave and current flow (blue) and opposite wave and current flow (red),
Haslum (2006).
Figure 5. Schematic showing the SPAR and TAD configuration and the direction of current and
wave flows when subjected to collinear wave and current flow (blue) and opposing
wave and current flow (red), Haslum (2006).
Figure 6. Schematics of flow past a cylinder at different Reynolds flow regimes. Sumer &
Fredsoe (2006).
Figure 7. Graph of f / f
n
vs. Vr illustrating the lock-in region where the vortex shedding
frequency is synchronized to the frequency of cylinder oscillation. Feng (1968).
Figure 8. Schematics showing plot of amplitude-diameter ratio (A/D) versus reduced velocity
(V
r
) of a Truss SPAR system where high A/D response extend beyond V
r
> 10. Irani &
Finn (2004).
Figure 9. Flow characteristics around a smooth cylinder in oscillatory flows. Sarpkaya (1986),
Williamson (1985).
Figure 10. Plot of KC numbers versus Reynolds numbers, illustrating regimes of flow around a
cylinder in oscillatory flows, Sarpkaya (1986).
Figure 11. Graph of Stokes number versus Keulegan-Carpenter Number (Sarpkaya 2006), and
the domain where the present study encompass.
Figure 12. Schematic of streaming around a cylinder in oscillatory unseparated flows.
Figure 13. Force time series of a cylinder in a coexisting current-wave flow. Sumer et al. (1992).
Figure 14. Variation of inline force coefficients C
D
and C
M
vs. U
c
/U
w
, at different KC numbers.
Plots extracted from Sumer (1992), Sarpkaya and Storm (1985). Dashed lines are
asymptotic values for steady current case.
Figure 15. Different instabilities observed at various cylinder separations. Bokaian et. al. (1984).
xi
Figure 16. Discontinuous changes in pressure coefficients at critical cylinder spacing of 3.5D.
Zdravkovich and Pridden (1977).
Figure 17. Comparison of currents only and combined waves and currents flow lift force
time histories at KC = 0.5, U
w
/ U
c
= 1.0, Re =100. Zhou et. al. (2000).
Figure 18. Vortex patterns in the wake of a cylinder in combined wave current flows at (a) KC =
3, U
c
/ U
w
= 1, (b) KC = 4, U
w
/ U
c
= 1. Zhou (2000).
Figure 19. Illustration of Kelvin waves from a moving point source from Soomere (2007).
Figure 20. Plot of Drag coefficient CD vs. Reynolds Number. Massey B. S. (2002).
Figure 21. Plot of Strouhal numbers vs. Reynolds numbers. Williamson (1989), Schewe (1983).
Figure 22. Wave elevation signatures of calibrated (a) 0.7 s, (b) 0.85 s, (c) 1.0 s, (d) 2.0 s and (e)
3.6 s waves.
Figure 23. Schematic of the isolated chassis and frame design of the tow carriage.
Figure 24. Photograph of one of the four ROSTA elastomeric dampeners installed on the
carriage.
Figure 25. Photograph showing details of the carriage drive system.
Figure 26. Photograph showing details of the cable train system.
Figure 27. Photograph of tow carriage with model and instrumentation.
Figure 28. Photograph of dead weights on instrumentation frame.
Figure 29. Velocimeter readings, for a carriage starting from rest, at ramp-up rates of (a) 150
mm/s
2
, and (b) 5 mm/s
2
.
Figure 30. Photograph of (a) User control panel, (b) Wireless remote control.
Figure 31. Schematics of the NORTEK Vectrino + Velocimeter used in this study.
Figure 32. Photograph of the KENEK CHT-4 capacitance wave height meter.
Figure 33. The Kyowa 50N range LSM-B-SA 1 force transducer.
Figure 34. In-situ calibration charts of the Kyowa LSM-B-SA 1, in the (a) X and (b) Y direction.
Figure 35. Schematic of the dimensions of downstream cylinder for force measurements.
Figure 36. Schematics showing components of instrumented downstream cylinder.
Figure 37. Photos of the instrumented downstream cylinder; (a) As constructed, (b) Installed
on the carriage together with the upstream cylinder.
Figure 38. Raw signals from force transducer in the (a) X and (b) Y direction when tapped twice
in quick succession with a mallet.
xii
Figure 39. Basic PIV measurement technique.
Figure 40. Schematics of PIV Laser Set – Up.
Figure 41. Schematic of the PIV set up in this study.
Figure 42. Photograph showing laser light sheet and mirror reflected sheet.
Figure 43. PIV raw images under different set up conditions.
Figure 44. Locations in wake where kinematics are measured.
Figure 45. X and Y velocity plots at the point x = 1 ½ D, y = 0 for currents only runs.
Figure 46. Velocity and spectra plots in the X, Y and Z directions, at x = 1 ½ D, y = 0.6 D, for
wave only flow, T = 0.7 s.
Figure 47. Velocity and spectra plots in the X, Y and Z directions, at x = 1 ½ D, y = 0.6 D, for
combined wave current flow, C = 125 mm/s, T = 0.7 s (T
e
= 0.688s).
Figure 48. Velocity and spectra plots in the X, Y and Z directions, at x = 1 ½ D, y = 0, for
combined wave current flow, C = 50 mm/s, T = 0.7 s (T
e
= 0.695s).
Figure 49. Velocity and spectra plots in the X, Y and Z directions, at x = 1 ½ D, y = 0.6 D, for
combined wave current flow, C = 50 mm/s, T = 0.7 s (T
e
= 0.695 s).
Figure 50. Wave elevation signatures and spectra measured alongside the upstream cylinder
for T = 0.7s, (a) C = 100 mm/s, (b) C = 75 mm/s, (c) C = 50 mm/s, (d) Waves only.
Figure 51. Forces on downstream cylinder placed at x = 1 ½ D, y = 0, for currents only flow, at
(a) C= 150 mm/s, (b) C= 125 mm/s, (c) C= 100 mm/s, (d) C= 75 mm/s, and (e) C= 50
mm/s.
Figure 52. Forces on downstream cylinder placed at x = 1 ½ D, y = 0.6 D, for currents only flow,
at (a) C= 150 mm/s, (b) C= 125 mm/s, (c) C= 100 mm/s, (d) C= 75 mm/s, and (e) C=
50 mm/s.
Figure 53. Forces on downstream cylinder placed at x = 1 ½ D, y = 0, for wave only flow at (a) T
= 2.0 s, (b) T = 1.0 s, (c) T = 0.85 s, and (d) T = 0.7 s.
Figure 54. Forces on downstream cylinder placed at x = 1 ½ D, y = 0.6 D, for wave only flow at
(a) T = 2.0 s, (b) T = 1.0 s, (c) T = 0.85 s, and (d) T = 0.7 s.
Figure 55. Forces on downstream cylinder placed at x = 1 ½ D, y = 0, for T = 0.7 s, and (a) C= 150
mm/s, (b) C= 125 mm/s, (c) C= 100 mm/s, (d) C= 75 mm/s, and (e) C= 50 mm/s.
Figure 56. Forces on downstream cylinder placed at x = 1 ½ D, y = 0.6 D, for T = 0.7 s, and (a) C=
150 mm/s, (b) C= 125 mm/s, (c) C= 100 mm/s, (d) C= 75 mm/s, and (e) C= 50 mm/s.
xiii
Figure 57. Forces on downstream cylinder placed at x = 1 ½ D, y = 0, for T = 0.85 s, and (a) C=
150 mm/s, (b) C= 125 mm/s, (c) C= 100 mm/s, (d) C= 75 mm/s, and (e) C= 50 mm/s.
Figure 58. Forces on downstream cylinder placed at x = 1 ½ D, y = 0.6 D, for T = 0.85 s, and (a)
C= 150 mm/s, (b) C= 125 mm/s, (c) C= 100 mm/s, (d) C= 75 mm/s, and (e) C= 50
mm/s.
Figure 59. Beat periods of force signatures at various current and wave combinations for (a) X
forces, at x = 1 ½ D, y = 0, (b) Y forces, at x = 1 ½ D, y = 0, (c) X forces, at x = 1 ½ D, y
= 0.6 D, and (d) Y forces, at x = 1 ½ D, y = 0.6 D.
Figure 60. Typical velocity flood image in this PIV study(C = 75 mm/s, T = 0.7 s).
Figure 61. PIV images of a single bluff cylinder in wave only flow T = 0.7 s, in time increments
of T / 10.
Figure 62. PIV images of a single bluff cylinder in combined wave current flow T = 0.7 s, C = 50
mm/s, in time increments of T / 10.
Figure 63. PIV images of bluff upstream cylinder, and downstream cylinder at x = 1 ½ D, y = 0,
in wave only flow T = 0.7s, in time increments of T / 10.
Figure 64. PIV images of bluff upstream cylinder, and downstream cylinder at x = 1 ½ D, y = 0 in
currents only flow C = 50 mm/s, in time increments of T / 10.
Figure 65. PIV images of bluff upstream cylinder, and downstream cylinder at x = 1 ½ D, y = 0 in
combined wave current flow, T = 0.7 s, C = 50 mm/s, in time increments of T / 10.
Figure 66. PIV images of bluff upstream cylinder, and downstream cylinder at x = 1 ½ D, y = 0.6
D in wave only flow T = 0.7s, in time increments of T / 10.
Figure 67. PIV images of bluff upstream cylinder, and downstream cylinder at x = 1 ½ D, y = 0.6
D in currents only flow C = 50 mm/s, in time increments of T /10.
Figure 68. PIV images of bluff upstream cylinder, and downstream cylinder at x = 1 ½ D, y = 0.6
D in combined wave current flow, T =0.7 s, C = 50 mm/s, in time increments of T/ 10.
Figure 69: Mesh refinement in fluid region at: (a). wave elevation, (b) area around cylinders, (c)
wave height monitor region.
Figure 70: Plan view of the wave tank showing location of cylinders and initial wave front.
Figure 71: Location of wave height monitoring on bare wave tank for mesh sensitivity tests.
Figure 72: Wave height signatures at: (a) cylinder location (x, y) = (0, 0), and (b) near end of
wave tank (x, y) = (9.24, 0) at final mesh size and trimmer mesh configuration.
Figure 73: Comparison of wave height signatures for calibrated wave T = 0.7s, H = 25 mm
between CFD (in blue) and experiments (in red).
Figure 74: Volume mesh in this study for two cylinder runs.
xiv
Figure 75: Locations in red in the wave tank where (a) local wave elevations and forces on the
downstream cylinder are measured in the two cylinder runs, (b) local wave
elevations and downstream kinematics are measured in the single cylinder runs, (c)
Wave elevations along the wave tank.
Figure 76. Locations where wave elevations were monitored in the CFD simulations.
Figure 77. Surface elevation time histories in the wave tank at (a) x=-0.84 m, (b) x=+0.84 m, (c)
x=+9.24 m for wave only flow, for downstream cylinder located at x = 1 ½ D, y = 0.
Figure 78. Surface elevation time histories in the wave tank at (a) x=-0.84 m, (b) x=+0.84 m, (c)
x=+9.24 m for combined wave current flow, C = 50 mm/s, T = 0.7s, for downstream
cylinder located at x = 1 ½ D, y = 0.
Figure 79. Surface elevation time histories in the wave tank at (a) x=-0.84 m, (b) x=+0.84 m, (c)
x=+9.24 m for wave only flow, for downstream cylinder located at x = 1 ½D, y = 0.6D.
Figure 80. Surface elevation time histories in the wave tank at (a) x=-0.84 m, (b) x=+0.84 m, (c)
x=+9.24 m for combined wave current flow, C = 50 mm/s, T = 0.7s, for downstream
cylinder located at x = 1 ½ D, y = 0.6 D.
Figure 81. Selected locations for study of flow kinematics.
Figure 82. X direction velocities measured at y = 0.6 D offset, at (a) x = 1 ½ D, (b) x = 2 D, and (c)
x = 2 ½ D for waves only flow, T = 0.7 s.
Figure 83. Y direction velocities measured at y = 0.6 D offset, at (a) x = 1 ½ D, (b) x = 2 D, and (c)
x = 2 ½ D for waves only flow, T = 0.7 s.
Figure 84. X direction velocities measured at y = 0.6 D offset, at (a) x = 1 ½ D, (b) x = 2 D, and (c)
x = 2 ½ D for combined wave current flow, T = 0.7 s, H = 25 mm, C = 50 mm/s.
Figure 85. Y direction velocities measured at y = 0.6 D offset, at (a) x = 1 ½ D, (b) x = 2 D, and (c)
x = 2 ½ D for combined wave current flow, T = 0.7 s, H = 25 mm, C = 50 mm/s.
Figure 86. Velocity vector plots around bluff upstream cylinder in increments of T / 7, for wave
only flow (T = 0.7 s), at simulation time t = 14T to 15T.
Figure 87. Velocity vector plots around bluff upstream cylinder in increments of T / 7, for wave
only flow (T = 0.7 s), at simulation time t = 57T to 58T.
Figure 88. Velocity vector plots around bluff upstream cylinder in increments of T
e
/ 7, for
combined wave current flow (T = 0.7 s, C = 50 mm/s), at time t = 14T to 15T.
Figure 89. Velocity vector plots around bluff upstream cylinder in increments of T
e
/ 7, for
combined wave current flow (T = 0.7 s, C = 50 mm/s), at time t = 57T to 58T.
Figure 90. Velocity vector plots around bluff upstream cylinder in increments of T
e
/ 7, for
combined wave current flow (T = 0.7 s, C = 75 mm/s), at time t = 14T to 15T.
xv
Figure 91. Velocity vector plots around bluff upstream cylinder in increments of T
e
/ 7, for
combined wave current flow (T = 0.7 s, C = 75 mm/s), at time t = 57T to 58T.
Figure 92. 50 mm Slice of downstream cylinder at 80 mm below still water level where forces
were monitored.
Figure 93. (a) X direction forces and (b) Y direction forces acting on a slice of downstream
cylinder placed at x = 1 ½ D, y = 0, for wave only flow. T = 0.7 s, H = 25 mm.
Figure 94. (a) X direction forces and (b) Y direction forces acting on a slice of downstream
cylinder placed at x = 1 ½ D, y = 0.6 D, for wave only flow. T = 0.7 s, H = 25 mm.
Figure 95. (a) X direction forces and (b) Y direction forces acting on a slice of downstream
cylinder placed at x = 1 ½ D, y = 0, for combined wave current flow. T = 0.7 s, H = 25
mm, C = 50 mm/s.
Figure 96. (a) X direction forces and (b) Y direction forces acting on a slice of downstream
cylinder placed at x = 1 ½ D, y = 0.6 D, for combined wave current flow. T = 0.7 s, H =
25 mm, C = 50 mm/s.
Figure 97. Velocity vector plots at every T increment at steady state. Wave only flow.
Downstream Cylinder located at x = 1 ½ D, y = 0.
Figure 98. Vorticity plots at every T increment at steady state. Wave only flow. Downstream
cylinder located at x = 1 ½ D, y = 0.
Figure 99. Velocity vector plots at every 2T
e
increment at steady state beating. C = 50 mm/s, T
= 0.7 s flow. Downstream cylinder located at x = 1 ½ D, y = 0.
Figure 100. Vorticity plots at every 2T
e
increment at steady state beating. C = 50 mm/s, T = 0.7 s
flow. Downstream cylinder located at x = 1 ½ D, y =0.
Figure 101. Velocity vector plots at every 2T
e
increment at steady state. Wave only flow.
Downstream cylinder located at x = 1 ½ D, y = 0.6 D.
Figure 102. Vorticity plots at every 2T
e
increment at steady state. Wave only flow. Downstream
cylinder located at x = 1 ½ D, y = 0.6 D.
Figure 103. Velocity vector plots at every 2T
e
increment at steady state beating. C = 50 mm/s, T
= 0.7 s flow. Downstream Cylinder located at x = 1 ½ D, y = 0.6 D.
Figure 104. Vorticity plots at every 2T
e
increment at steady state beating. C = 50 mm/s, T = 0.7 s
flow. Downstream cylinder located at x = 1 ½ D, y = 0.6 D.
Figure 105. Iso surface over first 12 T of run. Wave only flow, Downstream cylinder at x = 1 ½ D,
y = 0.6 D.
Figure 106. Iso surface plots over first 12 T of run. Combined wave current flow, Downstream
cylinder at x = 1 ½ D, y = 0.6 D.
xvi
Figure 107. Iso surface at intervals of T at steady state. Wave only flow, Downstream cylinder at
x = 1 ½ D, y = 0.6 D.
Figure 108. Iso surface at intervals of T
e
at steady state. Combined wave current flow, C=75
mm/s, Downstream cylinder at x = 1 ½ D, y = 0.6 D.
Figure 109. Comparison of experimental and CFD simulated Kinematics in the upstream cylinder
wake at (a) x = 1 ½ D, y = 0, (b) x = 1 ½ D, y = 0.6 D, for wave only flow, T = 0.7 s.
Figure 110. Comparison of experimental and CFD simulated Kinematics in the upstream cylinder
wake at (a) x = 1 ½ D, y = 0, (b) x = 1 ½ D, y = 0.6 D, for current only flow, C =
50mm/s.
Figure 111. Comparison of experimental and CFD simulated Kinematics in the upstream cylinder
wake at (a) x = 1 ½ D, y = 0, (b) x = 1 ½ D, y = 0.6 D, for combined wave current flow,
T = 0.7 s, C = 50mm/s.
Figure 112. Comparison of experimental and CFD simulated Kinematics in the upstream cylinder
wake at (a) x = 1 ½ D, y = 0, (b) x = 1 ½ D, y = 0.6 D, for combined wave current flow,
T = 0.7 s, C = 100mm/s.
Figure 113. Comparison of experimental and CFD simulated Forces on slender downstream
cylinder placed at (a) x = 1 ½ D, y = 0, (b) x = 1 ½ D, y = 0.6 D, for wave only flow, T =
0.7 s.
Figure 114. Comparison of experimental and CFD simulated Forces on slender downstream
cylinder placed at (a) x = 1 ½ D, y = 0, (b) x = 1 ½ D, y = 0.6 D, for combined wave
current flow, T = 0.7 s, C = 50 mm/s.
Figure 115. Comparison of experimental and CFD simulated Forces on slender downstream
cylinder placed at (a) x = 1 ½ D, y = 0, (b) x = 1 ½ D, y = 0.6 D, for combined wave
current flow, T = 0.7 s, C = 100 mm/s.
Figure 116. Comparison of (a) PIV and (b) CFD flow visualization images for combined wave
current flow as the wave crest traversed past the upstream cylinder.
Figure 117. Flow images of wave crest passing the downstream cylinder for combined wave and
current flows, T = 0.7s, C = 50 mm/s, for; (a) PIV, (b) CFD.
Figure 118. Flow images of wave crest passing the downstream cylinder for combined wave and
current flows, T = 0.7s, C = 75 mm/s, for; (a) PIV, (b) CFD.
Figure 119. Velocity vector plots around cylinders, for downstream cylinder placed at x = 1 ½ D,
y = 0, for combined wave current flows, T = 0.7 s, C = 50 mm/s over one wave cycle,
at (a) Transient, t = 14T’ and (b) Steady beating, t = 88T’.
Figure 120. Comparison of vorticity plots for slender downstream placed at x = 1 ½ D, y = 0, for
combined wave current flows, T = 0.7 s, C = 50 m, at (a) Transient, t = 14T’ and (b)
Steady beating, t = 88T’.
xvii
Figure 121. Velocity vector plots around cylinders, for downstream cylinder placed at x = 1 ½ D,
y = 0.6 D, for combined wave current flows, T = 0.7 s, C = 50 mm/s over one wave
cycle, at (a) Transient, t = 14T’ and (b) Steady beating, t = 88T’.
Figure 122: Velocity vector plots and corresponding local iso surface plots over two successive
wave periods T, for wave only flow, T = 0.7 s. Downstream cylinder location at x = 1
½ D, y = 0.
Figure 123: Velocity vector plots and corresponding local iso surface plots over two successive
encounter wave periods T
e
, for C = 50 mm/s, T = 0.7 s. Downstream cylinder location
at x = 1 ½ D, y = 0.
Figure 124: Velocity vector plots and corresponding local iso surface plots over two successive
encounter wave periods T
e
, for C = 75 mm/s, T = 0.7 s. Downstream cylinder location
at x = 1 ½ D, y = 0.
Figure 125: Velocity vector plots and corresponding local iso surface plots over each successive
encounter wave periods T
e
, for C = 100 mm/s, T = 0.7 s. Downstream cylinder
location at x = 1 ½ D, y = 0.
Figure 126: Velocity vector plots and corresponding local iso surface plots over two successive
wave periods T, for wave only flow, T = 0.7 s. Downstream cylinder location at x = 1
½ D, y = 0.6 D.
Figure 127: Velocity vector plots and corresponding local iso surface plots over two successive
encounter wave periods T
e
, for C = 50 mm/s, T = 0.7s. Downstream cylinder location
at x = 1 ½ D, y = 0.6 D.
Figure 128: Velocity vector plots and corresponding local iso surface plots over two successive
encounter wave periods T
e
, for C = 75 mm/s, T = 0.7s. Downstream cylinder location
at x = 1 ½ D, y = 0.6 D.
Figure 129: Velocity vector plots and corresponding local iso surface plots over each successive
encounter wave periods T
e
, for C = 100 mm/s, T = 0.7s. Downstream cylinder
location at x = 1 ½ D, y = 0.6 D.
Figure 130. Normalized plot of ratio of beat to wave frequency vs. U
c
/ U
w
for downstream
cylinder placed at x = 1 ½ D, (a) y = 0, (b) y = 0.6 D.
Figure 131. Comparison of beat frequencies between experiments and CFD simulations for
downstream cylinder placed at (a) y = 0, (b) y = 0.6 D.
Figure 132. Comparison of experiment C
D
coefficients with plot from Price (1984).
Figure 133. Schematic of 1-DOF model used in this analysis.
Figure 134. Comparison of simulated surge motions for downstream cylinder located at x = 1 ½
D, y = 0, from linear theory, experiments and CFD for:
(a) Wave only flow, T = 0.7s, fn = 0.5,
(b)Wave current flow, T=0.7s, C=50mm/s, fn=0.5,
xviii
(c) Wave only flow, T = 0.7s, fn=0.108,
(d) Wave current flow, T=0.7s, C=50mm/s, fn=0.108.
Figure 135. Comparison of simulated surge motions for downstream cylinder located at x = 1 ½
D, y = 0.6 D, from linear theory, experiments and CFD for:
(a) Wave only flow, T = 0.7s, fn = 0.5,
(b)Wave current flow, T=0.7s, C=50mm/s, fn=0.5,
(c) Wave only flow, T = 0.7s, fn=0.108,
(d) Wave current flow, T=0.7s, C=50mm/s, fn=0.108.
Figure 136. Vorticity plots showing vortex formation in the wake of the upstream cylinder for (a)
current only flow, C = 50 mm/s, (b) wave only flow, T = 0.7s, (c) combined wave
current flow, C = 50 mm/s T = 0.7s. (Red circles show vortex formation).
xix
List of Tables
Table 1. Force coefficients at oscillatory non-separated flow, using Wang (1968) formulae.
Table 2. Dimensions of cylinder model.
Table 3. Range of parameters in this study.
Table 4. Undisturbed flow normalized characteristics in this study.
Table 5. Reflection coefficients Kr of the wave periods in this study.
Table 6. Vectrino settings for this study.
Table 7. Specifications of Wave Height Meter used in this study.
Table 8. Properties of the glass bead seedlings used in PIV measurements.
Table 9. PIV Timing Setup factors in this study.
Table 10. Test matrix of kinematics measurements in the wake of upstream cylinder.
Table 11. Comparison of experimental and calculated Strouhal frequencies (St = 0.2).
Table 12. X and Y velocity signatures and spectra frequencies at various measured locations,
for T = 0.7 s, C = 50 mm/s.
Table 13. Test matrix of forces acting on a downstream cylinder.
Table 14. Comparison of experimental force spectra and calculated Strouhal frequencies (St =
0.2).
Table 15. Test Matrix of PIV experiments.
Table 16. Mesh refinements at selected locations of the wave tank.
Table 17. Monitored wave heights as a percentage of original wave height for various mesh
sizes.
Table 18. Comparison of inline forces and transverse forces on downstream cylinder, and
wave elevations at x=0.84m, for various prism layers around cylinders.
Table 19. Test matrix of runs carried out in CFD model.
Table 20. Spectra of the wave heights for all cylinder configurations at locations x=-0.84 and
+0.84m.
Table 21. Table of Y force spectra, and dominant beat period. (Windowed FFT are used in y = 0
offset cases.)
xx
Table 22. Waves used in this study, and corresponding modified Keulegan Carpenter number
KC’.
Table 23. Spectra of kinematics in the wake of the upstream cylinder, measured at x = 1 ½ D, y
= 0 and 0.6 D offsets, for (a) Current only flow, (b) combined wave current flow at
KC’ = 0.25, (c) combined wave current flow at KC’ = 0.35.
Table 24. Standard deviation of surge responses of downstream cylinder at different natural
frequencies, and locations for waves only runs.
Table 25. Standard deviation of surge responses of downstream cylinder at different natural
frequencies, and locations for combined waves and currents runs.
xxi
List of Symbols
A(t) Response amplitude with time
a Wave Amplitude
β Stokes parameter
c
Damping coefficient
C
Towed velocity
C
D
Drag Coefficient
C
M
Inertia Coefficient
D General term for cylinder diameter
D
1
Diameter of upstream cylinder
D
2
Diameter of downstream cylinder
d Water Depth
F
D
Drag force
F
I
Inertia force
Fx Inline force on downstream cylinder
Fy Transverse force on downstream cylinder
f
n
Natural frequency
f
v
Average vortex shedding frequency
f
Vortex shedding frequency
g Gravitational acceleration
H Wave Height
K
Spring Coefficient
K
r
Reflection coefficient of experiment waves
KC Keulegan Carpenter Number
KC
cr
KC number at incept to turbulence
KC
h
KC’
KC number related to the hall line
Modified KC number, at a specified water depth
xxii
k
Characteristic Wave Number
L Characteristic Wave Length
L1 Length of upstream cylinder
L2
Length of downstream cylinder
M Mass of Structure
M
a
Added mass
m Cylinder mass per unit length
m* Structure – fluid density ratio
ƞ
Surface elevation
P Pressure
ρ
Density of water
Re Reynolds Number
St Strouhal Number
T Characteristic Wave Period
T’ Encounter Wave Period
t Time Variable
U
c
Current Velocity
U
w
Maximum wave particle velocity
V
r
Reduced velocity relative to upstream cylinder
γ Kinematic viscosity
ω
Angular frequency
ω
e
Encounter angular frequency
x Direction of wave flow
y Direction perpendicular to wave flow
z Elevation level above still water level
xxiii
List of Abbreviations
ADV Acoustic Doppler Velocimeter
ALE Arbitrary Lagrangian-Eulerian method
AVR
Asymmetric vortex reversal
CFD Computational Fluid Dynamics
DC Direct current
DES Detached eddy simulation
DVR Detached vortex reversal
FFT Fast Fourier transform
GUI Graphical user interface
LES
Large eddy simulation
PIV Particle Image Velocimetry
QVS Quasi – Vortex Shedding
RAM Random access memory
RANS Reynolds Averaged Navier-Stokes simulation
SEMI Semi-Submersible offshore floating structure
SPAR SPAR offshore floating platform
SVR
Symmetrical vortex reversal
TAD Tender assisted drilling unit
VOF Volume of fluid simulation
1
Chapter 1. Introduction
1.1 Background
In many offshore operations, there are many instances where two floating structures are positioned
in close vicinity to one other. Some examples of these include a Tender assisted drilling semi-
submersible drilling a well alongside a SPAR platform, a derrick barge lifting modules onto a semi-
submersible and a Tension leg platform (TLP) offloading crude petroleum onto a tanker, amongst
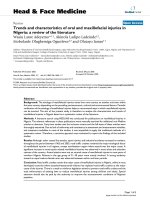
others. Figure 1 below shows an example of a drilling semi-submersible alongside a SPAR
production platform.
Figure 1. Photograph of a semi-submersible drill ship working alongside the Neptune SPAR platform.
In the presence of waves and currents, the dynamics of two bluff bodies close to each other can be
complicated. The wake of the upstream structure is scattered, diffracted and probably turbulent,
and these become the incident flow on the downstream structure. The motions of the structures
further complicate the responses of the two structures. The wave-current-structure interaction is
non-linear and time dependent, and the response frequencies in these combined flows can lend to
amplified motion for some cases.
Public Domain Image from
www.fugrochance.com/