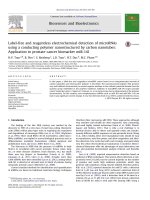
Label free electrochemical DNA and protein detection using ruthenium complexes and functional polyethylenedioxythiophenes
Bạn đang xem bản rút gọn của tài liệu. Xem và tải ngay bản đầy đủ của tài liệu tại đây (4.75 MB, 157 trang )
LABEL-FREE ELECTROCHEMICAL DNA AND PROTEIN
DETECTION USING RUTHENIUM COMPLEXES AND
FUNCTIONAL POLYETHYLENEDIOXYTHIOPHENES
XIE HONG
(M. Sc., NUS)
A THESIS SUBMITTED
FOR THE DEGREE OF DOCTOR OF PHILOSOPHY
DEPARTMENT OF CHEMISTRY
NATIONAL UNIVERSITY OF SINGAPORE
2008
LIST OF PUBLICATIONS
Tansil, N. C.; Xie, H.; Xie, F.; Gao, Z. Q., Direct detection of DNA with an
electrocatalytic threading intercalator. Analytical Chemistry 2005, 77, (1), 126-134.
Tansil, N. C.; Xie, F.; Xie, H.; Gao, Z. Q., An ultrasensitive nucleic acid biosensor
based on the catalytic oxidation of guanine by a novel redox threading intercalator.
Chemical Communications 2005, (8), 1064-1066.
Xie, H.; Tansil, N. C.; Gao, Z. Q., A redox active and electrochemiluminescent
threading bis-intercalator and its applications in DNA assays. Frontiers in Bioscience
2006, 11, 1147-1157.
Xie, H.; Yang, D. W.; Heller, A.; Gao, Z. Q., Electrocatalytic oxidation of guanine,
guanosine, and guanosine monophosphate. Biophysical Journal 2007, 92, (8), L70-
L72.
Luo, S-C; Xie, H.; Chen, N. Y.;Yu, H-h; Ying, J. Y., Functional PEDOT thin film for
electrochemical DNA biosensing and controlled cell adhesion. To be submitted.
Xie, H.; Luo, S-C; Yu, H-h; Ying, J. Y., Functional PEDOT nanowires for label-free
protein detection. To be submitted.
Patents and Technology Disclosures:
Xie, H., Gao. Z.Q., Xie, F., Determination of nucleic acid using electrocatalytic
intercalators, WO 2006/025796, US 2006/0046254, Mar 2006.
Yu, H-H, Ying, J. Y-R., Luo, S-C, Xie, H., Chen, N.Y., polyethylenedioxythiophene
(PEDOT) biointerfaces for DNA detection, IBN Technology Disclosure, Nov 2006.
Yu, H-H., Ying, J. Y-R, Xie, H., Kantchev, E. A. B, Luo, S-C., Non-fouling
polyethylenedioxythiophene (PEDOT) biointerfaces for controlled adhesion of cells
and proteins, IBN Technology Disclosure, Jun 2007.
Conference Presentations:
Xie, H.; Luo, S-C; Yu, H-h; Ying, J. Y., Non-fouling PEDOT for controled cell
adhesion, Oral presentation, NanoBioEurope 2008, Barcelona, 9-13 Jun 2008.
Xie, H.; Luo, S-C; Chen, N. Y.; Yu, H-h; Ying, J. Y., Functional PEDOTs for
electrochemical biosensors, Oral presentation, Regional Electrochemical Meeting of
South-East Aisa 2008, Singapore, 5-7 Aug 2008.
i
ACKNOWLEDGEMENTS
It is a pleasure to thank many people who made this thesis possible.
I would like to start by thanking my advisor, Dr Hsiao-hua (Bruce) Yu, for his
enthusiastic supervision; and my co-advisor, Dr Choon Hong Tan, for many valuable
advices. I would also like to thank my ex-advisors, Dr Zhiqiang Gao and Dr Daiwen
Yang. Although they are unable to guide me throughout my whole PhD work, I am
grateful to their guidance and mentorship during my first year.
I am very grateful to Prof Jackie Y. Ying and Ms Noreena AbuBarka for
allowing me to pursue my dreams in Institute of Bioengineering and Nanotechnology
(IBN). I truly appreciate their constant support over the years. Without them, IBN
would not be so successful today and I would not be able to finish my projects so
smoothly. My gratitude also extends to all IBN administrative staffs for their general
support.
Many wonderful friends have kept me balanced and lighthearted through my
graduate study. They have contributed to this thesis along the way. I would like to
especially thank Dr. Shyh-Chyang Luo, Zaoli Zhang, Natalia Tansil, Emril Ali,
Naiyan Chen, Dr. Eric Kantchev, Dr Shujun Gao, Dr Han Yu, Dr. Hongwei Gu, Dr
Alex Lin, Shawn Tan, Dr Jiang Jiang, Dr Majad Khan, James Hsieh, Guangrong Peh,
Huilin Shao, Dr Peggy Chan and Lishan Wang. I am thankful for their valuable
discussions, assistance, friendship, and for making my stay in IBN enjoyable. I would
like to express my deepest gratitude to those who helped me get through the difficult
times. I thank you for all the emotional support, entertainment and caring you
provided.
ii
Finally I am forever indebted to my family for their love and understanding. I
would like to thank my parents for their endless support when it was most needed.
This thesis is dedicated to you.
Last but not least, I would like to thank IBN, BMRC and A*Star for the
funding.
iii
TABLE OF CONTENTS
List of Publications
Acknowledgements
Table of Contents
Summary
List of Abbreviations
List of Figures, Schemes and Tables
1 Introduction 1
1.1 Background 1
1.1.1 Electrochemical Biosensors 2
1.1.2 Label-Free Electrochemical/Electrical Assays 7
1.1.3 Electroactive Conducting Polymers for Biosensing 10
1.2 Motivation and Objectives 11
1.3 Scope 12
1.4 Thesis Outline 12
2 Ruthenium-Complexed Electroactive Intercalators for Label-Free DNA
Detection 14
2.1 Introduction 14
2.2 Experimental 18
2.2.1 Materials and Reagents 18
2.2.2 Synthesis of Electroactive DNA Intercalators 19
2.2.3 Apparatus 22
2.2.4 Sensor Construction 23
2.3 Results and Discussion 25
iv
2.3.1 Synthesis and Characterization of Electroactive DNA Intercalators 25
2.3.2 Intercalation with DNA 29
2.3.3 Application for Label-free DNA Detection 33
2.4 Conclusions 43
3 Ruthenium-Based Polymer Complexes for Electrocatalytic Guanine
Oxidation 44
3.1 Introduction 44
3.2 Experimental 46
3.2.1 Materials and Reagents 46
3.2.2 Synthesis of Ruthenium-complexed Redox Polymers 46
3.2.3 Preparation of Redox Polymer Modified Electrodes 49
3.2.4 Apparatus 49
3.3 Results and Discussion 50
3.3.1 Synthesis and Characterization of Redox Polymers 50
3.3.2 Redox Polymer Modified Electrode 53
3.3.3 Electrocatalytic Oxidation of Guanine on Modified Electrode 54
3.3.4 Redox Titration 56
3.3.5 Oxidation of Guanosine and Guanosine Monophosphate (GMP) 58
3.4 Conclusions 60
4 Nanostructured Functional Polyethylenedioxythiophenes (PEDOTs) 61
4.1 Introduction 61
4.1.1 Conducting Polymers 61
4.1.2 Nanostructured Conducting Polymers 63
4.1.3 Synthesis of 1-D Conducting Polymer Nanostructures 64
v
4.1.4 1-D Polyethylenedioxythiophene (PEDOT) Nanostructures 65
4.2 Experimental 66
4.2.1 Materials and Reagents 66
4.2.2 Chemical Polymerization 67
4.2.3 Electrochemical Polymerization 68
4.2.4 Characterization 68
4.3 Results and Discussion 68
4.3.1 Surfactant Template-Guided Nanofiber Synthesis 68
4.3.2 Stepwise Electropolymerization 73
4.3.3 Electrical Field-Assisted Nanowire Growth 77
4.4 Conclusions 79
5 PEDOT Nanowires for Label-Free Protein Detection 81
5.1 Introduction 81
5.2 Experimental Section 83
5.2.1 Materials and Reagents 83
5.2.2 Device Fabrication and Nanowire Synthesis 83
5.2.3 Aptamer Immobilization and Protein Binding 84
5.2.4 Electrical Measurement 84
5.3 Results and Discussion 85
5.3.1 Device Characteristics 85
5.3.2 Biomolecule Conjugation 86
5.3.3 Protein Detection 88
5.3.4 1-D Nanostructure vs 2-D Film 91
5.4 Conclusions 93
vi
6 Functional PEDOT Nanobiointerface: Toward in vivo Applications 95
6.1 Introduction 95
6.2 Experimental 97
6.2.1 Materials and Reagents 97
6.2.2 Electropolymerization and Film Synthesis 98
6.2.3 Electrochemical Characterization 99
6.2.4 Polymer Film Analysis 99
6.2.5 Protein Adsorption 100
6.2.6 Cell Culture 100
6.3 Results and Discussions 102
6.3.1 Synthesis and Characterization of Functional PEDOT Thin Films 102
6.3.2 Biocompatibility of Functional PEDOT Thin Films 106
6.3.3 Adhesive and Non-adhesive PEDOT Nanobiointerfaces 107
6.3.4 Controlled Cell Patterning 110
6.3.5 Biotin-functionalized PEDOT Nanobiointerface 111
6.3.6 Peptide-functionalized PEDOT Nanobiointerface 115
6.4 Conclusions 120
7 Conclusions and Outlook 121
References
vii
SUMMARY
This thesis presents our studies on the development of label-free
electrochemical biosensors for DNA/protein detection. The urgent need for the
development of point-of-care devices for the detection of infectious agents and
cancer-related biomarkers motivate us to keep searching for simple, fast, sensitive yet
affordable analytical tools. We have demonstrated two very different approaches for
label-free DNA/protein detection with electrochemical transduction. Ruthenium-
complexed electroactive DNA threading intercalators and aptamer-modified
polyethylenedioxythiophene (PEDOT) nanowires were used as signal reporters for the
corresponding binding events.
In part I, we studied label-free electrochemical DNA detection using
ruthenium-complexed intercalators. Two ruthenium-complexed electroactive DNA
intercalators were synthesized, characterized, and their application for label-free DNA
detection were investigated. One based on electrochemiluminescence, and the other
one based on electrocatalytic oxidation of guanine bases in the DNA sequences. The
electroactive intercalators are dual functional: selective binding of double-stranded
DNA (ds-DNA) and generation of catalytic electrochemical signals. This feature
allows simple and sensitive detection. Moreover, the oxidation potential of guanine
base and its corresponding nucleoside and nucleotide under physiological buffer
condition were determined experimentally first time by electrocatalytic oxidation
titration using ruthenium-complexed redox polymer modified electrode.
In part II, we explored the use of a conducting polymer, functionalized
polyethylenedioxythiophene (PEDOT), as an intrinsic transducer for label-free protein
sensing. Various approaches for the synthesis of 1-D PEDOT nanostructures were
viii
studied. Functional PEDOT nanowires were directly synthesized across the electrode
junction under the assistance of an external electric field. Such PEDOT nanowires
devices can be applied immediately after synthesis for field effect transistor (FET)
based sensing, eliminating complicated post-synthesis alignment and assembly.
Label-free detection of a blood-clogging factor, thrombin, was demonstrated using
aptamer-modified PEDOT nanowires. In comparison with 2-D thin films, 1-D
nanostructures are crucial for field effect transistor (FET) based sensing. The PEDOT
nanowire based sensing platform is applicable for label-free detection of DNA as well
as proteins which their DNA aptamers are available.
Finally, we evaluated functional PEDOT thin films as tunable
nanobiointerfaces for effective biomolecule immobilization and controlled cell
adhesion, for future cell-based sensing and other in vivo applications. Particularly,
biotin-functionalized PEDOT surface and peptide-functionalized PEDOT surface
were achieved through direct polymerization from mixed monomer solution and facile
post-polymerization functionalization. Specific protein adsorption and controlled cell
attachment were demonstrated on these biologically-relevant functionalized PEDOT
surfaces. Similar modification is also feasible on nanostructured PEDOT surfaces, and
we expect to see more exciting in vivo applications in the future.
ix
LIST OF ABBREVIATIONS
AFM Atomic force microscope
APS Ammonium persulfate
BSA Bovine serum albumin
Bpy 2,2′-bipyridine
CV Cyclic voltammetry
CMC Critical micelle concentration
CP Capture probe
CPNWs Conducting polymer nanowires
CTAB Cetyltrimethylammonium bromide
DNA Deoxyribonucleic acid
ds-DNA Double-stranded DNA
ss-DNA Single-stranded DNA
2/1
E
Half wave potential
EB Ethidium bromide
ECL Electrochemiluminescence
EDC 1-ethyl-3-[3-(dimethylamino)-propyl]carbodiimide
EDOT 3,4-ethyelendioxythiophene
EIS Electrochemical impedance spectroscopy
ELISA Enzyme-linked immunosorbent assay
FBS Fetal bovine serum
FET Field effect transistor
GMP Guanosine monophosphate
HR-MS High resolution mass spectrometry
IME Interdigitated microelectrode
ITO Indium tin oxide
x
LSV Linear scan voltammograms
MLCT Metal-to-ligand charge-transfer
mRNA Messenger ribonucleic acid
ND Naphthalene diimide
NHE Normal hydrogen electrode
NHS N-hydroxysulfosuccinimde
PAA Polyacrylamide
PIND N,N′-bis[(3-propyl)imidazole]-1,4,5,8-naphthalene diimide
PBS Phosphate buffered saline
PCR Polymerase chain reaction
PDMS Polydimethylsiloxane
PEDOT Polyethylenedioxythiophene
PPy Polypyrrole
PVI Poly(4-vinylpyridine)
PVP Poly(N-vinylimidazole)
QCM Quartz crystal microbalance
SDS Sodium dodecyl sulfate
SEM Scanning electron microscope
SWV Square wave voltammetry
TE Tris-EDTA buffer
TEM Transmission electron microscope
TMEDA N,N,N′,N′-tetramethylethylenediamine
TPA Tri-n-propylamine
UV-Vis Ultra violet-visible
xi
LIST OF FIGURES
Figure 1-1: Schematic presentation of a biosensor 1
Figure 1-2: Schematic of nanowire based FET sensor (adapted from Ref
62
) 9
Figure 2-1: Cyclic voltammograms of the starting materials Ru(bpy)
2
Cl
2
(····),
reaction mixture after refluxing with PIND for 30 min in ethylene glycol ( ), and
the purified final product (―). Supporting electrolyte: PBS; Scan rate: 100 mV/s 26
Figure 2-2: Cyclic voltammograms of the purified Ru-PIND-Ru in PBS at scan rate
of (a) 100, (b) 200, (c) 300, (d) 400, and (e) 500 mV/s 26
Figure 2-3: Cyclic voltammograms of Ru(dmbpy)
2
Cl
2
after refluxing with PIND for
(a) 0, (b) 10, and (c) 30 min. Supporting electrolyte: PBS; Scan rate: 100 mV/s 27
Figure 2-4: UV-Vis absorption spectra of (a) PIND-Ru-PIND, (b) Ru(dmbpy)
2
(Im)
2
,
(c) Ru(dmbpy)
2
Cl
2
, and (d) PIND in ethanol 29
Figure 2-5: UV-Vis spectra of 25 µM Ru-PIND-Ru (resolution 0.10 nm) as a
function of increasing concentration of salmon sperm DNA (in base pair) of (a) 0, (b)
25, (c) 50 and (d) 100 µM. Insert: Enlarged UV-Vis adsorption spectra of the
intercalative binding region 30
Figure 2-6: (A) Fluorescent displacement titration curve of Ru-PIND-Ru against a 5
μM hairpin oligonucleotide with EB. (B) Scatchard plot for the titration of hairpin
oligonucleotide/EB with Ru-PIND-Ru 32
Figure 2-7: UV-Vis absorption spectra of 20 μM PIND-Ru-PIND in 0.10 M pH 7.0
phosphate buffer with increasing concentration of salmon sperm DNA (from top, 0,
20, 40, 60, 80 and 100 μM in base pair) 33
Figure 2-8: Cyclic voltammograms of 200 nM of (a) poly(T)
40
hybridized to a non-
complementary capture probe coated electrode, and (b) poly(AT)
20
, (c) poly(AG)
20
,
and (d) poly(G)
40
hybridized to their complementary CP coated electrode,
respectively. Scan rate: 100 mV/s 34
Figure 2-9: Cyclic voltammograms of TP 53 hybridized to (a) perfectly-matched and
(b) one-base-mismatched biosensors. Hybridization was carried out in TE buffer
containing 1.0 mg of mRNA. Scan rate: 100 mV/s 36
Figure 2-10: (a) ECL intensity at 610 nm versus potential profiles, cyclic
voltammograms of (b) 5.0 μM PIND-Ru-PIND in 0.10 M phosphate buffer (pH 7.0),
and (c) 5.0 μM PIND-Ru-PIND in TPA saturated phosphate buffer. Scan rate: 20
mV/s. For clarity, the voltammogram of PIND-Ru-PIND was scaled up 50 times 38
Figure 2-11: (a) Photoluminescence spectrum of PIND-Ru-PIND (430 nm
illumination) in 0.10 M phosphate buffer and (b) ECL spectrum of PIND-Ru-PIND in
a TPA saturated 0.10 M phosphate buffer 39
xii
Figure 2-12: Linear scan voltammograms (LSV) of PIND-Ru-PIND bound to (a) 200
nM of complementary DNA, and (b) 1.0 μM non-complementary DNA hybridized
biosensors. Supporting electrolyte: 0.10 M phosphate buffer (pH 7.0), potential scan
rate 100 mV/s 40
Figure 2-13: ECL responses at 610 nm of PIND-Ru-PIND bound to biosensors
hybridized with (a) 1 nM non-complementary target, (b) 50 pM one-base-mismatched
target, and (c) 50 pM complementary target. Poise potential: 1.0 V, ECL measurement
was done in TPA saturated phosphate buffer 42
Figure 2-14: Effect of TPA (•) and applied potential (◦) on the ECL responses at 610
nm of 50 pM complementary DNA after incubation in 10 μM PIND-Ru-PIND 43
Figure 3-1: Cyclic voltammograms of the reaction mixtures at different reaction time
during the synthesis of PVIPAA-Ru(bpy)
2
Cl: (a) 0, (b) 2 h and (c) 20 h 51
Figure 3-2: UV-Vis spectra of Ru(bpy)
2
Cl
2
before (―) and after ( ) grafting to the
polymer backbone 52
Figure 3-3: (A) Sweep-rate dependency of the CV of a PVIPAA-Ru(bpy)
2
Cl
2
coated
ITO electrode in PBS, scan rate=20, 50, 100, 200, 500, 1000 mV/s, following arrow
direction. (B) The plot of anodic peak current with scan rate 53
Figure 3-4: Cyclic voltammograms of redox polymer thin film coated ITO electrodes
in PBS. From left to right: (a) PVPPAA-Ru(OCH
3
), (b) PVPPAA-Ru(CH
3
), (c)
PVPPAA-Ru, (d) PVIPAA-Ru(COOCH
3
), (e) PVPPAA-Ru(COOCH
3
) 54
Figure 3-5: Cyclic voltammograms of blank ITO in (A) PBS and (B) PBS with 0.5
mM guanine at different pH: (―–) 10.5, (·····) 9.5, (– – –) 8.5, (· − · −) 7.5 55
Figure 3-6: Cyclic voltammograms of a PVIPAA-Ru(bpy)
2
Cl thin film coated ITO
electrode in (a) PBS and (b) PBS with 20 mM guanine. (c) Cyclic voltammogram of
a bare ITO electrode with 50 mM guanine in PBS. Scan rate: 100 mV/s 56
Figure 3-7: Titration curves showing the increase in the electrocatalytic guanine
oxidation current when the pH is raised at redox polymer film coated ITO electrodes.
From left to right, (a) PVIPAA-Ru(COOCH
3
), (b) PVPPAA-Ru, (c) PVPPAA-
Ru(CH
3
), (d) PVIPAA-Ru, (e) PVPPAA-Ru(OCH
3
), (f) PVIPAA-Ru(OCH
3
) 57
Figure 3-8: pH dependency of the threshold-potentials of (a) guanine (•), (b)
guanosine (▪), and (c) GMP (◦) electrooxidation, catalyzed by different polymers 58
Figure 3-9: Chemical structures of guanine, guanosine and GMP 59
Figure 4-1: Chemical structures of common conductive polymers 62
Figure 4-2: Chemical structure of EDOT-OH and EDOT-COOH 67
Figure 4-3: (a) SEM image and (b) TEM image of poly(EDOT-COOH) nanofibers.
(c) HRTEM image of individual nanofiber 69
xiii
Figure 4-4: SEM images of poly(EDOT-COOH) obtained at different surfactant
concentration (SDS used as a surfactant and FeCl
3
as oxidizing agent, monomer
concentration was kept constant at 15 mM): (a) 30 mM, (b) 50 mM, (c) 60 mM, (d) 80
mM, and (e) 100 mM 70
Figure 4-5: SEM images of poly(EDOT-COOH) obtained at different monomer
concentration: (a) 2, and (b) 20 mM, in the presence of 100 mM SDS and 40 mM
FeCl
3
. SEM images of poly(EDOT-COOH) obtained from (c) 10x, (d) 5x, and (e) 2x
dilution from the original mixture of 20 mM monomer, 100 mM SDS and 40 mM
FeCl
3
70
Figure 4-6: Schematic of the salt-assisted surfactant micelle transformation and
formation of poly(EDOT-COOH) nanofibers 71
Figure 4-7: SEM image of Poly(EDOT-COOH) nanostructures obtained in the
presence of 30 mM EDOT-COOH monomer and 10.5 mM CTAB with different
oxidizing agent (A) 30 mM of APS (B) 60 mM FeCl
3.
73
Figure 4-8: FESEM image of the PEDOT nanotubes deposited on the
microelectrodes consisting of a pair of gold interdigitate electrodes with 40 fingers
(dimensions: 10 μm width, 4000 μm length, 50 nm thickness, 10 μm inter-electrode
gap). Adapted from Ref
73
73
Figure 4-9: SEM images of (a) poly(EDOT-COOH) and (b) poly(EDOT-OH).
Polymerization was done under constant current, 0.5 mA/cm
2
, in TBAPF
6
/CH
3
CN
containing 10 mM monomer. Images at bottom panel are taken at higher
magnification 75
Figure 4-10: SEM images of poly(EDOT-COOH) polymerized under constant
current, 0.25 mA/cm
2
, in (a) 0.1 M TBAPF
6
/CH
3
CN and (b) 0.1 M LiClO
4
aqueous
solution (9:1 H
2
O: CH
3
CN) containing 10 mM EDOT-COOH monomer. Images at
bottom panel are taken at higher magnification 76
Figure 4-11: SEM images of poly(EDOT-OH) polymerized under constant current,
0.1 mA/cm
2
, from 10 mM EDOT-OH aqueous solution with different surfactants (a)
50 mM SDS, (b) 5 mM Brij 35, and (c) 2% P123. Supporting electrolyte: 0.1 M
LiClO
4
77
Figure 4-12: (a) Optical and (b) scanning electron micrograph of poly(EDOT-COOH)
nanowires grown between two Au electrodes under alternating electric field 78
Figure 4-13: Scanning electron micrograph of poly(EDOT-COOH) nanowires grown
between two Au electrodes under DC field 78
Figure 5-1: Experimental setup of CPNW FET devices for protein detection. Au 1
and Au 2 represent two working electrodes (WE1 and WE2), served as source and
drain respectively. Counter electrode is a Pt wire where the electrochemical gate
potential is applied via the reference electrode (Ag/AgCl). A bias voltage (V
bias
)
applied between WE1 and WE2 (V
bias
=V
WE1
-V
WE2
) is equivalent to source-drain
current (V
sd
) 84
xiv
Figure 5-2: Electrical characteristics of poly(EDOT-COOH) nanowire device. (a) I-V
curve, (b) I
sd
-V
sd
characteristics at varying V
g
(V
g
= -0.4 to + 0.4 V, step = 0.1 V, scan
rate = 1 mV/s) in 0.1 M LiClO
4
/buffer (pH=5), and (c) |I
sd
|-V
g
plot at constant V
sd
= -
0.2 V, derived from the above I
sd
-V
sd
characteristics 86
Figure 5-3: I
sd
-V
sd
characteristics of the poly(EDOT-COOH) nanowire device at gate
voltage of 0 V (a) before and (b) after aptamer immobilization 87
Figure 5-4: Normalized current change before and after immobilization of different
biomolecules on the poly(EDOT-COOH) nanowires (V
g
= 0, V
sd
= 0.4 V) 88
Figure 5-5: Typical I
sd
-V
sd
characteristics of aptamer-modified PEDOT nanowire
devices (a) before and (b) after incubation with thrombin (V
g
= 0 V) 89
Figure 5-6: Normalized current change of aptamer-modified PEDOT nanowire
devices after incubation with 100 nM thrombin: (a) 49-mer non-complementary probe,
(b) 28-mer non-complementary probe, (c) thrombin-binding aptamer 90
Figure 5-7: (A) Overlay of I
sd
-V
sd
curves after 1 h incubation with thrombin at
concentration of 0, 1, 10, 100, 1000 nM, follow arrow direction. (B) Calibration curve
of aptamer-modified PEDOT nanowire device: normalized current change (-∆I/I
0
) as
a function of thrombin concentration. The source-drain current was measured at V
sd
=
0.4 V and V
g
=0 V 90
Figure 5-8: Electrical characteristics of poly(EDOT-COOH) thin film device. (A) I
sd
-
V
sd
characteristics at varying V
g
(V
g
= -0.4 to + 0.4 V, step = 0.1 V, scan rate = 1
mV/s) in 0.1 M LiClO
4
/buffer (pH=5), (B) |I
sd
|-V
g
plot at constant V
sd
(a) 0.2 V and (b)
-0.2 V, derived from the I
sd
-V
sd
characteristics 91
Figure 5-9: I
sd
-V
sd
characteristics of poly(EDOT-COOH) thin film device (a) before,
(b) after aptamer immobilization, and (c) after thrombin binding (V
g
= 0 V) 92
Figure 5-10: Fluorescence microscope image of poly(EDOT-COOH) modified with
(a) random sequence probe and (b) thrombin-binding aptamer after binding with
thrombin and a Cy3-labeled 2
nd
aptamer 92
Figure 5-11: The major advantage of 1-D nanostructures (B) over 2-D thin film (A)
for FET based biosensing. Adapted from Ref
211
93
Figure 6-1: Chemical structures of functionalized EDOT monomers 98
Figure 6-2: Chemical structures of (A) EDOT-C
1
-biotin, (B) EDOT-C
8
-biotin, and (C)
EDOT-C
15
-biotin 98
Figure 6-3: (a) Electropolymerization of 10 mM of EDOT-OH monomers in CH
3
CN
( ) and in aqueous microemulsion containing 0.05 M of SDS and 1 mM of HCl (––)
with 0.1 mM of LiClO
4
as supporting electrolyte at a scan rate of 100 mV/s. (b) In
situ QCM measured weight gain during the electropolymerization shown in (a) 103
Figure 6-4: Electropolymerization of (A) 10 mM of EDOT-C
8
-biotin monomer, (B)
10 mM of EDOT-OH monomer with different ratio of EDOT-C
8
-biotin, and (C) 10
mM of EDOT-OH monomer with 10% of EDOT-C
8
-biotin, in aqueous
xv
microemulsion containing 0.05 M of SDS and 1 mM of HCl with 0.1 mM of LiClO
4
as supporting electrolyte at a scan rate of 100 mV/s 104
Figure 6-5: Molecular modeling result of EDOT-C
1
-biotin and EDOT-C
12
105
Figure 6-6: SEM (a) and AFM (b) image of poly(EDOT-COOH) film prepared from
aqueous microemulsion 106
Figure 6-7: Viability of NIH3T3 (gray) and HepG2 (black) cells in the presence of
different PEDOT film coated ITO glass substrate 107
Figure 6-8: Adhesion of NIH3T3 (above) and KB (below) cells on PEDOT
nanobiointerfaces of different monomer compositions: (a) EDOT, (b) EDOT-OH, (c)
EDOT-COOH, and (d) EDOT-EG
3
-OH/EDOT-OH, molar ratio=9:1 108
Figure 6-9: Attachment and proliferation of seeded NIH3T3 cells on poly(EDOT-OH)
biointerface after (a) 2 h, (b) 15 h, and (c) 39 h of incubation in full medium 108
Figure 6-10: (a) Legend of monomer composition of layered PEDOT
nanobiointerfaces. (b)–(g) Controlled cell adhesion from alternating layer-by-layer
PEDOT nanobiointerface deposition with adhesive and non-adhesive properties 109
Figure 6-11: Contact angles of layer-by-layer PEDOT nanobiointerfaces deposition.
The color legends for the composition of PEDOT nanobiointerfaces are as shown in
Figure 6-10 110
Figure 6-12: Controlled cell adhesion on patterned poly(EDOT-OH) on poly(EDOT-
EG
3
-OH)-co-poly(EDOT-OH) surfaces. (a) Top and side views of the device
patterned by selective electropolymerization using PDMS mask. Magnified
microscopic images of selective cell adhesion on the patterned surface were shown in
(b) and (c) 111
Figure 6-13: XPS analysis of poly(EDOT-OH) before (dashed line) and after
biotinylation reaction (solid line). The inset shows the amplified region corresponding
to N1s emission 113
Figure 6-14: QCM studies of binding of BSA and streptavidin on functional PEDOT
surfaces (○) non-biotin functionalized PEDOT (□) biotin-functionalized PEDOT 115
Figure 6-15: Water contact angle of poly(EDOT-EG
3
-OH)-co-(EDOT-COOH) film
before and after peptide conjugation. Monomer molar ratio of EDOT-EG
3
-OH:
EDOT-COOH = 8:2 117
Figure 6-16: Controlled cell attachment (NIH3T3) on (a) RGD-functionalized, (b)
carboxylic acid-functionalized, and (c) RDG-functionalized PEDOT surfaces.
Functional group density was controlled at 10% while the remaining 90% are
poly(EDOT-EG
3
-OH) 118
Figure 6-17: Cell adhesion on RGD-modified PEDOT surfaces with different RGD
density (a) 50%, (b) 20%, (c) 10%, (d) 5%, and (e) 1%. The effect of RGD density on
cell adhesion was plotted on the right bottom. The y-axis is the number of attached
cells per cm
2
119
xvi
LIST OF SCHEMES
Scheme 3-1: Synthetic scheme of (A) PVP-co-PAA and (B) PVI-co-PAA 47
Scheme 3-2: Synthetic scheme of Ru complexes as electroactive pendant unit 48
Scheme 3-3: Synthesis of redox polymer (A) Ru-complexed PVP-co-PVI and (B) Ru-
complexed PVI-co-PAA 49
Scheme 6-1: (a) Post-polymerization biotinylation of poly(EDOT-OH) films, (b)
Post-polymerization biotinylation of poly(EDOT-COOH) films 112
LIST OF TABLES
Table 2-1: Oligonucleotide sequences for DNA hybridization assay 19
Table 2-2: Oligonucleotide sequences for tumour protein gene TP53 detections 19
Table 2-3: Hairpin oligonucleotide sequences for intercalation study 19
Table 2-4: QCM data of CP coated quartz crystal after hybridization and intercalation
37
Table 3-1: Oxidation potential of polymers complexed with different substituted
ruthenium redox units 53
1
1 Introduction
1.1 Background
Tremendous advances have been achieved in the area of biosensors over the
past three decades. Biosensors are compact analytical devices that employ the
biochemical molecular recognition event for the detection or identification of target
analytes. They have been widely applied in various areas including clinical
diagnostics, environmental monitoring, homeland security, food and pharmaceutical
analysis.
1-8
All biosensors have the basic configuration that comprises an analyte
recognition layer and a signal conversion unit (transducer).
Figure 1-1: Schematic presentation of a biosensor
Nearly all types of biointeraction can be implemented into analyte recognition
schemes, from small biomolecules, nucleic acids, enzymes and antibodies to viruses,
whole cells and microorganisms. The measurable signal can be in the form of light
(optical), frequency (acoustic) or current (electrical), depending on the transducer
used. Biosensors can be classified either according to the target analyte or the signal
generated from the transducer. A good biosensor should be sensitive, specific, fast,
easy to use, reliable and cheap.
2
Advances in molecular biology have led to a better understanding of
DNA/proteins and their specific functions. The occurrence of various cancers and
diseases usually involves altered gene/protein expression. Potential biomarkers
associated with cancer or other diseases have been identified throughout many years
research. The accurate detection of these biomarkers would be useful for the early
diagnosis of specific diseases in clinical research.
Early diagnosis of cancer is crucial for the successful disease treatment.
However, cancer markers are generally presented at an ultra-low level during early
stages of the disease. Existing diagnostic tests (e.g. ELISA) are not sensitive enough
and only detect proteins at levels corresponding to advanced stages of the disease.
Therefore, highly sensitive detection techniques are urgently needed for effective
cancer treatment and increased survival rates. Moreover, smaller, faster and cheaper
biosensor devices are highly desired for decentralized clinical test such as emergency-
room screening, bedside monitoring and home self-testing.
1.1.1 Electrochemical Biosensors
Electrochemical biosensors are sensing devices that the biological recognition
element is intimately coupled to an electrode transducer. The transducer is able to
convert the biological recognition event into a useful electrical signal, either in the
form of potential (potentiometric), current (amperometric) or impedance
(impedimetric). Considering that electrochemical reactions directly generate an
electronic signal, biosensors based on this approach greatly simplified signal
transduction, avoiding expensive equipment requirement. Over the years,
electrochemical biosensors have been demonstrated as a simple, inexpensive and yet
accurate and sensitive platform for disease diagnosis. The flagship example of
3
commercial success amperometric biosensor is for blood glucose measurement. The
first generation glucose biosensor was demonstrated by Clark and Lyons in 1962.
9
To
date, easy-to-use self-testing glucose strips, coupled to pocket-size amperometers,
have dominated the $5 billion/year diabetes monitoring market.
10
The continuous
growing market for the need of home monitoring devices is the key to success. Beside
blood glucose, hand-held battery operated electrochemical clinical analyzers have
been shown extremely useful for rapid point-of-care measurement of multiple
electrolytes, metabolites
11
as well as bedside blood gas monitoring.
12
Despite the commercial success of electrochemical biosensors for blood sugar
monitoring, cancer-related assays are far more complex than home self-testing of
glucose. Tremendous efforts have been put into the development of biosensors for
DNA/protein detection over the past two decades. Modern electrochemical
DNA/immunosensors have recently demonstrated great potential for monitoring
cancer-related protein markers and DNA mutations.
13
Electrochemical nucleic acid assays
Nucleic acid assays are often involved in clinical analysis for the detection of
specific nucleotide sequences, either for the identification of a particular
microorganism that is infectious, or DNA mutations that is associated with certain
genetic diseases. For sequence specific assays, single-stranded nucleic acid sequences
are immobilized on an electrode surface as the recognizing elements. In the presence
of the target analyte, complementary sequence in the case, the hybridization event is
detected electrochemically directly or indirectly. Nucleic acid hybridization is a
thermodynamic favored process, triggered by highly specific base-pairing interactions,
where each nucleotide base strongly binds to its complementary base through
hydrogen bonds. Vast amount of literature has been published in DNA hybridization
4
detection, and many comprehensive reviews on DNA-based biosensors are
available.
14-22
Therefore, we will not review the literature again here, but only
highlight different transduction strategies used in electrochemical DNA biosensors.
The transduction strategies for DNA hybridization detection can be broadly
divided into two main categories, label-free and labeled approaches. Various labels
including redox active molecules,
23
enzymes,
24-28
and nanoparticles
29
have been used
to tag target DNA sequence for hybridization event monitoring. In label-free approach,
cationic metal complexes
22, 30-33
(e.g. Ru(NH
3
)
6
3+
, Fe(CN)
6
3-
, Co(Phen)
3
3+
, Co(bpy)
3
2+
)
or organic compounds
34-37
(e.g. methylene blue, daunomycin, AQMS:
anthranquinone-2-sulfonic acid), have been reported for the use as hybridization
indicators, based on their preferential binding to either ss-DNA or ds-DNA. Other
label-free methods for the detection of DNA hybridization rely on changes to the
electrical properties of an interface,
21
the change in flexibility from ss-DNA to the
rigid ds-DNA
38-40
and the electrochemical oxidation of guanine bases.
41, 42
General
electrochemical techniques such as cyclic voltammetry (CV), square wave
voltammetry (SWV), AC voltammetry, pulsed amperometry, and electrochemical
impedance spectroscopy (EIS) are employed to decode the hybridization event.
Despite enormous progress made in the development of electrochemical DNA
biosensors, key issues leading to the final commercialization are still around the
sensitivity, selectivity, and simplicity.
Electrochemical immunoassays and protein assays
Moving beyond DNA, electrochemical biosensors were also employed to
detect proteins. Abnormal expression of certain proteins can indicate the presence of
various cancers. Quantitative determination of these tumor markers plays an
important role in disease screening, diagnosis and treatment. Several authors gave
5
excellent reviews on the development of electrochemical immunoassays.
43-46
Electrochemical immunosensors, combining the inherent specificity of
immunoreactions with the high sensitivity and convenience of electrochemical
transducers, are becoming an important analytical tool for the detection of antibody-
antigen interactions.
In electrochemical immunoassays, changes of potential, current, conductance,
capacitance or impedance caused by the immunoreactions can be directly detected
and correlated to the level of analyte. However, the binding of an antigen to their
specific antibody is accompanied by only small physical-chemical changes, and their
sensitivity is limited for clinical applications. Therefore, different labels such as
enzymes, nanoparticles and carbon nanotubes have been used for amplifying the
response from immunoreactions.
Enzymes are the most frequently used labels due to their inherent amplification.
Although homogeneous assays, which is based on the change of the activity of
enzyme labels before and after forming immunocomplex, do not require the
separation the free enzyme labels, heterogeneous assays, with more complicated
procedures, offers better limit of detection. The sensitivity of enzyme-based
immunoassays could be further enhanced when combined with other ways of
electrochemical signal amplifying. However, the inherent drawback of this approach
is the labor-intensive processes involving long incubation periods and multiple
incubation and washing steps.
44
Gold nanoparticles have recently been used for ultrasensitive electrochemical
protein detection.
47
A capture antibody was immobilized on the ferrocenyl-tethered
dendrimer modified indium tin oxide electrode. The detection antibody was labeled
with 10 nm gold nanoparticles. The gold nanoparticles catalyze the reduction of p-
6
nitrophenol to p-aminophenol (AP), the catalytically-generated AP was further
electrochemically oxidized to p-quinone imine (QI) by the electron mediation of
ferrocene on the ITO surface, and QI was then chemically reduced back to AP by
NaBH
4
in solution. A detection limit of 1 fg/mL for mouse immunoglobulin (IgG) and
prostate-specific antigen (PSA) was achieved. Dequaire et al also demonstrated a
sensitive immunoassay for IgG using gold nanoparticles to label the antibody.
48
The
nanogold label was measured by stripping volammetry after dissolution with acid.
The large number of gold ions released from each gold nanoparticle contribute to a
substantial improvement in sensitivity, as low as 3 pM IgG was detected. Similarly,
wang’s group used different quantum dots (ZnS, PbS, Cds, CuS) to label antibodies
for each specific protein. Multiple proteins were measured simultaneously based on
stripping amperometric signal of different metal ions released from those inorganic
nanocrystals.
49, 50
Beside nanoparticles, carbon nanotubes (CNTs) were also used to amplify
detection signal in electrochemical protein assays. CNTs served as a carrier for
enzyme molecules. Using alkaline phosphate (ALP)-loaded CNTs to label detection
antibody, as low as 500 fg/mL of IgG was detected in a sandwich assay.
51
Similarly,
sensitive detection of PSA was demonstrated using CNTs modified with horse radish
peroxidase (HRP) labeled secondary antibody. Due to the large surface area of CNTs,
hundreds of HRP labels per binding event were achieved, and as low as 4 pg/mL PSA
was detected in 10 uL of undiluted calf serum.
52
The tremendous progress in nanotechnology offers excellent prospects for
developing highly sensitive protein biosensors. The use of nanomaterials in
elelctrochemical protein assays for signal enhancement lies in two aspects. One relies
on the unique material properties of nanomaterials for sensitive signal transduction.
7
The other is based on the use of nanomaterials as carriers for the amplification of
binding events. A drawback of using nanomaterials as labels in electrochemical
protein assays is that the preparation of the labels is not very reproducible. In addition,
fouling of the electrode surface can lead to poor reproducibility.
1.1.2 Label-Free Electrochemical/Electrical Assays
As discussed in earlier sections, most of the current detection technologies
require the labeling of target analytes for signal generation or amplification. The main
disadvantage of the label-based bioassays is the long procedures involving multi-steps
of incubation and washing. Labeling process usually involves complex chemical
reaction with the biological target, which is time consuming and costly. Furthermore,
the target biomolecules may lose its biological function after labeling due to
degradation. This becomes more particular in the case of immunoassay or other
protein assays. To bypass these drawbacks, label-free bioaffinity sensors are
intensively investigated. Label-free approach is becoming a more favored choice due
to its simple and rapid analysis.
Electrochemical detection
Label-free detection of DNA hybridization can be monitored using
electrochemical techniques, relying on either the changes of electrical or physical
properties on the interface. Hybridization indicators, based on their preferential
binding to either ss-DNA or ds-DNA, were commonly used as signal reporters. For
protein sensing, various recognition strategies based on biomolecules interactions,
such as antibody/antigen, aptamer/protein and carbohydrate/protein have been
exploited.
53, 54
Interactions between the immobilized antibody and the target antigen
has been directly monitored using a variety of electrochemical techniques such as


![teaching music to students with special needs [electronic resource] a label free approach](https://media.store123doc.com/images/document/14/y/pj/medium_pju1401474515.jpg)