Characterization of interfacial mechanical properties using wedge indentation method 5
Bạn đang xem bản rút gọn của tài liệu. Xem và tải ngay bản đầy đủ của tài liệu tại đây (3.55 MB, 16 trang )
Chapter 4
73
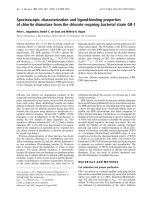
Table 4.1: Indentation load and plastic depth that are associated with the crack profiles
induced by the wedge and the Berkovich indentations on the MSQ/Si system [1].
Crack Profiles
Berkovich
indentation
90° Wedge
indentation
120° Wedge
indentation
P (mN) h
p
(nm) P (mN) h
p
(nm) P (mN) h
p
(nm)
Central crack 15.0 334.0 2.0 200.0 6.0 240.0
Corner crack 15.0 334.0 2.6 242.0 8.0 280.0
Interfacial crack
*
15.0 334.0 2.6 242.0 10.0 288.0
Interfacial crack
kinks to film
surface
30.0 431.0
†
9.0 355.0 15.0 358.0
Further analysis on cross-sectional view and plane view images of the
Berkovich indentation impressions (Fig.4.6) shows that the fracture processes induced
by the wedge and the Berkovich indentations are dissimilar in several aspects: (a) the
Berkovich indentation does not lead to any pop-in event (Figs.4.1(c) and 4.6(b)), when
a central crack forms; (b) the corner cracks propagations are found along the radial
direction of the Berkovich indentation impression and are originated from the
impression corners (Fig.4.6(b)); and (c) the Berkovich indentation induces a circular-
like shaped delamination (Fig.4.6(c)). Table 4.1 shows the indentation load (P) and
plastic depth (h
p
) that are associated with the crack profiles induced by the Berkovich
and the wedge indentations. As can be seen, the Berkovich indentation on the MSQ
film (400nm thick) at indentation load 30mN has an indentation plastic depth greater
than the film thickness, resulting in the plastic deformation of the Si substrate. The
*
The interfacial crack was observed from the FIB sectioning perpendicular and at the
middle of the indent.
†
MSQ film thickness is 400nm. The Berkovich indentation plastic depth, h
p
is greater
than film thickness, when indentation load is 30mN.
Chapter 4
74
substrate plastic deformation during the interfacial delamination will affect the strain
energy release rate; thus the analysis methodology developed to determine interfacial
toughness (Section 4.2) may give less accurate results for the Berkovich indentation.
The crack profiles for 90° and 120° wedge indentations on the MSQ/Si system
are found to be similar, with minor differences in the indentation load and the plastic
depth that are associated to the cracks (Table 4.1). Comparing the FIB cross-sectional
images at the center of the indentation impression, it is found that: (a) for the 120°
wedge indentation, the corner crack (8mN) appears prior to the interfacial crack
(10mN) (Fig.4.3(a)); and (b) for the 90° wedge indentation, both the corner crack and
the interfacial crack are observed to initiate simultaneously at ~3mN (Fig.4.2(b)).
Before the complete spall-off of the film from substrate, the interfacial crack length for
the 120° wedge indentation (2a’ ≈ 3.92µm
*
) is found to be greater than that for the 90°
wedge indentation (2a’ ≈ 3.01µm). Nevertheless, for both 90° and 120° wedge
indentations, it is reasonable to make the assumption that the Si substrate does not
undergo any plastic deformation, because the indentation plastic depths are generally
less than the film thickness even when the interfacial crack kinks to the film surface
(Table 4.1). Comparing to the Berkovich indentation, the wedge indentations have
greater interfacial crack driving force; therefore, it can confine the indentation plastic
zone within the film. In conclusion, the wedge tips have been identified as the most
suitable indenter geometry to characterize the interfacial toughness of thin film
systems with brittle interface.
*
2a’ is the short-axis crack length of the elliptical shaped delamination, as shown in
Fig.4.4(d).
Chapter 4
75
4.1.2 The Correlation Studies on the BD/Si System
A correlation study similar to that on the MSQ/Si system is conducted on the
BD/Si system to confirm the crack configuration and to compare the indentation-
fracture correlations for the BD/Si and the MSQ/Si systems. It is important to note that
the intrinsic chemical structure of BD/Si and MSQ/Si are different, and this might be
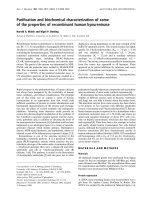
reflected by the indentation-fracture correlation. Fig. 4.7 shows the nanoindentation P-
h curves for 500 nm BD film. The indentations are made with increasing maximum
indentation load, P
max
from 7 to 10 mN using a 90° wedge tip. The P-h curves for BD
films with other thickness will not be presented, as the discussions on the correlation
are similar.
Fig. 4.7: Load-penetration depth (P-h) curves for the 500 nm BD film with the
maximum indentation loads varying from 7 mN to 10 mN. [2]
F
i
c
t
t
h
c
t
i
l
t
s
F
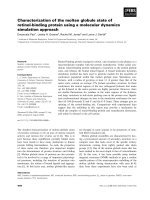
ig. 4.8:
F
i
ndentation
c
entral crac
k
t
he 500 nm
t
he cent
r
al
c
The
h
ave some
s
c
hemical s
t
t
etrahedral
s
i
s a dense
P
l
ow-k film
w
t
his work,
i
s
ignificant
p
F
ESEM pl
a
loads of (
a
k
; and (c) 1
BD film
w
c
rac
k
has r
e
indentatio
n
s
imilarities
t
ructures.
B
s
ilica netw
o
P
ECVD de
p
w
ith the po
r
i
t is found
p
op-in eve
n
a
ne-view i
m
a
) 7 mN: o
n
0 mN: co
m
w
ith a maxi
m
e
ached to th
n
-fracture
c
but also so
m
B
oth of th
e
o
rk structur
e
p
osited low
-
r
es created
b
that simil
a
n
t on the P-
m
ages of
n
ly plastic
d
m
plete spall
o
m
um load
o
e interface.
c
o
r
relations
m
e differe
n
e
films ar
e
e
terminate
d
-
k film, w
h
b
y remova
l
a
r to the o
b
h curve, w
h
500 nm
B
d
eformatio
n
o
ff. (d) FI
B
o
f 9 mN sh
o
[2]
for the M
S
n
ces; this
m
i
e
hybrid
m
d
by organi
c
h
ile the MS
Q
of poroge
n
b
servations
h
en indenta
t
B
D film
w
n
; (b) 8.5
m
B
cross-sect
i
o
wing no i
n
S
Q/Si and
i
ght
b
e rela
t
m
aterials c
o
c
(-CH
3
) e
n
Q
film is a
n
s added to
on the M
S
t
ion depth
i
C
w
ith the
m
m
N: film co
r
i
onal view
i
n
terfacial c
r
the BD/Si
t
ed to thei
r
o
nsist of i
n
n
ds, but the
porous spi
n
the matrix
S
Q film, t
h
i
s about 50
%
C
hapter 4
76
m
aximum
r
ner and
i
mage of
r
ack, but
systems
intrinsic
n
organic
BD film
n
-coated
[3-5]. In
h
ere is a
%
of the
Chapter 4
77
BD film thickness. The actual critical load for interfacial crack initiation is slightly
higher than the pop-in load. The pop-in during wedge indentation on the BD film,
however, is much pronounced compared to that on the MSQ film. FESEM plane-view
imaging, and FIB sectioning and imaging are performed on the indentation
impressions to relate the delamination processes and the characteristics of the P-h
curves. Similar to the findings for the MSQ film, before the pop-in event (7 mN), there
is no observable crack on the film surface (Fig.4.8(a)), and as the pop-in occurs (8.5
mN), central and corner cracks can be clearly spotted in the film (Fig.4.8(b)); this
suggests that the pop-in on the indentation P-h curve is associated with both the
central and corner cracks. Further increasing the indentation load to that above the
pop-in load (10 mN) will cause a complete delamination (Fig.4.8(c)). In addition, the
FIB sectioning at the middle of wedge indentation impression right before the
completion of pop-in (9 mN) does not show any interfacial crack, but the central crack
has obviously reached the BD/Si interface (Fig.4.8(d)). Therefore, it can be concluded
that the interfacial crack has been formed, propagated and kinked to the film surface
instantaneously at the critical indentation load slightly above the pop-in load (~10
mN), preventing any observation of the interfacial fracture process by the FIB
sectioning and imaging method. This sequence of interfacial crack initiation and
propagation processes is significantly different from that observed in the MSQ film.
During the wedge indentation on the porous MSQ film, the interfacial crack is initiated
at a lower load (3 mN), then propagates slowly with increasing load and finally kinks
to the film surface at a much greater load (9 mN). In other words, for the MSQ film,
there is a visible crack-propagation process (under FIB sectioning) before the film
around the indentation impression spalls off from the surface. However, for the BD
film, fracture occurs instantaneously with almost constant indentation load.
Chapter 4
78
These differences between the BD and the MSQ films, in terms of the crack
initiation and propagation processes, can be explained by the differences in the
chemical bonding and structure of the films due to their different fabrication methods
[5,6]. As reported by Maidenberg et al. [5], porogen remnants within the pores of the
MSQ film might generate molecular bridgings behind the crack tip, and hence a
greater driving force was needed to stretch and break these bridgings to propagate the
cracks further. It is therefore possible that due to the energy dissipation provided by
stretching of molecular bridgings, further increases of indentation load (from 3 to 9
mN) are required for the film crack and the interfacial crack propagations in the
MSQ/Si system. For the BD/Si system, however, both the film and interfacial cracks
are initiated and propagated instantaneously at approximately the same load (7.5 – 9
mN for film crack and ~10 mN for interfacial crack), which suggests the lack of
energy dissipation mechanisms that can slow down the crack-propagation process.
4.2 Mechanics of Interfacial Adhesion
The fracture and failure of thin film/substrate systems can occur in a number of
patterns, such as surface crack, channeling, substrate damage, spalling and debonding
[7,8]. To characterize the interfacial adhesion properties (e.g. interfacial energy and
interfacial strength), the interfacial cracking pattern is of particular interest. The wedge
and the conical indentation methods have been used to determine the interfacial
toughness of various thin film/substrate systems, including ZnO/Si [9],
diamond/titanium alloys [10], W/SiO
2
[11] and low-k/SiO
2
systems [12]. For the
Chapter 4
79
systems with strong interface, a significant penetration into the substrate is usually
needed to cause interfacial delamination, whereas for the systems with brittle interface,
interfacial delamination can occur as the indenter tip penetrates within the film.
Therefore, the analysis methodology to determine interfacial toughness is different for
the system with strong interface [10,13-16] and the system with brittle interface
[9,11,17,18] (Section 2.2). For the systems with brittle interfaces, de Boer and
Gerberich have followed the analysis originally developed by Marshall and co-
workers for conical indentation [9,18], and have developed the analysis for
microwedge indentation test on thin metallic lines [11,17]. In this study, i.e. the wedge
indentation test on continuous low-k films, the interfacial delamination occurs when
indentation depth is less than the film thickness; therefore, the analyses developed for
system with brittle interface should be adopted here [9,11,17,18]. However, certain
modifications on the analyses are necessary, as the delamination crack shapes
observed for these three indentation experiments are generally different: (a) for conical
indentation, it is a circular shape; (b) for microwedge indentation on thin metallic
lines, it is a rectangular shape; and (c) for wedge indentation on continuous film, the
shape of the delamination cracks is closed to an elliptical shape (Fig.4.4(d) and 4.5(d)).
The remaining of this section will therefore present the derivation of the new analysis
methodology and the crack configuration for the interfacial crack propagation during
the wedge indentations on a continuous film.
Following the interfacial fracture mechanics analysis developed by Marshall et
al. [9,18] and de Boer and Gerberich [11,17], we have generalized the expression for
the indentation induced stress in terms of the ratio of the indentation deformation
volume to the volume of the materials above the interfacial delamination crack:
Chapter 4
80
'
0
0 f
c
V
E
V
σ
=
. (4.1)
The effective film elastic modulus, E
’
f
in Eq. (4.1) is given by:
'
2(1 )
f
f
f
E
E
ν
=
−
(For Conical Indentation) (4.2a)
or
'
2
(1 )
f
f
f
E
E
ν
=
−
(For Wedge Indentation) (4.2b)
In Eqs. (4.1) and (4.2), E
f
is the film modulus, V
0
is the plastic indentation volume, V
c
is the volume of thin film above the interfacial crack, and ν
f
is the Poisson’s ratio of
the film (assumed the value to be 0.34). Since the wedge indenter only penetrates into
the film, the interfacial delamination is therefore caused by the volumetric strain of the
thin film (V
0
/V
c
).
Eq.(4.1) can be easily converted back to the formula derived by Marshall and
co-workers [9,18], by taking V
0
as the deformation volume by a conical shaped
indenter and interfacial crack area, A
c
as circular shape. Likewise, Eq.(4.1) can also be
converted back to the formula derived by de Boer and Gerberich [11,17], by taking V
0
as the deformation volume by a wedge shaped indenter and A
c
as rectangular shape
(Appendix B). It should be noticed that the two types of indenter tips (conical and
Chapter 4
81
wedge) create different stress-strain fields during indentation. Microwedge indentation
created a plane strain condition, while conical indentation created a plane stress
condition. Despite these differences, the functional form of the indentation induced
stress in the films is the same for both cases.
Even though the MSQ and BD films in our study are not fabricated in a fine-
line shape, the analysis proposed for microwedge indentation method [11,17] can still
be applicable. When a wedge-tip with a very long length is indented on a continuous
film, the wedge indentation can induce a plane-strain condition at the central portion
of the impression, but at the ends of the wedge-tip’s length, the stress-strain condition
is non plane-strain. The extent of the plane strain region is dependent on the film’s
thickness and the wedge length, and can be estimated by measuring the curvature of
crack front (Section 4.3). When the ratio between wedge length and film’s thickness,
l/t ratio is greater than 25, the crack front curvature is found to be extremely straight,
i.e. the plane strain region has dominated most part of the crack front. In this case, the
calculation scheme proposed for the plane strain condition, as in the analysis of
microwedge indentation [11,17], can be used without much error. However, when l/t
ratio is less than 25, the shape of delamination will change from rectangular shape to
elliptical shape; and consequently, there might be some errors due to the emergence of
the non plane-strain regions along the length of wedge indenter. The effects of l/t ratio
on the interfacial toughness measurement will be discussed in Section 4.4.3.
Chapter 4
82
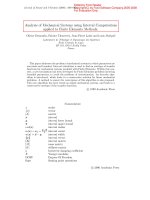
Fig. 4.9: Configuration of cracks during the steady state propagation of interfacial
crack [19]. Solid-line shows the elliptical-shape delamination. Normal T
n
and shear
traction T
s
are acting on the crack front, while there is no contact or no traction at the
corner crack surface. Dashed line shows the displacement of the film above the
interfacial crack, δ, due to the indentation induced stress. Bulge-out at the corner crack
might happen during the indentation, causing a minor error in the calculation [1].
From the crack patterns observed in the FESEM images (Figs.4.4(d) and
4.5(d)) and the schematic illustration in Fig.4.9, it can be deduced that if we consider
the real shape of the interfacial crack, using Eq.(4.1), the contribution of the non
plane-strain region can be taken into consideration. In the initial study, we have
assumed the shape of the interfacial crack area as an elliptical shape [1]. Hence, the
interfacial crack area and the volume of the thin film above the interfacial crack are
given as
''
c
Aab
π
= , (4.3a)
and
Chapter 4
83
cc
VAt= , (4.3b)
where 2a’ is the short axis length, 2b’ is the long axis length and t is the film thickness
(Fig.4.4(d)). In the later study (Section 4.4.3), the Scion image analyzing software is
used to accurately measure the interfacial crack area from the plane view image of the
delamination crack.
As can be seen in Fig. 4.9, there are normal and shear tractions acting at the
interfacial crack front, while at the sidewall of the corner crack, there is no contact
between the remaining film and the film above the crack. When the film above the
interfacial crack (shown schematically by the full line in Fig.4.9) is subjected to
indentation induced stress, it will be displaced in the X
1
direction (shown by the
dashed line in Fig.4.9). When the corner crack angle, θ, is equal to zero, the shape of
the interfacial crack area is the same as that in the analysis of de Boer and Gerberich
[11,17], which is rectangular shaped, and the crack area is determined by multiplying
the interfacial crack length and the wedge tip length. When θ is non-zero, the average
strain or volumetric strain for the film above the interfacial crack is given by the
volume ratio V
0
/V
c
, with a small error at the sidewall of the corner crack possibly due
to the plastic deformation at the corner crack (as shown by the bulge-out in Fig.4.9). A
numerical study will be needed to further understand this error and to match the crack
shape between experimental and numerical studies [19,20].
By assuming that the material in the plastic zone around the wedge tip is
incompressible and the volume displaced is conservative, the indentation volume is
given as
Chapter 4
84
2
0
1
tan
2
p
Vtllh
δ
φ
==
. (4.4)
For simplification, it is assumed that the indentation induced stress is the only stress
causing the interfacial delamination. The effects of residual stress are ignored in this
analysis. For the case of no buckling, the interfacial toughness Γ
i
can be given as
22
0
(1 )
2
f
ic
f
t
G
E
ν
σ
−
Γ= = . (4.5)
In Eqs.(4.4) and (4.5), δ is the displacement of the film above the interfacial crack in
the X
1
direction due to the indentation induced stress (Fig.4.9), h
p
is the indentation
plastic depth, l is the length of the wedge tip, t is the thickness of the thin film, and 2
φ
is the inclination angle of the wedge indenter tip. The indentation plastic depth h
p
can
be determined by linear-fitting the top 30% of the indentation unloading curve and
then extrapolating to the depth axis.
There are three possible buckling-situations when the interfacial crack
propagates under the indentation induced stress. The film above the interfacial crack
may show (a) no buckling, (b) single-buckling, or (c) double-buckling [9,11,17,18]. It
is dependent on the magnitudes of the indentation induced stress and the critical
buckling stress
*
of the film. If the indentation induced stress reaches the critical
buckling stress, the film above the interfacial crack is expected to buckle. Strain
energy is released when buckling happens [9,11,17,18]. Thus, to quantify the work of
*
Critical buckling stress is the critical value of in-plane compressive stress, above
which buckling could occurs.
Chapter 4
85
fracture or interfacial adhesion, the strain energy associated with buckling has to be
taken into consideration. As reported by Moon et al. [21], Thouless et al. [22] and
Hutchinson et al. [23] the critical buckling stress for the straight sided buckles in the
plane strain condition is
2
2
2
12 1 '
f
c
f
E
t
a
π
σ
ν
⎛⎞
⎛⎞
=
⎜⎟
⎜⎟
⎜⎟
−
⎝⎠
⎝⎠
. (4.6)
For a clamped circular-plate in the plane stress condition, the critical buckling stress is
1.488σ
c
, which is around 50% higher than that for the straight-sided buckles
(Eq.(4.6)). For the crack configuration in Fig.4.9, which is approximately elliptical
shape, it can be predicted that the critical buckling stress should be somewhat between
that of the circular and the straight sided buckles. Section 4.3 presents an appropriate
way to estimate the critical buckling stress for the elliptical delamination shapes in the
BD/Si systems. Nevertheless, in the initial study, the critical buckling stress has been
approximated according to the shape of the crack front. For instance, the critical
buckling stress for straight sided buckles will be used if the crack front is parallel to
the wedge indentation impression, while for the curved crack front, critical buckling
stress for circular buckles will be used. Taking the post-buckling slope to be zero, the
G
c
is given by de Boer and Gerberich [17] as
()
2
2
0
(1 )
43
2
f
ic c c
f
t
G
E
ν
σσ σ
−
⎡⎤
Γ= = −
⎢⎥
⎣⎦
, (4.7)
where σ
c
is the critical buckling stress for either straight sided or circular buckles.
Chapter 4
86
Fig. 4.10: Formation of an edge crack on the interface of a thin film/substrate structure
and the conventions for interfacial fracture mechanics analysis (Fig.57 of ref. [7]).
Fig. 4.11: Conventions for interfacial fracture mechanics analysis (Fig.5 of ref. [7]).
The approach given by Hutchinson and Suo [7] is implemented to estimate the
phase angle of the steady state crack propagation in the low-k/Si interface. The phase
angle ψ is given by
ωω
ωω
ψ
cossin12
sincos12
tan
NtM
NtM
Δ+−
Δ+
=
, (4.8)
Chapter 4
87
parameters (α and β) and the relative height η. In determining these three parameters:
α, β and η, the conventions in Fig.4.11 are used. Firstly, the low-k films are extremely
compliant as compared to the Si substrate. Therefore, α is close to −1. Subsequently,
for a plane strain condition, β = α /4 when ν
1
= ν
2
= 1/3. Finally, the film thickness
(400 nm) is extremely thin as compared to the substrate thickness (1.5 mm); thus, η=0.
These values of α, β and η give ω =56° by referring to Fig.4.12.
Fig. 4.12: Phase factor, ω(α, β) in Eq. 4.8 (Fig.58 of ref. [7]).
Prior to buckling, M = 0; thus, ψ = ω = 56°. de Boer and Gerberich [17] have
shown that phase angle would change when buckling occurs. In the case of low-k
films, however, due to the constraints at the two ends of the wedge indentation and the
small residual tensile stress (about 10 to 20MPa), the extent of buckling should be
limited. Hence, the total moment/unit length ∑M is closed to zero. Therefore, it is
highly possible that the changes of the phase angle are insignificant. ψ will probably
remain at 56° until the crack starts to kink into the film. On the other hand, for thin
films with high compressive residual stress, buckling could occur when the
superimposed of indentation induced stress and residual stress is greater than the
Chapter 4
88
critical buckling stress. Huang et al. have calculated the phase angle as a function of
the delamination crack radius, presuming that buckling occurs during an axisymmetric
indentation induced delamination [24]. For the wedge indentation on a continuous
film, finite element simulation
*
will be needed to determine the changes of phase angle
angle due to film buckling [25], and the effects of phase angle to the interfacial
toughness should be considered in the future FEM simulations.
4.3 Curvature of the Crack Front
From the initial research works, it was found that the interfacial crack in
thinner film has a straighter front, whereas the crack in thicker film has a curved crack
front. For instance, when a 120° wedge indenter tip was indented on 200 nm and 500
nm BD films, the interfacial crack front was found to be parallel to the length axis of
the wedge indentation impression on the 200 nm BD film, and a curved interfacial
crack front was found for the wedge indentation on the 500 nm BD film (Fig.4.13) [1].
These changes in the delamination crack shape due to the different film thickness have
led to the discussion on the dependence of critical buckling stress on the film
thickness. It is known that the critical buckling stress for a circular buckle is about
50% higher than that for a straight buckle [9,11,17,18]; therefore, in order to determine
the critical buckling stress for different film thickness, the curvature of the
delamination crack front has to be measured. After determining the critical buckling
stresses for the films with different thickness, one can then verify the delamination
mode, i.e. with or without buckling, by comparing the critical buckling stress with the
*
Courtesy of Mr. Chen Lei, PhD student of Associate Prof. Dr. Zeng Kaiyang


![Báo cáo khoa học: Characterization of the bioactive conformation of the C-terminal tripeptide Gly-Leu-Met-NH2 of substance P using [3-prolinoleucine10]SP analogues pdf](https://media.store123doc.com/images/document/14/rc/ty/medium_tyq1394220086.jpg)