Characterization of interfacial mechanical properties using wedge indentation method 8
Bạn đang xem bản rút gọn của tài liệu. Xem và tải ngay bản đầy đủ của tài liệu tại đây (4.4 MB, 39 trang )
Chapter 5
131
The interfacial adhesion energy for the same 500 nm thickness BD film
obtained by using the interfacial energy-strength contour (Γ
0
=5.58-8.49 J/m
2
) is
slightly higher than the interfacial toughness determined in Section 4.4.3 using the
experimental method (Γ
0
=5.40±0.90 J/m
2
). The reasons for the differences will be
discussed together with the results on the MSQ film in the next section.
5.2.2 MSQ film on Si Substrate
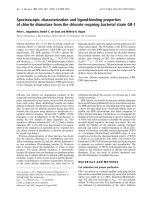
Fig. 5.4: The MSQ/Si system’s interfacial energy-strength contour for 90° and 120°
wedge indentation showing the intersection of P
c
90
/(σ
yf
Δ
o
) = 4.52 – 6.78µm and
P
c
120
/(σ
yf
Δ
o
) = 7.24 – 11.31µm. Full lines represent the contour for P
c
90
/(σ
yf
Δ
o
), while
dashed lines represent that for P
c
120
/(σ
yf
Δ
o
) [1].
Chapter 5
132
Fig.5.4 shows the interfacial energy-strength contour for MSQ/Si system.
According to the fracture-indentation correlation studies on the MSQ/Si system, pop-
in loads for 90° and 120° wedge indentations are 2mN and 3.25mN, respectively; and
the interfacial delamination occurred at 3mN and 5mN for the 90° and 120° wedge
indentations, respectively. By assuming the later values (3mN and 5mN) are the
critical indentation loads, P
c
90
/(σ
yf
Δ
0
) and P
c
120
/(σ
yf
Δ
0
) for MSQ/Si system
(
σ
yf
=0.45GPa) can be calculated as 6.78µm and 11.31µm, respectively. From the
intersection of these two curves (P
c
90
/(σ
yf
Δ
0
)=6.78µm and P
c
120
/(σ
yf
Δ
0
) =11.31µm) in
the interfacial energy – strength contour, it can be found that the interfacial energy, Γ
0
is 2.61J/m
2
and interfacial strength, σ
strength
, is 0.29GPa. These two values can be
considered as the higher-bounds for the interfacial properties. On the other hand, the
values of the lower-bounds are found as Γ
0
= 2.13J/m
2
and σ
strength
= 0.24GPa in a
similar way using the pop-in loads (2mN and 3.25mN).
The interfacial energy for MSQ/Si system determined using the experimental
method are 1.89±0.28 J/m
2
and 1.92±0.08 J/m
2
for 90° and 120° wedge indentation,
respectively (Section 4.4.2). The BD/Si and the MSQ/Si systems’ interfacial energies
determined with the forward-reverse calculation scheme in this section are also
slightly higher than the results obtained with the experimental method (Section 4.4).
Nevertheless, the two independent methods (experimental method and forward-reverse
method) have confirmed the validity of each other.
One possible reason that the values of Γ
0
determined from the contour-plots are
higher than those determined from the experimental method is the discrepancy
between the stress-strain condition reproduced by a FEM simulation and the actual
Chapter 5
133
condition in an experiment. In the simulation, a 2D plane-strain condition is assumed
since the wedge is infinitely long. In the experiments, however, the wedge indenter
length (approximately 4 μm) may not be long enough to achieve a complete plane
strain condition, especially at the two ends of the wedge tips. The film cracking at the
ends of the wedge tip may alter the strain conditions and introduce some errors in the
calculations. Therefore, if a longer wedge tip is used, the disagreement between
experiment and simulation in the stress-strain conditions may be reduced and the
interfacial adhesion results could be more accurate.
The interfacial energy and strength values determined from the contour-plots
are within a certain range for both the BD/Si and the MSQ/Si systems (i.e. Γ
0
=5.58-
8.49 J/m
2
and σ
strength
=0.71-0.78 GPa, for the BD/Si system; and Γ
0
=2.13-2.61 J/m
2
and σ
strength
=0.24-0.29 GPa, for the MSQ/Si system). It is intriguing that if one takes
the middle values of these ranges as the interfacial energy (i.e.,
Γ
0,m
=7.04 J/m
2
for the
BD/Si system and
Γ
0,m
=2.37 J/m
2
for the MSQ/Si system), then the values of
interfacial energy are approximately 25% to 30% higher than the values determined by
the analysis and experimental methodology in Section 4.4. These results suggest that a
constant may be needed for the equation for indentation induced stress (Eq.(4.1)) to
accommodate for the plastic energy dissipation at the side walls of corner cracks
(shown by bulge-out in Fig.4.9) but this potentially important improvement to the
previous analysis still requires further study.
Despite the potential errors discussed above, the interfacial adhesion properties
determined in this work are quite similar to the previously obtained experimental
Chapter 5
134
values. The forward-reverse analysis proposed in this work is useful for the
determination of the interfacial mechanical properties.
5.3 Conclusions
From the comparison of the simulation and experimentally obtained P-h curves
before the onset of delamination, the yield strength and the strain hardening
exponential values of the BD and MSQ film have been estimated from the FEM
simulations and the wedge indentation experiments. The elastic-plastic properties of
these two low-k films are then implemented to the FEM simulations of the wedge
indentation induced delamination, whereby the interfacial energy-strength contours are
developed. Using these contour plots and the experimentally-determined critical
indentation loads for delamination (P
c
90
and P
c
120
), the interfacial energy and the
interfacial strength of BD/Si and MSQ/Si system are successfully determined. In
conclusion, this study has provided a numerical solution to the wedge indentation
induced delamination problem and the results are comparable to what were obtained in
the previous experimental works (Section 4.4). Although the numerical results are not
100% matched with the experimental results, these two independent results still
provide sufficient supports for each others. The new forward-reverse analysis scheme
is capable to measure interfacial energy and interfacial strength of the low-k thin films.
Chapter 5
135
References:
1. L. Chen, K.B. Yeap, K.Y. Zeng and G.R. Liu, Phil. Mag., 89, p.1395-1413,
(2009).
2. K.L. Johnson, J. Mech. Phys. Solids, 18, p.115-126, (1970).
3. V. Tvergaard and J.W. Hutchinson, Phil. Mag. A, 70, p.641-656, (1994).
4. V. Tvergaard and J.W. Hutchinson, Int. J. Solid. Struct., 33, p.3297-3308,
(1996).
136
Chapter 6: Wedge Indentation Studies of Low-k Films at Inert, Water and
Ambient Environments
As discussed earlier (Section 1.2), the introduction of low-k films are essential
to reduce the RC delay in a microelectronic device. One of the promising low-k
candidates is hybrid organic-inorganic glass materials, such as BD and MSQ films.
Similar to other silica-based materials, these hybrid low-k materials are also
susceptible to time-dependent fracture (also known as stress corrosion cracking, slow
crack growth or subcritical crack growth). During the fabrication processes, such as
chemical-mechanical-polishing (CMP) and chemical etching, the low-k dielectrics are
subjected to different levels of mechanical stresses and contacted with various reactive
species. After the fabrication processes are completed, microelectronic devices are
usually sealed; in addition, there are various device operating conditions and the
devices may be subjected to temperature-change induced thermal stresses and possible
mechanical stresses. Therefore it is important to study crack growth phenomena in
different environments such as inert, water and ambient conditions. In general, the
experimental techniques to characterize the time-dependent fracture properties of thin
films include bending tests [1-3] and indentation tests [4].
Four-point bending [1,5] and double-cantilever-cleavage techniques [2,3] have
been widely used to characterize the time-dependent crack growth in various low-k
systems. However, the bending techniques are accompanied by a complicated sample
preparation procedure and a long preparation time. In order to characterize the time-
dependent fracture properties in terms of a strain energy released rate – crack velocity
Chapter 6
137
(G-v) relation, which consists of reaction-controlled regime, diffusion-controlled
regime and spontaneous fracture regime [5], one must obtain at least 10 – 20 data
points, and each data point requires about 30 sets of tests. Therefore, tremendous
amount of bending samples are needed to fully-characterize the time-dependent
fracture properties of a certain low-k system, which may be subjected to a wide range
of environmental conditions.
On the other hand, indentation technique requires only a small piece of as-
deposited thin film sample for a complete time-dependent properties characterization.
Cook and Liniger [4] developed an experimental methods using Vickers indentation to
characterize these properties of the low-k thin film. They have measured the film
cracks extension with time from the impression corners, but the possibility of
interfacial cracks formation were not discussed [4]. In Section 4.1.1, the cross-
sectional images of Berkovich indentation impressions on MSQ/Si sample
(Fig.4.6(a)), which are obtained from focused-ion-beam (FIB) cutting of the
impressions, have shown that the interfacial crack may form during the indentations
with Berkovich tips. Therefore, it can be anticipated that the Vickers indentation on
low-k thin film may also result in the interfacial cracks. When the sample is exposed to
water-contained environment, not only the film cracks could propagate, the interfacial
cracks might also propagate.
In the Chapter 1 of this thesis, a simple analysis and a straight forward
experimental methodology to characterize interfacial properties by wedge indentation
technique are developed and applied to low-k/Si systems to determine the interfacial
toughness. The wedge indentation imposes a plane-strain condition and has a great
Chapter 6
138
interfacial crack driving force to induce the interfacial delamination on the low-k/Si
systems. In addition, the interfacial toughness of the MSQ/Si and the BD/Si systems
measured using the wedge indentation technique are confirmed to be accurate and
repeatable [6,7]. On the other hand, the time-dependent fracture behaviors for the low-
k/Si systems are also found during the wedge indentation experiments. This behavior
is therefore studied in details in this chapter. Instead of using normal indentation
procedures, the low-k/Si systems are indented with the wedge indenter tip and hold at
the maximum load for a period of time, allowing the time-dependent fracture to occur.
The resulting indentation data (load, loading rate, penetration depth and holding time)
are analyzed in Section 6.1 and 6.2 to determine (i) the minimum load before the time-
dependent fracture starts (defined as threshold load); (ii) the changes of the onset of
time-dependent fracture when different loading rates are applied; and (iii) the total
time needed from film cracking to interfacial delamination (defined as time-to-failure).
The results from these experiments depend on the degree of water exposure of a
sample. In order to vary the water exposure levels, three different test environments
are used (ambient, watered and inert environments). The influence of the test
environments on the cracks initiation and propagation are studied by comparing the
penetration depth – holding time (h-t) curves obtained from different test
environments; this is because when the indentation load is fixed for a period of time,
massive penetration of the indenter can be related to various fracture events at film and
interface (Section 6.3). The feasible water diffusion paths and fracture mechanisms for
BD/Si system, when it is subjected to wedge indentations at the three test
environments, are also discussed.
Chapter 6
139
6.1 Time-Dependent Fracture during Wedge Indentation Tests
This section presents two indentation tests (load-holding test and varying-
loading-rates test) developed to study the time-dependent fracture behavior of low-k/Si
systems. In the load-holding test, a maximum load, P
max
is maintained in the holding
segment, and changes of penetration depth with the holding time are recorded;
whereas in the varying-loading-rates test, different loading rates, dP/dt, are applied,
and the corresponding fracture-onset loads, P
onset
, are determined. In Section 4.1.2, it is
found that there are significant differences in the fracture resistance for BD/Si and
MSQ/Si systems. In the MSQ/Si system, there is an extra plastic energy dissipation
mechanism possibly due to the stretching of molecular bridgings behind the crack tip,
but this mechanism is unavailable in the plasma enhanced chemical vapor deposited
BD/Si system. The molecular bridgings were also anticipated to provide a stronger
resistant toward time-dependent crack growth [8], therefore it would be interesting to
first compare the two low-k systems based on the load-holding tests and the varying-
loading-rate tests that are conducted at ambient environment.
Chapter 6
140
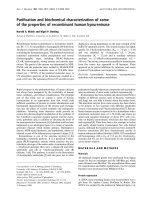
Fig. 6.1: The load-holding test results for the BD/Si system at ambient environment:
(a) load-penetration depth (P-h) curves for different maximum loads at holding, P
max
;
(b) penetration depth-holding time (h-t) curves for different P
max
, showing the
consistent S-shaped curves, consisting of three stages [9].
In the load-holding and the varying-loading-rates tests, the film cracking and
the interfacial delamination that occur below the critical load, P
critical
(i.e. the
indentation load associated with the onset of fracture in a fast loading-unloading
condition) are defined as the time-dependent fracture. For the BD/Si system, during
the fast loading condition, when the indentation load reaches to P
critical
= 7.5mN, there
is a pronounced pop-in at the indentation P-h curve, i.e., a sudden displacement of the
Chapter 6
141
indenter at an approximately constant load. Fig.6.1(a) shows the indentation P-h
curves for a series of load-holding tests at the different P
max
values (3.5 – 7 mN, which
are below the P
critical
= 7.5mN) for the BD/Si system. As the P
max
is maintained for a
period of time, a significant increase of the penetration depth is clearly seen in the
holding segment (up to ∼250 nm) (Fig.6.1(a)). When the penetration depth is plotted
against holding time, i.e. the h-t curves, in general, it follows a consistent S-shaped
curve for P
max
=5mN, 6mN and 7mN (Fig.6.1(b)), which can be further divided into
three main stages and each of the stages can be related to a fracture process. The
details about the h-t curve for BD/Si system are discussed in Section 6.3.
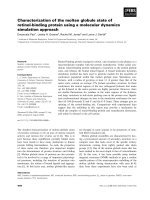
On the other hand, the MSQ/Si system has different penetration-time
characteristics in the load-holding tests. Fig.6.2 depicts the h-t curves for various P
max
values (1.4 - 7 mN), and it is obviously resembling a simple creep-like curves
consisted of two stages: primary and secondary stages. The primary stage shows that
the penetration depth increases in such a way that the penetration rate (dh/dt) decreases
with the holding time; whereas in the secondary stage, the penetration depth increases
with time in an approximately constant displacement rate, dh/dt. However, as
confirmed by FESEM and FIB images of the wedge impressions, the increases of
penetration depth in the holding segment are less than ~20nm and are restricted to the
deformation of the film.
Chapter 6
142
Fig. 6.2: The load-holding test results for the MSQ/Si system at ambient environment,
showing the penetration depth - holding time (h-t) curves for different maximum
loads, P
max
that assemble simple creep-like curves [9].
As discussed in Section 4.1.1, in a fast loading-unloading test on the MSQ/Si
system, film crack initiation occurred at the pop-in load (2mN) and interfacial crack
propagation occurred as the indentation load was increased from 3mN to 9mN. In
contrast to the load-holding test results of BD/Si system, holding at a specific load
below the pop-in load (P
max
= 1.4mN) for more than 20,000s does not lead to the
initiation of film or interfacial crack in the MSQ/Si system. Furthermore, when P
max
is
holding between 3mN and 7mN, the interfacial crack does not propagate and kink to
the film surface; thus, the complete film delamination does not occur in the MSQ/Si
system during load-holding tests.
Chapter 6
143
Fig. 6.3: The load-holding test results for the BD/Si systems with two different film
thickness (300 nm and 500 nm BD films) at ambient environment with indentation
load of 5mN. The penetration depth is normalized by film thickness [9].
Furthermore, in order to verify whether or not the different time-dependent
deformation behaviors in BD and MSQ films are related to the film thickness, the
load-holding tests are also conducted on a 300 nm thick BD film. Fig.6.3 shows that
the two BD films (300 nm and 500 nm thickness) have a similar time-dependent crack
growth behavior, i.e. three-stages on the h-t curve and a complete film spall-off from
the substrate after a long holding time (Section 6.3). Therefore, the difference in film
thickness may be eliminated from the possible causes of the discrepancy between the
BD/Si and the MSQ/Si systems in their load-holding tests results.
Chapter 6
144
Fig. 6.4: The varying-loading-rates test results for the MSQ/Si system at ambient
environment, showing the load-penetration (P-h) curves for different loading rates,
dP/dt [9].
The second wedge indentation test, i.e. varying-loading-rates test, at ambient
environment for the two low-k/Si systems indicates that: (a) for the MSQ/Si system, as
the loading rates (dP/dt) decrease, the pop-in loads remain at a constant value (2mN)
and the characteristics of the indentation P-h curves do not change much (Fig.6.4); and
(b) for BD/Si system, as the loading rates decrease from 242.15µN/s to 5.43µN/s, the
P-h curves are similar before the onset of fracture, but the fracture-onset load, P
onset
,
decreases from P
critical
at 7.5mN to a threshold load, P
threshold
at 3.14mN (Fig.6.5(a)).
Further analysis of the test data for the BD/Si system is presented in Section 6.2. These
results show that the crack growth in BD/Si system is dependent on time, whereas the
crack growth in MSQ/Si system is not. Based on the results from the load-holding tests
and the varying-loading-rates tests, it can be concluded that the BD/Si system is
susceptible to time-dependent crack growth both within the film and at the interface.
Chapter 6
145
Fig. 6.5: The varying-loading-rates test results for the BD/Si system: (a) load-
penetration (P-h) curves for different loading rates, dP/dt, and (b) the plot of fracture-
onset load, P
onset
against loading rate, dP/dt [9].
To rationalize the time-dependent crack growth characteristics of the BD/Si
and the MSQ/Si systems during the wedge indentation tests, the understanding of the
differences in their chemical structural is crucial. Both BD and MSQ films are hybrid
Chapter 6
146
organic-inorganic materials with siloxane network structure that are terminated by
methyl group (–CH
3
), but the two low-k films behave different significantly in the
load-holding and varying-loading-rates tests. Recent research works have shown that,
in molecular-level tailoring of silica-based dielectric films, such as MSQ film,
molecular bridgings might be formed across the fracture surfaces, and this could
improve the interfacial toughness to more than 20J/m
2
[8,10,11]. Due to the formation
of molecular bridgings behind the crack tip, a greater driving force may be required to
stretch and break these molecular bridgings. The polymeric molecular bridgings in the
pores inside the MSQ film must be relatively unaffected by environments as compared
to the siloxane bonds, so that the crack growth is independent of the time for MSQ/Si
system, but this is not for the case of BD/Si system. As the occurrence of time-
dependent fracture phenomenon at ambient environment are confirmed in the BD/Si
system, load-holding and varying-loading-rates tests are further performed at watered
and inert environments. In Sections 6.2 – 6.3, a qualitative analysis for two wedge
indentation tests and the fracture mechanism under the three test environments will be
discussed.
Chapter 6
147
6.2 Lifetime and Loading-Rate Analysis
Based on the experimental observations of the load-holding and varying-
loading-rates tests on BD/Si system, the time-dependent fracture behaviors are
described by the following parameters and relationships: (a) the threshold load
(P
threshold
), (b) the relationship between the fracture-onset load and the loading rate
(P
onset
- dP/dt), and (c) the relationship between the time-to-failure and the maximum
load (t
f
- P
max
). During the load-holding test at the ambient environment, it is found
that holding at P
max
= 3mN for 20,000s does not lead to any crack formation in the
film; this suggests that there is a threshold load, P
threshold
for time-dependent fracture to
initiate. When a very slow loading rate (~5µN/s) is applied in the varying-loading-
rates test, P
onset
is found to be a constant equals to P
threshold
; the value of P
threshold
for
both ambient and inert (sample surface covered by Si oil) environments are therefore
determined to be 3.14mN, while the value of P
threshold
for watered environment (sample
surface covered by water) is 2.82mN. On the other hand, when a very fast loading rate
(~200µN/s) is applied, P
onset
is found to be a constant equals to P
critical
. Due to the
decrease of loading rate from 200µN/s to 5µN/s, P
onset
decreases from P
critical
to
P
threshold
by 58% for ambient and inert environments, and by 62% for watered
environment. For the loading rate in between 5µN/s and 200µN/s, linear relationships
between P
onset
and the loading rate, dP/dt, can be found in all the test environments
(Fig.6.5(b)), as given by
onset threshold
dP
PC P
dt
=+
, (6.1)
Chapter 6
148
where C is the slope of the linear relation. For ambient and inert environments the
linear functions are similar, but for the same loading rate, the time-dependent fracture
occurs at much lower P
onset
in watered environment. The time-to-failure, based on the
duration of time needed for indentation load to reach the P
onset
, is related to the slope,
C, by
/
threshold
f
P
tC
dP dt
=+
. (6.2)
Since C and P
threshold
are constants, t
f
is inversely proportional to the loading rate,
dP/dt.
In the load-holding test, the maximum load (P
max
) is the independent variable
varied from 3.5mN to 7mN, while the total holding time required for complete
interfacial delamination, time-to-failure (t
f
), is the dependent variable. Because the
entire time-dependent fracture process occurs in the holding segment of load-holding
test, P
max
is equivalent to P
onset
. Following these definitions, the relationship between t
f
and P
max
can be determined for all the test environments. As can be seen in Fig.6.6, t
f
decreases with the increasing of P
max
in an approximately exponential relation. At a
lower P
max
, the values of t
f
for ambient and inert conditions are different, but they
converge to the same minimum value of time-to-failure (t
min
), as P
max
is increased to
P
critical
. For ambient environment, t
f
increases when P
max
< 4.5 mN, whereas for inert
environment, t
f
increases only when P
max
< 5.5 mN; this indicates that a higher
indentation load is needed at the inert environment. On the other hand, when the load-
holding test is conducted on the water-covered BD film surface (watered
Chapter 6
149
environment), the value of t
f
is at least an order of magnitude shorter than that for
ambient and inert environments; this indicates that the time-dependent crack growth
can be significantly enhanced by water molecules. For example, at P
max
= 3.5mN, the
t
f
for inert environment and ambient environment are 2752 ± 1023s and 3088 ± 602s,
respectively; whereas the t
f
for watered environment is only 187 ± 67s.
Fig. 6.6: The relationship between the time-to-failure, t
f
and the maximum load, P
max
for the BD/Si system at ambient, inert and watered environments [9].
The crack lengths measured from FESEM plan-view images are approximately
the same at different fracture-onset-load, P
onset
during the load-holding tests; hence,
the invert time-to-failure, 1/t
f
should be proportional to crack velocity. In general, the
fracture-onset-load is determined by both film properties and interfacial properties
[12,13]. Hence, the value of P
onset
should be a function of these properties. In this
Chapter 6
150
work, when plotting 1/t
f
against P
onset
(Fig.6.7), it is found that the crack growths
increase significantly with P
onset
at lower loads; and at approximately P
onset
= 4mN, the
crack growths slow down and level off for all three test conditions. These observations
are similar with the reaction-controlled and the diffusion-controlled regimes in the
strain energy released rate - crack velocity (G - v) relation, which suggests that the 1/t
f
vs P
onset
should be related to the G - v relation. Because the time-dependent crack
growth is generally characterized in terms of the (G - v) relation [1-5], to determine the
G - v relation from the wedge indentation, more works are therefore needed to
determine the dependence of G on P
onset
for wedge indentations.
Fig. 6.7: The invert time-to-failure, 1/t
f
vs the fracture-onset-load, P
onset
[9].
Chapter 6
151
6.3 Influences of Test Environments on Fracture Processes
Fig. 6.8: At stage 2C of the penetration depth–holding time (h–t) curve, film crack
connects with interfacial crack in a certain angle, α [9].
Although the h-t curve for BD/Si system has a general S-shape, it can be
further divided into three sub-stages, namely stage 1, stage 2 and stage 3 (Fig.6.1(b)).
Stage 2 can also be further divided into three sub-stages based on the slope of the
curves (stage 2A, stage 2B and stage 2C). This clarification separates the curves into
several linear stages; each stage can be associated with certain fracture events. Before
addressing the influences of the test environments, the associated fracture process for
each stage has to be confirmed by the FESEM plane-view images and the FIB cross-
sectional images of the indentation impressions, which are obtained from the
indentations held for a specific period of time and unloaded at different stages. From
the plane-view images of the wedge impressions, it is found that: (a) at stage 1: only
plastic deformation of the film and no film crack are observed; (b) at stage 2: the film
crack is initiated and propagated further; and (c) at stage 3: the film spalls and results
Chapter 6
152
in a complete interfacial delamination. The FIB cross-sectional image further reveals
that the interfacial cracking occurs at stage 2C (Fig.6.8), prior to stage 2C the interface
is still intact. It is therefore concluded that film crack initiation and propagation occur
at stage 2A and 2B respectively, and stage 2C is dominated by interfacial crack
propagation. The slope of the h–t curve (displacement rate) and time of each stage
can be then related with their respective fracture process.
Table 6.1: The slopes and time for the stages of h-t curve of holding test done on
BD/Si system at (a) ambient environment, (b) inert environment, and (c) watered
environment [9]. Note: All the data above are averaged from 40 sets of load-holding
tests with P
max
= 6mN, or ε = 0.8. The errors are standard deviations of the data.
Experiment Parameters
Test Environments
Ambient Inert Watered
Time-to-Failure, t
f
(s) 315.52 ± 68.69 329.00 ± 61.90 38.24 ± 8.43
Time of Stage 1, t
1
(s) 137.74 ± 10.61 140.57 ± 14.27 12.01 ± 2.69
Slope of Stage 1,
S
1
(×10
-5
µm/s)
8.88 ± 0.99 6.18 ± 0.94 30.60 ± 13.93
Time of Stage 2,
t
2
(s)
t
2A
54.21 ± 12.54 52.50 ± 6.78 12.59 ± 2.17
t
2B
40.26 ± 13.53 53.18 ± 18.59 6.15 ± 1.87
t
2C
84.15 ± 65.05 78.01 ± 72.34 8.48 ± 4.22
Slope of Stage 2,
S
2
(×10
-4
µm/s)
S
2A
6.57 ± 1.82 7.93 ± 1.22 41.16 ± 9.35
S
2B
42.41 ± 15.48 28.65 ± 10.56 165.89 ± 58.82
S
2C
2.76 ± 1.73 3.04 ± 1.09 44.34 ± 22.04
The influences of test environments on the fracture processes during wedge
indentation are studied by comparing the h–t curves obtained in three test
Chapter 6
153
environments in terms of the slope of the curve and time of each stage. Table 6.1
summarizes the slopes of the curves and the time durations of the each stage obtained
from the load-holding tests at P
max
= 6mN under three different test environments. It is
found that wetting the BD film surface with water has significantly accelerated the
crack growths in both film and interface during the wedge indentation, which is
indicated by: (a) the slopes of the curves at stage 1 and 2 (S
1
, S
2A
, S
2B
and S
2C
) of the
watered tests are at least one order of magnitude higher than those of the ambient and
the inert tests; and (b) the time-to-failure (t
f
) and time durations at stage 1 and 2 (t
1
,
t
2A
, t
2B
and t
2C
) of the tests at the watered environment are at least one order of
magnitude shorter than those of the tests at the ambient and the inert environments.
According to the studies by Guyer et al. [14] and Lin et al. [15], at room temperature,
bulk diffusions of water molecules are difficult without external pressure in highly
hydrophobic thin films, such as the BD and the MSQ films (hybrid organic-inorganic
silica-based low-k thin film); but the film/substrate interfaces are possible diffusion
paths for water molecules. When wedge indentation is conducted on the BD/Si system,
the film is deformed first, followed by the formation of film cracks then interfacial
crack. If a large localized pressure on the water molecules (watered test environment)
exists during the film deformation, the water molecules may be able to diffuse into the
hydrophobic film before the film cracks, resulting in the higher S
1
and S
2A
values, and
shorter time durations, t
1
and t
2A
. When the film crack forms, water molecules are
diffused into the film cracks. It is also possible that water molecules within the film
cracks may be later diffused into the interfacial crack and enhanced the interfacial
crack propagation, leading to higher S
2B
and S
2C
values and shorter time durations of
t
2B
and t
2C
.
Chapter 6
154
On the other hand, for ambient and inert tests, the slopes of the curves and
times for each stage are similar (different by less than 10%), except for the slope and
time at stage 2B (S
2B
and t
2B
). It is noticed that S
2B
of the ambient test is about 40%
higher than that of the inert test, and t
2B
of the ambient test is about 30% shorter than
that of the inert test. In the ambient environment, because the water molecules in air
are further apart from each others as compared to those in the liquid-form, the
possibility for the diffusion of water molecules into the film is therefore much less.
However, it is possible for small amount of water molecules to move into the film
crack and assist the film crack propagation in the stage 2B. Since the t
2C
and S
2C
in
ambient test are similar with those in the inert tests, it may be expected that the
interfacial crack growth rates for ambient and inert tests should be similar. This may
be due to the following reason: for an ambient test, there is only a small amount of
water molecules moving into the film crack and it may be fully consumed during film
crack propagation stage, and therefore little has been left to enhance the interfacial
crack growth. Furthermore, it is noticed that the standard deviations of t
2C
for the
ambient and inert tests are particularly large compared to that of the watered test,
suggesting that defects dependency is greater when there is less amount of water to
assist interfacial crack growth. This also suggests that the time-dependent crack
propagation without reactive species may have greater dependence on the crack tip
structure, and therefore leading to greater deviations of the results (Section 6.4).
Chapter 6
155
6.4 Crack Growth at Inert Environment
There are several mechanisms proposed to explain the time-dependent fracture
(also known as stress corrosion cracking, slow crack growth or subcritical fracture),
but the theories proposed by Michalske and Freiman [16], and Cook and Liniger
[17,18] are commonly used to explain the behaviors in low-k materials (Section 2.4.2).
The stress corrosion mechanism in silica was usually believed to be in a three-reaction
sequence [16]: (a) water molecules were adsorbed to strained siloxane bonds, (b) a
concerted reaction occurred and led to the siloxane bonds ruptured, and (c) silanol
groups form at fracture surface. During rapid or spontaneous fracture, the activation
barrier for siloxane bond rupturing is mainly overcome by strain energy. Michalske
and Freiman [16] proposed that when water was presented, this energy barrier was
reduced by the chemical reactions between siloxane bond and water molecule, hence
the growth rate was enhanced. On the other hand, Cook and Liniger [17,18] proposed
that, in reactive environments, (a) surface energy reduced, and (b) when strain energy
release rate was greater than the reduced surface energy, fracture was thermally
activated. These two theories considered that the activation energy was needed to
rupture one atomic bonding under reactive environment, but the effects of the
neighboring atoms and lattice-structure within the cohesive width - the width of
cohesive region located at transition between broken and highly strained crack tip
bonds - were not taken into account.
In this study, the BD/Si system is found to be susceptible to time-dependent
fracture at inert environment (i.e. sample surface is covered with silicone oil). This
anomalous behavior is possibly due to the effects of silica network terminal group


![Báo cáo khoa học: Characterization of the bioactive conformation of the C-terminal tripeptide Gly-Leu-Met-NH2 of substance P using [3-prolinoleucine10]SP analogues pdf](https://media.store123doc.com/images/document/14/rc/ty/medium_tyq1394220086.jpg)