Development of spatial and temporal phase evaluation techniques in digital holography 2
Bạn đang xem bản rút gọn của tài liệu. Xem và tải ngay bản đầy đủ của tài liệu tại đây (879.33 KB, 45 trang )
CHAPTER TWO LITERATURE REVIEW
11
CHAPTER TWO
LITERATURE REVIEW
2.1 Basic principles of holography
2.1.1 Wave theory of light
Light is an electromagnetic radiation, particularly radiation of a wavelength that is
visible to the human eye (about 400 nm – 700 nm). In the field of physics, the term
light usually refers to an electromagnetic radiation of any wavelength. Light that
exists in tiny packets called photons can exhibit properties of both waves and particles.
This property is referred to as the wave–particle duality. In addition, light waves can
be described either by the electrical or by the magnetic field in many applications.
There are four primary properties of light wave, i.e., intensity, frequency (or
wavelength), polarization and phase. The study of light (also known as optics) is an
important research area in modern physics and various application fields.
Diffraction and interference are perfectly described by the wave model, which
is based on the theory of classical electromagnetism. Interference and diffraction also
form the basis of holographic technique. Since electromagnetic waves obey the
Maxwell equations (Kreis, 2005; Schnars and Jueptner, 2005), the propagation of a
light wave in vacuum can be described by
2
2
2 2
1
0
E
E
c t
∂
∇ − =
∂
(2.1)
CHAPTER TWO LITERATURE REVIEW
12
where E is the electric field strength,
2
∇
denotes Laplace operator described by
2 2 2
2
2 2 2
,
x y z
∂ ∂ ∂
∇ = + +
∂ ∂ ∂
(2.2)
( , , )
x y z
denotes the spatial coordinate, t denotes the temporal coordinate, and c is the
propagation speed of the light wave in vacuum (
8
3.0 10 m s
× ).
The electrical field E is a vector quantity, and can vibrate in any direction
perpendicular to the light wave propagation. However, in most real applications, it is
not essential to consider the full vector quantity, and vibration in a single plane is
usually assumed. In this case, the light is called linear polarized light. The above
scalar wave equation can be rewritten as (Kreis, 2005; Schnars and Jueptner, 2005)
2 2
2 2 2
1
0
E E
z c t
∂ ∂
− =
∂ ∂
(2.3)
where the propagation of the light is in the z direction.
For a linearly polarized and harmonic plane wave, the important solution of Eq.
(2.3) is described by
0
( , , ; ) cos(2 )
E x y z t A ft k r
π ϕ
= − +
r
r
(2.4)
where A denotes real amplitude of the light wave, f denotes the frequency of the light
wave,
k
r
is the wave vector,
r
r
is the spatial vector [
( , , )
r x y z
=
r
], and
0
ϕ
denotes a
constant phase. In this study,
0
k r
ϕ ϕ
= − +
r
r
is defined as phase. In many optical
applications, the use of a complex exponential for Eq. (2.4) can greatly facilitate the
wave calculation and derivations of optical principles.
CHAPTER TWO LITERATURE REVIEW
13
The expression of the complex exponential can be written by
0
( , , ; ) exp (2 )
E x y z t A j ft k r
π ϕ
= − +
r
r
(2.5)
where
1.
j
= −
In practice, only the real part of this complex exponential represents
the physical wave, and 2
ft
π
can be ignored since the spatial part of the electrical
field is of the most interest in most cases.
The wavelengths of visible light are in the range of 400 nm to 700 nm, and the
range of the light frequency is from
14
4.3 10
× Hz to
14
7.5 10
× Hz. Hence, commonly-
used sensors, such as photodiodes, photographic films and CCD, are not able to detect
such high frequencies. The only measurable quantity is the intensity, which is defined
by the energy flux through an area per time. The intensity distribution I for a plane
wave can be described by (Schnars and Jueptner, 2005)
2 2
0 0
1
2
t
I c E c A
ε ε
= = (2.6)
where
t
is the time average over the light periods, and
0
ε
is the vacuum
permittivity. In many applications, the factor
0
2
c
ε
can be ignored. For simplicity,
the coordinate in Eq. (2.6) is omitted.
2.1.2 Interference
Interference is the superposition of two or more waves, which can result in a new
wave pattern. In holography, interference usually refers to the interaction of
monochromatic waves that are correlated or coherent with each other since they may
come from the same source or have the same frequencies and wavelengths (Schnars
CHAPTER TWO LITERATURE REVIEW
14
and Jueptner, 2005). In this study, two monochromatic waves are considered, and the
complex amplitudes for these two waves are described by
(
)
1 1 1
( , , ) exp
E x y z A j
ϕ
=
(2.7)
(
)
2 2 2
( , , ) exp
E x y z A j
ϕ
=
(2.8)
The resultant intensity distribution is calculated by the summation of these two
light waves described by (Kreis, 2005)
*
1 2 1 2
2 2
* *
1 2 1 2 1 2
2 2
1 2 1 2 1 2
( )( )
2 cos( )
I E E E E
E E E E E E
A A A A
ϕ ϕ
= + +
= + + +
= + + −
(2.9)
where the asterisk denotes complex conjugate.
It can be seen from Eq. (2.9) that a constructive interference is formed when
the value of
1 2
( )
ϕ ϕ
− is equal to
2 ( 0,1,2 ).
n n
π
=
Similarly, a destructive
interference is formed when the value of
1 2
( )
ϕ ϕ
− is equal to
(2 1) ( 0,1,2 ).
n n
π
+ =
When the constructive interference is generated, the
wavefronts can be considered to be in phase; when the destructive interference is
generated, the wavefronts can be considered to be out of phase. In digital holography,
after the intensity distribution captured by the CCD is multiplied by a numerical
reference wave, the first two terms
(
)
2 2
1 2
E E+
on the right-hand side of Eq. (2.9)
form zero-order term of the diffraction, and the third (
*
1 2
E E
) and fourth terms (
*
1 2
E E
)
form real and virtual images, respectively. It is assumed that the light wave
2
E
represents the reference wave in digital holography.
CHAPTER TWO LITERATURE REVIEW
15
The visibility or contrast of the interference pattern is defined by
max min
max min
I I
V
I I
−
=
+
(2.10)
where
max
I
and
min
I
denote maxima and minima of two neighboring intensities,
respectively. If two parallel polarized waves with the same intensity interfere, the
visibility is unity; if incoherent superposition happens, the visibility is zero.
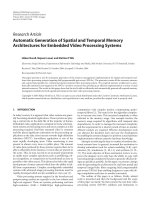
The fringe spacing of the recorded interference pattern can be defined by the
distance between two neighboring maxima points P
1
and P
2
as shown in Fig. 2.1.
The fringe spacing is described by (Schnars and Jueptner, 2005)
( )
1 2
2sin 2
d
λ
θ θ
=
+
(2.11)
where
λ
denotes the wavelength of the light source, the angle
1
θ
is between the first
incident ray E
1
from the source and the unit vector
n
r
perpendicular to the aperture
plane, and the angle
2
θ
is between the second incident ray E
2
and
n
r
. The spatial
frequency can be determined by the reciprocal of the fringe spacing.
Figure 2.1 Interference between two plane waves E
1
and E
2
.
2
θ
1
θ
P
1
P
2
n
r
n
r
d
2
E
1
E
Recording plane
CHAPTER TWO LITERATURE REVIEW
16
2.1.3 Spatial and temporal coherence
It is well known that interference phenomenon is rarely observed under natural
sunlight or lamplight. This is mainly due to the lack of sufficient coherence with this
type of illumination light. Coherence is the measure of the ability of light to interfere.
The coherence of two waves follows from how well correlated the individual waves
are and is derived from the phase relationship between two points which are separated
in either space or time along the wave train. For instance, we consider two points
along the train that are spatially separated and moving with the train. If the phase
relationship between the waves at these points remains constant in time, the waves
between these points are coherent. On the other hand, if the phase relationship is
random or rapidly changing, the waves at these two points are incoherent. Two
aspects of the general coherence are the spatial and temporal coherence.
Spatial coherence describes the mutual correlation of different parts of the
same wavefront and can be physically explained using Young’s double aperture
interferometer experiment arrangement (Kreis, 2005; Schnars and Jueptner, 2005) as
shown in Fig. 2.2. In the Young’s double aperture interferometry experimental
arrangement, an aperture with two transparent holes is mounted between the light
source and a screen, and the two holes are separated with a certain distance. It was
demonstrated in the experiment that only with the distance below the critical limit
cl
a
,
the interference pattern could be observed. In addition, the interference fringes also
vanish with the decrease of the distance between the light source and the aperture.
Hence, it can be concluded that the spatial coherence is not related to the spectral
width of the light source, but depends on the properties of the light source and the
geometry of the interferometer.
CHAPTER TWO LITERATURE REVIEW
17
Figure 2.2 Experimental arrangement for Young’s double aperture interferometer.
Temporal coherence describes the correlation of a wave with itself at different
instants and is related to the finite bandwidth of the light source. The temporal
coherence length
L
is the greatest distance between two points for which there is a
phase difference that still remains constant in time. When the points are separated by
a certain distance greater than the temporal coherence length, there is no phase
correlation and the interference fringes vanish. Typical coherence lengths of
commonly-used lasers in digital holography have temporal coherence lengths from a
few millimeters to centimeters. The temporal-coherence property of a light source can
be investigated using Michelson-interferometer experimental arrangement as shown
in Fig. 2.3. As can be seen in Fig. 2.3, through translating mirror 2, we can adjust the
optical path difference between the two-wave paths. Interference fringes can be
observed only when the optical path difference is below the temporal coherence
length
L
of the light source.
H
1
H
2
a
Aperture with two
holes H
1
and H
2
Light source
CHAPTER TWO LITERATURE REVIEW
18
Figure 2.3 Michelson interferometer arrangement.
2.1.4 Diffraction
Diffraction is broadly defined as the spreading out of light from its geometrically
defined path. The diffraction phenomenon can be observed with a light illumination to
an opaque screen with some transparent holes or a transparent medium with opaque
structures. Figure 2.4 shows a basic principle for the generation of diffraction
phenomenon (Goodman, 1996). A light source S illuminates the aperture with a
transparent hole H, and the light further propagates the observation point R. This
propagation procedure was first qualitatively explained by Huygens, whose principle
presented the idea that each point of a wave-front can act as a source of secondary
wavelets and the wavefront at any other places is the coherent superposition of these
secondary waves. The new wavefront can be considered an ‘envelope’ of these
secondary wavelets.
Recording plane
Mirror 2
Mirror 1
Light source
Translation
CHAPTER TWO LITERATURE REVIEW
19
Figure 2.4 Diffraction based on an opaque screen with a transparent hole.
With a simple assumption about the amplitude and phase of the secondary
waves, Huygens’s principle is able to accurately determine the light distribution of
diffraction patterns (Goodman, 1996). Huygens principle was mathematically
described by Fresnel who considered the approximation methods and Kirchhoff who
figured out all the correct multiplying terms. Subsequently, some problems inherent in
diffraction principle were solved by Fresnel and Fraunhofer. Recently, several
effective diffraction theories have been widely applied, such as Kirchhoff theory, first
Rayleigh-Sommerfeld solution and second Rayleigh-Sommerfeld solution.
The Huygens-Fresnel principle which is predicted by the first Rayleigh-
Sommerfeld solution can be mathematically described by (Goodman, 1996)
exp( )1
( ) ( ) cos
HR
HR
jk
E R E H ds
j
ρ
θ
λ ρ
Σ
=
∫∫
(2.12)
where
k
is wave number (
2k
π λ
=
), and
θ
denotes the angle between the vectors
n
r
and
.
HR
ρ
r
Equation (2.12) can be explained as follows: complex amplitude
( )
E R
at
Light source
S
H
R
Aperture
HR
ρ
r
n
r
CHAPTER TWO LITERATURE REVIEW
20
the observation place is a superposition of the diverging spherical waves
[
]
exp( )
HR HR
jk
ρ ρ
originating from the secondary waves located at the point H within
the aperture
.
Σ
2.1.5 Speckles
When a surface is illuminated by a light wave, each point on an illuminated surface
acts as a source of secondary spherical waves according to the diffraction theory. The
light at any other places is made up of waves which are scattered from each point of
the illuminated surface. If the surface is rough enough to create path-length
differences exceeding one wavelength, the intensity of the resultant light will vary
randomly, which is called speckles. A typical speckle pattern is shown in Fig. 2.5.
However, if the light of low coherence (for instance, with multiple wavelengths) is
applied, a speckle pattern is rarely observed. The reason is that the speckle pattern
produced by individual wavelengths has different dimensions which average one
another (Kreis, 2005).
There are two main types of speckle patterns according to the experimental
arrangement, i.e., objective and subjective speckle patterns. When a laser light that is
scattered by a rough surface directly develops on a screen without any intermediate
optical imaging optics or system, an objective speckle pattern is formed. When the
illuminated surface is focused with an imaging optics or system, a subjective speckle
pattern is formed. In objective or subjective speckle pattern, speckle size d is
calculated by
(
)
,
d z a
λ
=
where z denotes the distance between the object or the
imaging optics and the screen, and a denotes the dimension of the object or the
aperture of an imaging optics.
CHAPTER TWO LITERATURE REVIEW
21
Figure 2.5 A typical speckle pattern.
Since holographic technique uses a coherent light source to generate an
interference pattern, the speckle phenomenon also exists in holography. However, the
coherent noise of speckles can disturb the image quality to some degrees, and make
the identification of features in the scattering structures highly difficult. This has been
considered as a major barrier for the widespread application of coherent imaging
techniques, such as holography.
2.2 Optical holography
2.2.1 Hologram recording
2.2.1.1 In-line optical holographic arrangement
In holography, the first step is to record a hologram based on a preset optical
arrangement. Different optical holographic arrangements can meet different
requirements and also need different processing methods. Figure 2.6 shows a typical
in-line optical holographic experimental arrangement. The in-line optical holographic
arrangement was first proposed by Dr. Gabor (1948). In Fig. 2.6, a light source (such
CHAPTER TWO LITERATURE REVIEW
22
as a He-Ne laser) with a sufficient coherence length is first split into two waves, i.e.,
reference and object waves. The angle between object and reference waves is small or
close to zero (Xu et al., 2002, 2003; Sucerquia et al., 2006a, 2006b). A test object is
illuminated, and the diffracted wavefront from the object (called object wave) then
propagates to a recording medium. The object and reference waves combine in front
of the recording medium by a beam splitter cube, and interfere on the surface of the
recording medium. The recorded interference pattern is called hologram. To ensure
the stability of a recorded intensity distribution, phase difference between the above
two waves must be stationary. In the optical holographic setup, a photographic film is
usually used as the recording medium.
Figure 2.6 A typical in-line optical holographic experimental arrangement.
Complex amplitude of the object wave in the recording plane is described by
(
)
(
)
( , ) , exp ,
O O O
E x y A x y j x y
ϕ
=
(2.13)
Lens
Laser
Spatial filter
Mirror
Object
Beam splitter
cube
Hologram
(Photographic film)
Object wave
Reference wave
CHAPTER TWO LITERATURE REVIEW
23
where
(
)
,
O
A x y
and
(
)
,
O
x y
ϕ
denote real amplitude and phase of the object wave.
The complex amplitude of the reference wave in the recording plane can be
described by
(
)
(
)
( , ) , exp ,
R R R
E x y A x y j x y
ϕ
=
(2.14)
where
(
)
,
R
A x y
and
(
)
,
R
x y
ϕ
denote real amplitude and phase of the reference wave.
In an in-line optical holographic setup, a plane reference wave is commonly used, so
the phase part of Eq. (2.14) may be ignored.
The intensity
(
)
,
I x y
which is formed by using the interference principle is
recorded by the recording medium, and can be expressed by
( ) ( ) ( ) ( )
( ) ( ) ( ) ( ) ( ) ( )
( ) ( ) ( ) ( ) ( ) ( )
*
2 2
* *
2 2
( , ) , , , ,
, , , , , ,
, , 2 , , cos , ,
O R O R
O R O R O R
O R O R O R
I x y E x y E x y E x y E x y
E x y E x y E x y E x y E x y E x y
A x y A x y A x y A x y x y x y
ϕ ϕ
= + +
= + + +
= + + −
(2.15)
2.2.1.2 Off-axis optical holographic arrangement
In the conventional in-line optical holographic setup, the angle between the object and
reference waves is small or close to zero. This setup induces some problems during
holographic reconstruction, such as a superposition of different reconstructed terms
mentioned in Section 2.2.2. Leith and Upatnieks (1962, 1963) proposed to apply an
off-axis experimental setup to overcome the problems inherent in the on-line
holographic setup. An appropriate angle between object and reference waves is
introduced in order to solve the problem existing in the in-line holographic setup.
Figure 2.7 shows an off-axis optical holographic experimental arrangement (Schnars
CHAPTER TWO LITERATURE REVIEW
24
and Jueptner, 2005). The basic principles of wave propagation and interference are the
same to those in the in-line optical holographic setup. However, in the off-axis optical
holographic setup, the angle between object and reference waves is relatively large.
The introduction of this angle results in a spatial carrier (Takeda et al., 1982), which
can greatly facilitate the subsequent analyses.
Figure 2.7 An off-axis optical holographic experimental arrangement.
2.2.2 Optical reconstruction
To reconstruct the image recorded by the photographic film, the same reference wave
used in the recording step should be applied again to illuminate the hologram. Figure
2.8 shows an optical reconstruction of the object wave based on the off-axis optical
holographic setup (Kreis, 2005). Similarly, the reference wave can also be used to
illuminate the recorded hologram in the in-line optical holographic setup. As shown in
Beam splitter cube
Mirror
Mirror
Hologram
Object
Laser
Lens
Spatial filter
Lens
Mirror
Lens
Reference wave
Object wave
CHAPTER TWO LITERATURE REVIEW
25
Fig. 2.8, the object wave path is blocked, and the reference wave is used to illuminate
the recorded hologram.
Figure 2.8 Optical reconstruction based on an off-axis optical holographic setup.
When the reference wave illuminates the recorded hologram, the modulation
procedure can be described by
( ) ( ) ( ) ( ) ( ) ( )
( ) ( ) ( )
( ) ( ) ( ) ( )
*
2 2
2
* 2
( , ) , , , , , ,
, , ,
, , , ,
R R O R O R
O R R
O R R O
I x y E x y E x y E x y E x y E x y E x y
E x y E x y E x y
E x y E x y E x y E x y
= + +
= +
+ +
(2.16)
where the first term on the right-hand side of Eq. (2.16) forms a zero-order term or
DC term, and the second and third terms form real and virtual images, respectively. In
off-axis optical holographic setup, these three terms can be effectively separated.
However, in the in-line optical holographic setup, these terms superpose.
Beam splitter cube
Mirror
Mirror
Recorded hologram
Reconstructed
virtual image
Laser
Spatial filter
Lens
Beam stop
Lens
CHAPTER TWO LITERATURE REVIEW
26
2.3 Optical holographic interferometry
In the practical engineering field, not only a single reconstruction is of interest, but the
comparison of two or more wavefronts is also required. Holographic interferometry is
defined as the interferometric comparison of two or more wave fields (Vest, 1979).
Holographic interferometry is a non-contact and non-destructive technique which can
be applied to various applications, such as deformation measurement and object
surface contouring (Schnars and Jueptner, 2005). There are two main types in
holographic interferometry, i.e., double exposure and real time. Figures 2.9 and 2.10
show the recording and reconstruction of holographic interferogram based on double
exposure method. In Fig. 2.9, the reference state of the object is first recorded by the
recording medium, and then the second (such as deformed) state of the object is
recorded by the same recording medium. In the optical reconstruction, the same
reference wave during the recording is applied to illuminate the hologram, and the
superposition result (such as an interference fringe) is visible.
Figure 2.9 Optical recording of a holographic interferogram.
Beam splitter cube
Mirror
Mirror
Hologram
Object under
deformation
Lens
Spatial filter
Lens
Lens
Laser
Mirror
Reference wave
Object wave
CHAPTER TWO LITERATURE REVIEW
27
Figure 2.10 Optical reconstruction of holographic interferogram.
In the recording procedure, the reference and deformed states of the object can
be described by
[
]
1 1
( , ) ( , )exp ( , )
O x y A x y j x y
ϕ
= (2.17)
[
]
2 2
( , ) ( , )exp ( , )
O x y A x y j x y
ϕ
= (2.18)
where
( , )
A x y
denotes the real amplitude (assumed as constant), and
1
( , )
x y
ϕ
and
2
( , )
x y
ϕ
denote phase distributions of the test object at the two states. The value of
2
( , )
x y
ϕ
can be further described by
2 1
( , ) ( , ) ,
x y x y
ϕ ϕ ϕ
= + ∆
where
ϕ
∆
is the phase
variance between the reference and deformed states. This phase variance is directly
related to the measured physical quantities. Hence, when the recorded hologram is
illuminated by the reference wave, both wave fields are reconstructed as shown in Fig.
2.10. The intensity distribution
( , )
I x y
is calculated by the square of the summation
of the two reconstructed complex amplitudes.
Beam splitter cube
Mirror
Mirror
Recorded hologram
Reconstructed object
at two states
Spatial filter
Lens
Lens
Laser
Beam stop
CHAPTER TWO LITERATURE REVIEW
28
[
]
[
]
[ ]
*
1 2 1 2
2
( , ) ( , ) ( , ) ( , ) ( , )
2 1 cos( )
I x y O x y O x y O x y O x y
A
ϕ
= + +
= + ∆
(2.19)
In optical holographic interferometry, it is quite difficult to quantitatively
extract the phase distribution. The commonly-used method is the manual fringe
counting which is not accurate. Hence, it is important to develop some digital
approaches in order to quantitatively extract the phase distribution that is directly
related to the measured physical quantity.
2.4 Digital holography
2.4.1 Digital hologram recording
With the rapid development of computer technique and charged-couple device (CCD),
the automation becomes a major theme and the accurate and quantitative
measurement of physical quantities becomes feasible. When the CCD technology is
introduced to the holographic research field, the concept of digital holography was
developed (Schnars and Jüptner, 1994a; Cuche et al., 1999a). The experimental
arrangements for digital holography are almost the same as those shown in Figs. 2.6
and 2.7. Simple schematics for in-line and off-axis digital holographic experimental
setups are shown in Figs. 2.11(a) and 2.11(b), respectively. A CCD shown in Fig.
2.11 is used to replace the conventional recording medium of photographic film, and
the numerical recording in digital holography brings in many new topics into the
realm of research. However, basic principles of holographic techniques mentioned
above, such as coherence, interference and diffraction, are also valid for digital
holography.
CHAPTER TWO LITERATURE REVIEW
29
Digital holography has several advantages (Schnars, 1994) compared with
conventional optical holographic technique: (1) The hologram is recorded digitally
and no chemical or physical development process is required; (2) the hologram can be
recorded in the video frequency; (3) numerical hologram recording, subsequent
numerical reconstruction and phase evaluation can be integrated into a single system.
Figure 2.11 (a) In-line digital holographic experimental setup; (b) off-axis
digital holographic experimental setup.
2.4.2 Numerical reconstruction
2.4.2.1 Fresnel approximation method
There are three planes in digital holography, i.e., object plane, hologram (or CCD)
plane and reconstruction (or image) plane. A coordinate system for the numerical
reconstruction of a digital hologram is shown in Fig. 2.12. The numerical
reconstruction procedure is mainly based on the scalar diffraction principle (Goodman,
1996). The original object wave
( ', ')
ξ η
Γ
can be reconstructed by a modification of
Eq. (2.12), and can be expressed by Fresnel-Kirchhoff integral.
Object
Reference wave
C
C
D
Object wave
Object
Beam splitter
cube
Reference wave
Object wave
CCD
(a)
(b)
CHAPTER TWO LITERATURE REVIEW
30
1 2 1 cos
( ', ') ( , ) ( , ) exp
2
j
H x y R x y j dxdy
π θ
ξ η ρ
λ ρ λ
+∞ +∞
−∞ −∞
+
Γ = −
∫ ∫
(2.20)
where
( , )
H x y
denotes the hologram function,
( , )
R x y
denotes a numerical reference
wave,
ρ
is the distance from a point P in the hologram (or CCD) plane to a point Q in
the image plane
2 2 2
( ') ( ')
x y d
ρ ξ η
= − + − +
as shown in Fig. 2.12, d is the axial
reconstruction distance, and
θ
is the angle between the normal
n
r
and
ρ
(see Fig.
2.12). In the most practical situations,
θ
is very small and .1cos
≈
θ
Figure 2.12 A coordinate system for numerical reconstruction of digital hologram.
The expression of
ρ
can be expanded to a Taylor series (Schnars and Jueptner,
2005).
( ) ( )
( ) ( )
2
2 2
2 2
3
' '
' '
1
2 2 8
x y
x y
d
d d d
ξ η
ξ η
ρ
− + −
− −
= + + − + (2.21)
If the following condition is satisfied, the Taylor series can be further
simplified (Schnars and Jueptner, 2005; Kreis, 2005).
ξ
x
y
x
d d
Object plane Hologram (CCD) plane
Reconstruction (Image) plane
z
η
'
ξ
x
'
η
Q
P
n
r
θ
ρ
CHAPTER TWO LITERATURE REVIEW
31
( ) ( )
2
2 2
3
max
' '
4
d x y
π
ξ η
λ
>> − + −
(2.22)
Based on this condition, the expression of
ρ
can be described by
( ) ( )
2 2
' '
2 2
x y
d
d d
ξ η
ρ
− −
= + + (2.23)
Hence, with an additional approximation of replacing
ρ
in the denominator by
,d Equation (2.20) can be rewritten as (Schnars and Jueptner, 2005; Liu et al., 2002)
( )
( )
( )
2 2
2 2
2
( ', ') exp exp ' '
( , ) ( , )exp
2
exp ' '
j
j d j
d d
H x y R x y j x y
d
j x y dxdy
d
π π
ξ η ξ η
λ λ λ
π
λ
π
ξ η
λ
+∞ +∞
−∞ −∞
Γ = − − +
× − +
× +
∫ ∫
(2.24)
A discrete representation of Eq. (2.24) is described by
( )
2 2
1 1
2 2 2 2
0 0
2 2 2 2
2
( , ) exp exp ( , )
( , )exp exp 2
M N
k l
j m n
m n j d j d H k l
d M x N y
mk nl
R k l j k x l y j
d M N
π
πλ
λ λ
π
π
λ
− −
= =
Γ = − − +
∆ ∆
× − ∆ + ∆ +
∑∑
(2.25)
where
),( nm
Γ
denotes a matrix of
NM
×
points, and
x
∆
and
y
∆
denote pixel sizes
in the hologram (CCD) plane. For the sake of brevity, the pixel in the image plane is
denoted as (m, n). The pixel sizes in the image plane can be calculated by
' ;
d
M x
λ
ξ
∆ =
∆
'
d
N y
λ
η
∆ =
∆
(2.26)
CHAPTER TWO LITERATURE REVIEW
32
The intensity distribution
( , )
I m n
and the phase distribution
( , )
m n
ϕ
can be
directly extracted from the reconstructed complex amplitude.
2
( , ) ( , )
I m n m n
= Γ (2.27)
[
]
[ ]
Im ( , )
( , ) arctan
Re ( , )
m n
m n
m n
ϕ
Γ
=
Γ
(2.28)
where Im and Re denote imaginary and real parts of a complex amplitude,
respectively.
2.4.2.2 Convolution method
It is demonstrated that numerical reconstruction using convolution method is better
than Fresnel approximation method when the reconstruction distance is relatively
small (Dakoff et al., 2003). Equation (2.20) can be rewritten as (Kreis et al., 1997;
Schnars and Jueptner, 2005; Kim et al., 2006)
( ', ') ( , ) ( , ) ( ', ', , )
H x y R x y g x y dxdy
ξ η ξ η
+∞ +∞
−∞ −∞
Γ =
∫ ∫
(2.29)
where the impulse response
( ', ', , )
g x y
ξ η
is given by
2
( ', ', , ) exp
j
g x y j
π
ξ η ρ
λρ λ
= −
(2.30)
Hence, numerical reconstruction based on convolution method can be written
as (Kreis et al., 1997; Schnars and Jueptner, 2005)
[
]
[
]
{
}
1
( ', ') ( , ) ( , ) ( , )
FFT FFT H x y R x y FFT g x y
ξ η
−
Γ = (2.31)
CHAPTER TWO LITERATURE REVIEW
33
where
FFT
and
1
FFT
−
denote a two-dimensional (2D) fast Fourier transform and an
inverse 2D Fourier transform, respectively. Note that the linear system in Eq. (2.29) is
space-invariant.
The total numerical reconstruction procedure can be divided into three Fourier
transforms, so fast Fourier transform can be implemented in order to enhance the
computation speed. Moreover, pixel size in the image plane is independent of the
reconstruction distance and the wavelength, and the pixel size is equivalent to the
pixel size of CCD camera. Compared with the Fresnel approximation method,
convolution method performs better when the reconstructed images with different
reconstruction distances need to be compared.
2.4.2.3 Pure Fourier transform method
When the point source of the reference wave is located at the same plane of the object,
numerical reconstruction process can be simplified as a pure Fourier transform
(Wagner et al., 1999). A schematic lensless Fourier holographic recording setup is
shown in Fig. 2.13. The spherical reference wave can be simplified as
( )
( )
2 2
1 2
, exp exp
R x y j d j x y
d d
π π
λ λ
≈ − − +
(2.32)
Hence, the reconstructed complex amplitude can be described by
( )
[ ]
2 2 1
( ', ') exp ' ' ( , )
C j FFT H x y
d
π
ξ η ξ η
λ
−
Γ = +
(2.33)
where C denotes a constant complex value.
CHAPTER TWO LITERATURE REVIEW
34
Figure 2.13 Digital lensless Fourier holography.
2.4.2.4 Angular spectrum algorithm
It is also possible to formulate the scalar diffraction theory in a framework that
resembles the theory of linear and invariant systems (Goodman, 1996). If the complex
field distribution of a monochromatic disturbance is Fourier across any place, and the
complex field at any other point can be calculated by summing the contributions of all
waves. A propagation procedure and coordinate system for the numerical
reconstruction using angular spectrum algorithm is shown in Fig. 2.14.
Figure 2.14 Coordinate system for the reconstruction of an object wave
using angular spectrum algorithm.
After the recorded digital hologram is illuminated by using a numerical
reference wave in the hologram plane, an object wave
( ', ')
ξ η
Γ
in the image plane
can be determined by (Goodman, 1996; Mann et al., 2005)
d
z
k
y
k
k
Hologram
( , )
H x y
Reconstructed object
( ', ')
ξ η
Γ
x
k
C
C
D
Object
Reference wave
source point
CHAPTER TWO LITERATURE REVIEW
35
[
]
1
( ', ') ( , ; ) ( , )
x y
FFT k k d FFT H x y
ξ η
−
Γ = ℑ
(2.34)
where
x
k
and
y
k
are the wave vectors (as shown in Fig. 2.14), and
( , ; )
x y
k k d
ℑ is a
transfer function described by
( )
2 2 2
( , ; ) exp exp
x y z x y
k k d jdk jd k k k
ℑ = − = − − −
(2.35)
where
z
k
denotes a wave vector along the z direction.
The expression of Eq. (2.35) can be rewritten as
( )
( )
( )
( )
1 2
1 2
2
2
2 2
exp 1 if 1
( , ; )
0 Otherwise
x y x y
x y
j k d f f f f
f f d
λ λ λ
− − − + <
ℑ =
(2.36)
where
x
f and
y
f are spatial frequencies. In practice, the bandwidth is determined by
some factors, such as CCD pixel size. It is assumed in this thesis that
x
f and
y
f are
always within the above bandwidth. Therefore, a discrete representation of Eq. (2.36)
is expressed as
1 2
2 2
2 2
( , ; ) exp 1
M N
m n
m n d jk d
M x N y
λ λ
− −
ℑ = − − −
∆ ∆
(2.37)
where ,1 ,,1,0
−
=
Mm ,1 ,,1,0
−
=
Nn M and N denote pixel numbers of the CCD,
and x
∆
and y
∆
denote pixel sizes of the CCD along x and y directions. The
programming codes for these reconstruction algorithms are presented in Appendix A.