Development of a miniaturization assay platform and its application to study scarce biological samples
Bạn đang xem bản rút gọn của tài liệu. Xem và tải ngay bản đầy đủ của tài liệu tại đây (981.76 KB, 108 trang )
1
Development of a Miniaturization Assay Platform
and Its Application to Study Scarce Biological Samples
Yong Yeow Lee
B.Eng. Electrical and Electronic Engineering
Nanyang Technological University, Singapore, 2004
A Thesis Submitted
For the Degree of Doctor of Philosophy
National University of Singapore
2010
2
Abstract
Miniaturization technologies have developed rapidly over the past decade.
However, the challenge in advancing miniaturization strategies largely depends on their
scalability to cater to a myriad of important applications. There is an increasing demand
for the accurate processing of scarce samples, such as stem cells, cancer stem cells and
patients’ samples. Miniaturization technologies may offer important insights into the
characterization of these biologically relevant samples for research and clinical
applications.
This thesis presents a novel miniaturized assay technology, DropArray
TM
, for
conducting heterogeneous cell-based assays. The DropArray
TM
plate consists of an array
of 2-mm hydrophilic spots, insulated from each other by a hydrophobic
polytetrafluoroethylene (PTFE) coating. Each spot represents a 2-µl assay. DropArray
TM
Accelerator has been designed to reproducibly automate the precise movements and
fluidics during parallel rinsing so that there is negligible cross-contamination between the
assay points on each plate.
DropArray
TM
has been successfully employed to miniaturize a wide range of
heterogeneous assays, such as enzyme-linked immunosorbent assay (ELISA) and high-
content screening (HCS) cell-based assays. Besides ensuring the robustness of this
technology for HCS assays, effects of miniaturization have been studied in detail. HCS
assays are shown to remain robust at 2 µl, using only 500 cells per data point. Applying
DropArray
TM
to HCS assays also reduces the antibody staining time significantly by ~
60%.
DropArray
TM
has also been applied to study the drug responses of various scarce
cancer side population (SP) phenotypes. Interesting drug resistance phenomena that have
been difficult to demonstrate have been successfully elucidated in this work. The SP
phenotypes enriched from various cell lines are associated with cancer stem cell
properties in the literature. Besides showing increased expressions of genes associated
with drug efflux capabilities, these cells have been found to initiate an entire tumor with
only 3000 cells. In vitro drug response assays with these scarce cells have been
conducted effectively with the DropArray
TM
platform.
3
Acknowledgements
I would like to thank my thesis advisor Professor Jackie Ying for her guidance,
support and patience since 2003. I am privileged to be mentored by her for my Ph.D.
work, and I am grateful for all the motivation and opportunities she has given me
throughout my Ph.D. studies. I also thank my co-supervisor Dr. Namyong Kim for his
guidance in developing a commercially viable technology, DropArray
TM
. I am grateful to
Professor Hanry Yu, for serving on my Thesis Advisory Committee and for his generous
advice.
I am delighted to have conducted research at the Institute of Bioengineering and
Nanotechnology (IBN). Dr. Leck Kwong Joo and Dr. Karthikeyan Narayanan have
generously taught me biological techniques that were critical to the success of my project.
I appreciate the kindness of Dr. Began Gopalan, Dr. Ke Zhiyuan, Irene Kng Yin Ling,
Gao Shujun, Dr. Zeng Jieming and Dr. Cha Junhoe for sharing their expertise and
reagents.
My Ph.D. journey is accompanied by great friendships built at IBN. I am grateful
to Dr. Benjamin Tai, who has been a wonderful friend and colleague all these years. He
has always lent a patient ear and given me helpful suggestions. I thank the wonderful lab
mates, Siti Nurhanna Riduan, Nor Lizawati Ibrahim, Dr. Erathodiyil Nandanan, Dr.
Leong Meng Fatt, James Hsieh, Dr. Lu Hongfang, Serina Ng , Jerry Toh, Dr. Emril
Mohamed Ali, and Dr. Andrew Wan, as well as many more IBN staff and students who
made working at IBN fun and enjoyable.
I thank my father, Lee See Poh, and brothers Lee Yong Lu and Lee Yong Sang
for their encouragements and understanding. Last but not least, I am indebted to my
mother, Tan Aye Choo, for her kindness and unconditional love. This thesis would not
have been possible without the support of my family.
4
Table of Contents
Abstract
2
Acknowledgements
3
Table of Contents
4
List of Tables
8
List of Figures
9
Chapter 1 – Background and Motivation 14
1.1 The Promise of Assay Miniaturization 14
1.2 Advances in Biologically Relevant Assays for Drug Discovery 17
1.3 A Trend towards Clinically Relevant Cell Sources for Cancer Drug
Discovery
19
1.4 Developing a Niche in Assay Miniaturization 20
1.5 Research Objectives 22
1.6 References 23
Chapter 2 – Development of the DropArray
TM
Technology for Miniaturized
Cell Based Assays
28
2.1 Introduction 28
2.2 Experimental Methods 30
2.2.1 Materials 30
2.2.2 Optimization of Rinsing Buffer Left-Over Volume to Draining Angle 30
2.2.3 Cross-Contamination Study Using Rinsing Station 31
2.2.4 Development of the Alpha Prototype DropArray
TM
Accelerator and
Plates
32
2.2.5 AlamarBlue
®
Assay in DropArray
TM
Plate Versus 96-Well Plates 32
2.3 Results and Discussion 33
2.3.1 Miniaturization on PTFE-Printed Slide Versus Conventional Well
Plates
33
2.3.2 Protection of PTFE-Printed Surface from Surface Wetting 34
5
2.3.2.1 Application of Oil for Protecting PTFE Surface 35
2.3.2.2 DropArray
TM
Technology – A Parallel Rinsing Approach for
Teflon-Printed Flat Glass Slides
36
2.3.3 Optimization of Protocols for DropArray
TM
Technology 38
2.3.3.1 Effect of Draining Angle on the Uniformity of Residual Drops
After Rinsing
38
2.3.3.2 Overcoming Cross-Contamination in DropArray
TM
Technology
40
2.3.4 Development of the DropArray
TM
Accelerator and DropArray
TM
Plate
42
2.3.5 Adaptation of DropArray
TM
Technology to Homogeneous Cell-based
Assays
44
2.4 Summary 47
2.5 References 48
Chapter 3 – Optimization of DropArray
TM
Parallel Rinsing Technology for
High-Content Cell-Based Assays
52
3.1 Introduction 52
3.2 Experimental Methods 54
3.2.1 Materials 54
3.2.2 Miniaturization of HCS Assays Using the DropArray
TM
Technology 55
3.2.3 Fluorescence Spectra Analysis 55
3.2.4 SDS-PAGE and Western Blot 56
3.2.5 2-µl High-Content Caspase 3 Assay on DropArray
TM
56
3.3 Results and Discussion 56
3.3.1 Optimization of Parallel Rinsing Protocol on DropArray
TM
Accelerator for HCS Assays
56
3.3.1.1 Effects of the Various Types of HCS Reagent on the
Duration Required for the 2-µl Reagent Drops to Interact
with the Rinsing Buffer
57
3.3.1.2 Effects of Cell Loss Upon Multiple Rinsing Required of the
HCS Protocol
58
3.3.1.3 Fine Tuning of Rinsing Duration on DropArray
TM
Accelerator for ERK Translocation HCS assay
60
6
3.3.2 Ensuring DropArray
TM
’s Compatibility to Cellomics ArrayScan
®
HCS Imager
62
3.3.3 Miniaturization of the ERK Protein Translocation Assay Using the
DropArray
TM
Technology
65
3.3.4 Increased Rate of Antibody Binding Reaction Due to
Miniaturization
67
3.3.5 Effects of Reduced Cell Number on the Robustness of Mitotic
Index HCS Assay Conducted Using DropArray
TM
Technology
69
3.3.6 Caspase 3 HCS Assay for Studying Dose Response of Doxorubicin 72
3.3.6.1 Effect of the Autofluorescence of Doxorubicin on HCS
Assays
72
3.3.6.2 Development of the Caspase 3 HCS Assay to Elicit the
Drug Response of Doxorubicin
73
3.4 Summary 75
3.5 References 76
Chapter 4 – Application of DropArray
TM
Platform for Studying Drug
Resistance of Scarce Cancer Stem Cells
80
4.1 Introduction 80
4.2 Experimental Methods 82
4.2.1 Materials 82
4.2.2 Side Population (SP) Analysis and Enrichment 82
4.2.3 Gene Expression Profile 83
4.2.4 In Vivo Tumorigenic Experiments 84
4.3 Results and Discussion 85
4.3.1 SP Cells in Cancer Cell Lines 85
4.3.1.1 Identification of SP Cells in Cancer Cell Lines 85
4.3.1.2 Purity of SP Cells After Flow Cytometry Sorting 88
4.3.1.3 DropArray
TM
Enabled Studies with Scarce SP-Enriched
Cancer Stem Cells (CSCs)
89
7
4.3.2 Characterization of HuH7 SP Cells as Cancer Stem Cells 90
4.3.2.1 Repopulation of HuH7 SP Cells in Solid Tumor from
Transplantation
92
4.3.2.2 Histological Analysis with H&E Staining 93
4.3.3 Drug Resistance Properties of SP Cells of HuH7, MCF7 and SW480 93
4.3.3.1 Characterizing Drug Resistance Properties of HuH7 SP Cells 94
4.3.3.2 Drug Resistance Properties in MCF7 SP Cells 96
4.3.3.3 Drug Resistance Properties of SW480 SP Cells 99
4.3.3.4 Oxidative Stress in SW480 SP Cells 100
4.4 Summary 101
4.5 References 102
Chapter 5 – Recommendations for Future Work 106
5.1 Advantages of the DropArray
TM
Technology as Compared to Other Cell
Microarrays
106
5.1 Applications of the DropArray
TM
Technology to Cancer Stem Cells
Derived from Patients
106
5.2 References 107
Chapter 6 – Conclusion 108
8
List of Tables
Table 1.1. Classification of miniaturized assay platforms. 17
Table 2.1. Summary of the fluidics test to study the ease of draining of oil,
‘popping’ of aqueous drops through the oil layer, wetting of hydrophobic layer,
and dispensing aqueous reagent through the oil layer.
36
Table 3.1. Effects of varying shaking time during parallel rinsing on
DropArray
TM
Accelerator on the fluorescence signal difference, CV of the
positive control, and Z’ factor of the ERK HCS assay.
61
9
List of Figures
Fig 1.1. The relationship between miniaturization, assays and samples in the 20
th
and 21
st
century.
21
Fig. 1.2. Technology landscape of the various miniaturization techniques
developed.
22
Fig. 2.1. Photographs of commercially available 1,536-well plate and our PTFE-
printed slide.
34
Fig. 2.2. Schematic of the selectively hydrophobic-hydrophilic patterned slide
undergoing rinsing.
38
Fig. 2.3. Schematic of PTFE-printed slide exiting from the rinsing buffer.
39
Fig. 2.4. Fluorescence intensity due to dilution by residual drop and reference at
different exit angles.
40
Fig. 2.5. Early developments of the rinsing station to study parallel rinsing on the
DropArray
TM
.
41
Fig. 2.6. Investigation of cross-contamination in a densely packed array of drops.
Micrographs of the PTFE-printed slide after (a) TAMRA solution was dispensed
onto the spots, (b) the slide was subjected to rinsing, and (c) Fluorescein solution
was dispensed onto the spots. Scale bar = 500 µm.
42
Fig. 2.7. Alpha prototype of DropArray
TM
plate and DropArray
TM
Accelerator
with user interface to input fluidics parameters.
43
Fig. 2.8. Steps programmed on the DropArray
TM
Accelerator to perform parallel
rinsing on the DropArray
TM
plate.
44
Fig. 2.9. (a) DropArray
TM
plate aligned to the objective of the plate reader to
produce maximum signal readout. (b) Off-aligned DropArray
TM
plate would
result in erroneous data sampling.
46
Fig. 2.10. Normalized MKN7 cell growth rate in (p) 2-µl DropArray
TM
and (g)
100-µl 96-well plate AlamarBlue
®
assays. Seeding concentrations of 750 and
7,500 cells per data point were implemented on DropArray
TM
and 96-well plate
respectively.
46
10
Fig. 3.1. Cell count of 10 spots in the DropArray
TM
plate after 21 rinsing steps
on the DropArray
TM
Accelerator. Control comprised of images from 10 spots
before rinsing. Fixation (Fix) and permeabilization (Perm) steps were
accompanied with 2 rinses before imaging, totaling 6 rinsing steps.
Subsequently, additional 15 rinsing steps were implemented and imaged at
intervals of 5 rinses. Over 98% of the cells remained attached to the spots of the
DropArray
TM
plate even after 21 rinses.
60
Fig. 3.2. Fluorescence micrographs of the DropArray
TM
plate and stained cells
imaged with various different filters. (a) Image taken at a laser excitation/filter
emission wavelength of 350 nm/375 nm displays only the cells. (b) Image taken
at a laser excitation/filter emission wavelength of 488 nm/509 nm displays both
the cells and the PTFE layer of the DropArray
TM
plate. (c) Composite image of
(a) and (b).
63
Fig. 3.3. Emission spectrum of the PTFE layer on the DropArray
TM
plate with an
excitation wavelength of 240 nm.
64
Fig. 3.4. Change in objective from 4× to 10× effectively reduced the field of
view for the spots on the DropArray
TM
plate to avoid recognizing the
background fluorescence of the DropArray
TM
plate.
64
Fig. 3.5. Fluorescence micrographs of NIH3T3 cells untreated or treated with
PMA in DropArray
TM
and 96-well plate for 30 min. Phosphorated-ERK protein
translocation from the cytoplasm to the nucleus was tracked and illustrated by
the green fluorescence. Cells were counterstained with Hoechst.
66
Fig. 3.6. Drug response of NIH3T3 cells to PMA treatment. Assays conducted in
(g) DropArray
TM
plate with 500 cells and (g) 96-well plate with 5,000 cells
produced drug response of similar EC
50
values. Values are mean ± standard
deviation; n = 4.
67
Figure 3.7. Drug response of NIH3T3 cells to PMA treatment. Assay conducted
in 96-well plate with reduced antibody staining time failed to produce an
acceptable EC
50
value. Values are mean ± standard deviation; n = 4.
68
Figure 3.8. Drug response of NIH3T3 cells to PMA treatment. Assay conducted
in DropArray
TM
plate with reduced antibody staining time remained robust with
an acceptable EC
50
of 2.9 ng/ml of PMA. Values are mean ± standard deviation;
n = 4.
68
11
Fig. 3.9. Fluorescence micrographs of MKN7 cells treated with Docetaxel for 18
h in DropArray
TM
plate and 96-well plate. Phospho-histone H3 protein, an
indicator of cells that underwent mitotic arrest was shown by the red
fluorescence. Cells were counterstained with Hoechst.
71
Fig. 3.10. Drug response of MKN7 cells to Docetaxel treatment. Assays
conducted in (g) DropArray
TM
plate with 150 cells and (g) 96-well plate with
7,500 cells produced similar drug response profiles. Values were mean ±
standard deviation; n = 4.
71
Fig. 3.11. Emission spectrum of doxorubicin in water (excitation wavelength =
380 nm).
73
Fig. 3.12. Cleaved Caspase 3 detected in HuH7 cells after treatment with
doxorubicin for 18 h.
74
Fig. 3.13. Fluorescence micrographs of HuH7 cells treated with DMSO (control)
and doxorubicin. Cleaved Caspase 3 protein, an indicator of cells arrested at
apoptosis due to doxorubicin, was illustrated by the red fluorescence. Cells were
counterstained with Hoechst.
75
Fig. 3.14. Drug response of HuH7 cells to doxorubicin treatment. HuH7 cells
undergo Caspase 3 activation at a doxorubicin dosage of > 1 µg/ml. Values are
mean ± standard deviation; n = 4.
75
Fig. 4.1. (a) SP analysis of human cervical carcinoma Hela. The missing
characteristic tail in the Hoechst staining profile in Hela suggests the absence of
SP phenotype. (b) Control for Hoechst staining profile with the additional
treatment of verapamil to prevent Hoechst efflux.
86
Fig. 4.2. (a) Analysis of SP in hepatoma carcinoma cell line HuH7 SP cells from
the fluorescence intensity of Hoechst 33342 staining. SP population was
represented by the tail of the Hoechst staining profile, which was ~ 0.7% of the
viable single cell population. (b) Treatment of verapamil prevented Hoechst
efflux, causing SP to disappear into the bulk population.
87
Fig. 4.3. (a) Analysis of SP in human breast adenocarcinoma cell line MCF7 SP
cells from the fluorescence intensity of Hoechst 33342 staining. SP population
was represented by the tail of the Hoechst staining profile, which was ~ 1.2% of
the viable single cell population. (b) Treatment of verapamil prevented Hoechst
efflux, causing SP to disappear into the bulk population.
87
12
Fig. 4.4. (a) Analysis of SP in human colorectal carcinoma cell line SW480 SP
cells from the fluorescence intensity of Hoechst 33342 staining. SP population
was represented by the tail of the Hoechst staining profile, which was ~ 0.3% of
the viable single cell population. (b) Treatment of verapamil prevented Hoechst
efflux, causing SP to disappear into the bulk population.
88
Fig. 4.5. Post-sorting analysis of HuH7 (a) SP and (b) non-SP cells. No
contaminations from each of the populations were observed, confirming the
purity of the sorted SP and non-SP populations.
89
Fig. 4.6. Breakdown of cell population from FACS Aria Software during SW480
SP cell sorting.
90
Fig. 4.7. 3,000 HuH7 SP cells were sufficient to initiate tumors when inoculated
subcutaneously in BALB/c nude mice, unlike the HuH7 NSP cells.
91
Fig. 4.8. SP analysis of tumor cells from sites inoculated with HuH7 SP cells. (a)
Tumor cells harvested from BALB/c mice possessed 0.3% of SP population. (b)
Treatment of verapamil prevented Hoechst efflux, causing SP to disappear into
the bulk population, confirming the SP gating criteria.
92
Fig. 4.9. H&E staining of a section of tumor induced by HuH7 SP cells. The
arrows pointed to the blood vessels formed under the skin epithelial layer,
indicating angiogenesis of HuH7 SP cells.
93
Fig. 4.10. Characterization of drug resistance genes, ABCG2 and MDR1, in
HuH7 (g) SP and (g) non-SP cells by quantitative real-time PCR using 3,000
cells per replicate. Values were mean ± standard deviation; n = 4.
94
Fig. 4.11. Fluorescence micrographs of HuH7 SP and non-SP cells treated with
doxorubicin for 18 h. Cleaved Caspase 3 protein, an indicator of cells arrested at
apoptosis due to doxorubicin was shown by the red fluorescence. Cells were
counterstained with Hoechst.
95
Fig. 4.12. Drug response of HuH7 (g) SP and (g) non-SP cells to doxorubicin
treatment. HuH7 SP cells demonstrated a much lower percentage of cells
undergoing Caspase 3 activation as compared to the non-SP cells. Values were
mean ± standard deviation; n = 4.
96
Fig. 4.13. (a) Expression levels of ABCG2 and MDR1 in MCF7 (g) SP and (g)
non-SP cells by quantitative real-time PCR using 3,000 cells per replicate.
Values were mean ± standard deviation; n = 4.
97
13
Fig. 4.14. Fluorescence micrographs of MCF7 SP and non-SP cells treated with
100 µg/ml of docetaxel for 18 h. Phosphorylated core histone protein H3, an
indicator of cells arrested at mitosis phase due to docetaxel was shown by the
green fluorescence. Cells were counterstained with Hoechst.
98
Fig. 4.15. Drug response of MCF7 (g) SP and (g) non-SP cells to docetaxel
treatment. A lower percentage of the MCF7 SP cells underwent mitotic arrest, as
compared to the non-SP cells. Values were mean ± standard deviation; n = 4.
98
Fig. 4.16. (a) Expression levels of ABCG2 and MDR1 in SW480 (g) SP and
(g) non-SP cells by quantitative real-time PCR using 3,000 cells per replicate.
Values were mean ± standard deviation; n = 4.
99
Fig. 4.17. Fluorescence micrographs of SW480 SP and non-SP cells treated with
100 mM of H
2
O
2
for 1 h. Phospho-CREB protein, an indicator of cells that
survived oxidative stress was shown by the green fluorescence. Cells were
counterstained with Hoechst.
100
Fig. 4.18. Drug response of SW480 (g) SP and (g) non-SP cells to H
2
O
2
treatment. A greater percentage of SW480 SP cells were resilient against
oxidative stress. Values were mean ± standard deviation; n = 4.
101
14
Chapter 1 – Background and Motivation
1.1 The Promise of Assay Miniaturization
The past 20 years of assay miniaturization has led to the development of many
exciting biological applications [1–3]. For example, 6 years ago, genetic sequencing
of the human genome used to take hundreds of biologists over 13 years; but now, it
can be accomplished by three technicians in 1 week using a microfluidic platform [4].
In addition, the amount of sample that was barely enough for a single gene expression
study by polymerase chain reaction (PCR) years ago is now sufficient for screening
against 60,000 genes on a single microarray platform [5]. Even the laborious Western
blotting on polyacrylamide gel can be miniaturized on a capillary microfluidic
platform to save time, cost and samples, without affecting the robustness of the assay
[6]. These examples demonstrated the utmost importance of miniaturization
technologies, which have facilitated the continued advances in biological research.
According to Wölcke et al., miniaturization of assays refers to the reduction of
96-well plates assays to volumes below 10 µl [7]. To date, there are a myriad of
different miniaturization assay platforms that have been developed. Based on their
complexity and capabilities in liquid handling, we have classified them into 3 assay
platforms: (i) miniaturized well plates, (ii) array platforms, and (iii) microfluidic
platforms. The miniaturized well plates consist of smaller walled wells to reduce
assay volume [8–9]. The array platforms allow assays to be conducted on flat
functionalized surfaces with virtual wells to isolate the individual assays [10–13]. The
microfluidic platforms consist of a network of microchannels for fluidics control [14–
18]. The advantages and disadvantages of these three platforms are summarized in
Table 1.1.
15
The micro-well chip and 1536-well plates are probably the most simplified
and straight-forward miniaturization approach. They are accomplished by scaling
down the well dimensions of the conventional well plates. Such platforms are of
particularly great interest in the 1990’s because of the application of enzymatic assays
for high-throughput screening (HTS) [19]. Since these assays are mainly addition-
based (homogeneous) assays, miniaturization does not require sophisticated liquid
handling capabilities to aspirate tiny volumes of reagent from the well for rinsing.
However, in the 21st century, with the rising trend to conduct more biologically
relevant heterogeneous assays such as enzyme-linked immunosorbent assay (ELISA)
and high-content cell-based assays [20], the microwell platforms has not quite kept up
with the requirements of heterogeneous assays. Nevertheless, there have been some
successes in conducting heterogeneous assays on the 1536-well platform. Notably, the
development of the epiK
TM
has allowed for the screening of 1 million ELISA’s for
HTS [21].
Since heterogeneous assays require multiple rinsing steps in the experiment,
the ability to conduct miniaturized assays using array platforms (on a flat slide
containing an array of virtual wells) has become an attractive solution to the problems
faced by microwell users [22]. The virtual well design on microarrays facilitates
access to all the data points in a single parallel rinse. This simplifies the design of the
platform, thus reducing its cost of manufacturing. The microarray technology is
probably one of the most commercially viable miniaturization techniques because of
its simplicity for manufacturing and ease of use [23]. With the early commercial
products revolving around the applications of DNA microarrays [24], the microarray
technology has, in the recent years, evolved to include applications targeting proteins,
antibodies and tissues [11–13, 25]. Furthermore, microarray technology has been
16
applied to a range of heterogeneous assays, including ELISA and HCS assays [26–27].
However, one of the major pitfalls in the microarray platform is that the patterned
surface loses its selective hydrophobic-hydrophilic characteristics after repeated
rinsing due to surface wetting [28]. Thus, cross-contamination between the
neighboring spots needs to be accounted for when applying the array platforms.
Furthermore, conducting heterogeneous assays on the array platforms may be more
challenging as compared to that on the microfluidics platform, since the continuous
flow-through rinsing technique used in the array platforms may result in less control
of the individual spots.
Among the three different platforms, the microfluidics platform is probably
the most versatile for the miniaturization of heterogeneous assays [29]. Despite its
complexity in terms of design and fabrication, the microfluidics platform is the most
flexible in terms of adapting to the liquid handling requirements of an assay [30–32].
Unfortunately, each designed microfluidic platform can only cater to a limited variety
of assays; redesigning is required for it to cater to other varieties of assays and to
serve as a generic platform. As a result, microfluidics technology are employed
mainly in specialized laboratories with the capability to design a suitable microfluidic
assay platform for a specific assay [33].
17
Table 1.1. Classification of miniaturized assay platforms
Examples
Advantages
Disadvantages
Miniaturized
Well Plates
Walled Wells
with Small
Footprints
1. 1536 well plate
8
2. Micro-well chip
9
1. Simple, low-cost
fabrication
2. Convenient to scale
up
3. Prevents cross-
contamination between
data-points
1. Limited flexibility
in liquid handling
2. Difficult to
aspirate from wells
Microarrays
Virtual Wells
on Flat Slides
1. DNA microarray
10
2. Protein microarray
11
3. Micro-ELISA array
12
4. Cell microarray
13
1. Convenient to scale
up
2. Simplified fluidics by
single continuous flow
of reagent
1. Limited flexibility
in liquid handling
2. Difficult to retain
hydrophobic patterns
on the slide surface
throughout the assay
Microfluidics
Micro-
Channeled
Platforms
1. Lab-on-chip with
microchannels
14
2. Capillary
microfluidics
15
3. Centrifugal
microfluidic systems
16
4. Droplet-based
microfluidics
17
5. Electro-kinetic
platform
18
1. Flexible in liquid
handling of the assay
2. Prevents cross-
contamination between
data points
1. Complex in design
and fabrication
2. Inflexible to be a
generic platform
1.2 Advances in Biologically Relevant Assays for Drug Discovery
In the 21st century, there has been a growing trend to move away from
biochemical-based assays, and to apply cell-based assays for drug discovery [34].
Cell-based assays characterize a range of variables such as cell proliferation, toxicity,
motility, generation of a measurable product, and cell morphology [35–39]. Cell-
18
based assays offer a more accurate representation of the real-life model since live
cells are used, and they offer the possibility of a dynamic experiment through
monitoring the number and/or the behaviour of live cells [40].
To ensure compatibility to HTS, many of the cell-based assays developed
were mostly homogeneous assays [41]. Hence, miniaturization of homogeneous cell-
proliferation and toxicity assays remained popular in 1536-well plates [42]. In these
assays, the readout (fluorescence, absorbance or luminescence) for each data point is
the collective effect of the cells in the entire well. Thus, data processing for
homogeneous assays is convenient and relatively hassle-free. However, the
“collective readout approach” does not provide details on individual cellular behavior,
and makes it difficult to assess the accuracy of the data. Hence, there is a shift from
using homogeneous assays to using heterogeneous assays in drug discovery [43].
With the advances in molecular labeling technologies, heterogeneous assays
such as high-content screening (HCS) assays reduce false positives and negatives in
screenings through systematic build-up of individual cellular details to produce a
meaningful and representative collective data set [44]. The quality of data can be
assessed from the fluorescence staining of the tagged proteins within the cells of the
individual data points, thus allowing the troubleshooting of assays to be conducted in
a more systematic and productive manner [45]. In addition, the wide range of assays
targeting different cellular pathways offers flexibility to observe specific molecular
phenomenon based on the study [46–47]. Overall, HCS cell-based assays allow for a
more focused compound production and ensure a more meaningful screening outcome
as compared to standard homogeneous cell-based assays. Insights from these
information-rich assays could help effective drugs to be discovered more efficiently,
thus saving considerable time and expenses [41].
19
The shift in the choice of assays from biochemical-based to homogeneous
cell-based to heterogeneous cell-based assays in drug discovery is motivated by
improvement in the quality of the screens [38, 41]. Until the 1990s, the aim of HTS
was to generate as many lead compounds as possible to battle the high elimination
rate in secondary and subsequent screens. However, in recent years, drug discovery
no longer involves merely generating numerous lead compounds, rather, it strives to
improve the quality of the lead compounds generated so that more lead compounds
would eventually become commercialized drugs. To improve the quality of the lead
compounds, there has to be a shift towards heterogeneous cell-based assays as they
not only decrease false positives and false negatives, but also allow for better quality
assessment of the assays performed [34].
1.3 A Trend Towards Clinically Relevant Cell Sources for Cancer Drug
Discovery
Besides the transition in the choice of assays used for cancer drug discovery,
the choice of biological samples for drug screening evolved from using kinases to
cancer cell lines, to primary cells [48]. Pepita et al. demonstrated that primary tumor
cells are more drug-resistant as compared to cancer cell lines, thus using primary
tumor cells from human patients for cell-based assays can eliminate false positives in
the cancer drug screening [49]. Since supplies of primary tumor cells are limited, the
ability to miniaturize the popular cell-based assays for HTS becomes an attractive
long-term goal in drug discovery.
However, from mid 2000’s, the evolving cancer stem cell (CSC) theory has
brought a new perspective to cancer biology [50]. Although CSCs represent a rare
subset of cancer cells residing within the tumor, they are capable of escaping
20
chemotherapy and driving tumor growth by metastasis [51]. Hence, the treatment of
cancer has shifted its focus to target cancer stem cells. Very recently, Grupta et al.
demonstrated the feasibility to screen against CSCs by developing a cell line that
retains the drug resistance characteristics of CSCs [52]. However, the ability to probe
the CSCs in its native form without genetic alteration would ensure the relevance of
the sample and provide interesting insights to CSC biology.
Sample limitation seen in primary tumor cells is associated with their lack of
immortality, i.e. these cells would perish with time [48], whereas sample scarcity of
CSCs is due to the low prevalence of CSCs in the population of tumor cells [51]. To
date, assays still lack the ability to process limited and scarce samples such as CSCs.
With the aid of assay miniaturization, it may be possible to apply standard biological
techniques like Western blotting to these scarce samples in the future.
1.4 Developing a Niche in Assay Miniaturization
To develop biologically relevant assays to reduce the dropout rates of the
screened hits, new miniaturization techniques should allow popular heterogeneous
assays to be conducted at high throughput to increase efficiency and reduce cost.
Biological samples such as CSCs that are limited and scarce are not well-suited for
the existing miniaturization technologies. Although microfluidics platforms maximize
the number of data points, there is still a minimum quality of cells required to enable
such experiments. Similarly, cell seeding in microarray platforms are usually not
selective to the spots whereby the reactions take place, hence resulting in wastage of
precious cells [28]. The ability to utilize miniaturized assays despite sample scarcity
would offer more options to biologists for future discoveries.
21
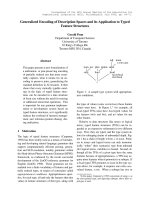
Fig. 1.1. The relationship between miniaturization, assays and samples in the 20th and
21st century. Note: → means ‘developed for’.
The relationship between miniaturization, assays and samples in the late
1990’s is very much different from today. In the late 1990’s, drug discovery was more
‘platform-centered’. It was important for samples and assays that were applied for
HTS to be economical and convenient for assay miniaturization [19]. However, in the
21st century, samples that are found to be biologically relevant to the disease type are
usually scarce and limited, hence, it would be important to develop the assay and
miniaturization platform in a way that would minimize sample usage [34].
Among the three platforms that were discussed, the microarray technique has
the best potential to handle scarce biological samples. Conventional microarray falls
short in handling scarce samples because the assay points are not self-contained after
repeated rinsing. Hence, we have developed a new microarray technique called
DropArray
TM
to ensure that each assay point is self-contained and free for access
(dispensing) at any point of the experiment. To ensure convenience of usage, this
technology is developed to be compatible with common laboratory equipment
including microscopes, plate readers, robotic dispensers and standard pipettes.
Assay
• Robust and
reliable results
• Low false
• positive/negative
Assay
• Compatible to
HTS platform
• Convenient to
miniaturize
• Duration of assay
Samples
Miniaturization
Platform
• Biologically relevant
to disease type
• Derive in limited
supply from patients
Miniaturization
Platform
Samples
•
Match assay
requirement
• In abundance
20
th
Century
21
st
Century
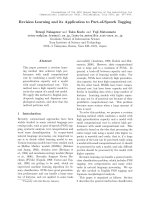
22
In the current landscape, we found most of the miniaturized assay technology
targets at increased throughput and reduced volume (Fig. 1.2). However, such
technologies are expensive to adopt, and the sophistication may not be suitable for
most standard laboratories. Hence, we have focused on creating a miniaturized assay
technology that caters to the daily use of research laboratories, i.e. lower throughput
assays at microliter scale.
Fig. 1.2. Technology landscape of the various miniaturization techniques developed.
1.5 Research Objectives
In this thesis, the goal is to develop a miniaturization assay platform,
DropArray
TM
, that allows for parallel rinsing on a flat, selectively hydrophilic-
hydrophobic patterned surface. The quality of the patterned surface should be
maintained to isolate the individual assays throughout the experiment. The approach
is then optimized for high-content cell-based assays, and the effects on the assay due
to a reduction in cell number and assay volume are investigated. Lastly, this platform
is applied toward enriching scarce cancer stem-like cells, and studying their drug
resistance characteristics.
Scale of Miniaturization (nl)
Throughput (# of
Assays on Platform)
10
4
10
3
10
2
10
1
10
0
10
-
1
Electro-
kinetics
1,536
-
well plate
Nano-
well plate
Microfluidics
Digital
microfluidics
Microarray
100 k
10 k
1 k
100
10
1
Drop-
Array
23
1.6 References
[1] M. U. Kopp, A. J. de Mello, A. Manz, Chemical amplification: continuous-
flow PCR on a chip, Science 280 (1998) 1046–1048.
[2] S. Lai, S. Wang, J. Luo, L. J. Lee, S. T. Yang, M. J. Madou, Design of a
compact disk-like microfluidic platform for enzyme-linked immunosorbent
assay, Anal Chem 76 (2004) 1832–1837.
[3] J. Liu, C. Hansen, S. R. Quake, Solving the “world-to-chip” interface problem
with a microfluidic matrix, Anal Chem 75 (2003) 4718–4723.
[4] D. Pushkarev, N. F. Neff, S. R. Quake, Single-molecule sequencing of an
individual human genome, Nat Biotechnol 27 (2009) 847–850.
[5] M. Schena, D. Shalon, R. W. Davis, P. O. Brown, Quantitative monitoring of
gene expression patterns with a complementary DNA microarray, Science 270
(1995) 467–470.
[6] J. Liu, S. Yang, C. S. Lee, D. L. DeVoe, Polyacrylamide gel plugs enabling 2-
D microfluidic protein separations via isoelectric focusing and multiplexed
sodium dodecyl sulfate gel electrophoresis, Electrophoresis 29 (2008) 2241–
2250.
[7] J. Wölcke, D. Ullmann, Miniaturized HTS technologies – μHTS, Drug Discov
Today 6 (2001) 637–646.
[8] D. Dunn, M. Orlowski, P. McCoy, F. Gastgeb, K. Appell, L. Ozgur, M. Webb,
J. Burbaum, Ultra-high throughput screen of two-million member
combinatorial compound collection in a miniaturized, 1536-well assay format.
J Biomol Screen 5 (2000) 177–187.
[9] M. Seidel, G. Gauglitz, Miniaturization and parallelization of fluorescence
immunoassays in nanotiter plates, Trends Analyt Chem 22 (2003) 385–394.
[10] J. G. Hacia, L. C. Brody, M. S. Chee, S. P. A. Fodor, F. S. Collins, Detection
of heterozygous mutations in BRCA1 using high density oligonucleotide
arrays and two-colour fluorescence analysis. Nat Genet 14 (1996) 441–447.
[11] P. Arenkov, A. Kukhtin, A. Gemmell, S. Voloshchuk, V. Chu-peeva, A.
Mirzabekov, Protein microchips: use for immunoassay and enzymatic
reactions. Anal Biochem 278 (2000) 123–131.
[12] D. L. Taylor, K. A. Giuliano, Multiplexed high content screening assays create
a systems cell biology approach to drug discovery, Drug Discov Today 2
(2005) 149–154.
24
[13] J. Kononen, L. Bubendorf, A. Kallioniemi, M. Barlund, P. Schraml, S.
Leighton, J. Torhorst, M. J. Mihatsch, G. Sauter, O. P. Kallioniemi, Tissue
microarrays for high-throughput molecular profiling of tumor specimens. Nat
Med 4 (1998) 844–847.
[14] T. Thorsen, S. J. Maerkl, S. R. Quake, Microfluidic large scale integration,
Science 298 (2002) 580–584.
[15] B. Zheng, J. D. Tice, L. S. Roach, R. F. Ismagilov, A droplet based, composite
PDMS/glass capillary microfluidic system for evaluating protein
crystallization conditions by microbatch and vapor-diffusion methods with on-
chip X-ray diffraction. Angew Chem Int Ed Engl 43 (2004) 2508–2511.
[16] D. C. Duffy, H. L. Gillis, J. Lin, N. F. Sheppard, Jr., G. J. Kellogg,
Microfabricated centrifugal microfluidic systems: characterization and
multiple enzymatic assays, Anal Chem 71 (1999) 4669–4678.
[17] S. K. Cho, H. J. Moon, C. J. Kim, Creating, transporting, cutting, and merging
liquid droplets by electrowetting-based actuation for digital microfluidic
circuits. J Microelectromech Syst 12 (2003) 70–80.
[18] T. T. Razunguzwa, J. Lenke, A. T. Timperman, An electrokinetic/
hydrodynamic flow microfluidic CE-ESI-MS interface utilizing a
hydrodynamic flow restrictor for delivery of samples under low EOF
conditions, Lab Chip 5 (2005) 851–855.
[19] G. S. Sittampalam, S. D. Kahl, W. P. Janzen, High-throughput screening:
advances in assay technologies, Curr Opin Chem Biol 1 (1997) 384–391.
[20] R. P. Hertzberg, A. J. Pope, High-throughput screening: new technology for
the 21st century, Curr Opin Chem Biol 4 (2000) 445–451.
[21] S. A. Titus, X. Li, N. Southall, J. Lu, J. Inglese, M. Brasch, C. P. Austin, W.
Zheng, Cell-based PDE4 assay in 1536-well plate format for high-throughput
screening, J Biomol Screen 13 (2008) 609–618.
[22] R. Ekins, F. W. Chu, Multianalyte microspot immunoassay. The
microanalytical “compact disk” of the future. Clin Chem 37 (1991) 1955–
1967.
[23] K. Rubenstein, The current state of the biochip business, Drug Market Dev 10
(1999) 392–396.
[24] J. G. Hacia, F. S. Collins, Mutational analysis using oligonucleotide
microarrays, J Med Genet 36 (1999) 730–736.
25
[25] L. A. Rivas, M. García-Villadangos, M. Moreno-Paz, P. Cruz-Gil, J. Gómez-
Elvira, V. Parro, A 200-antibody microarray biochip for environmental
monitoring: searching for universal microbial biomarkers through
immunoprofiling, Anal Chem 80 (2008) 7970–7979.
[26] S. M. Varnum, R. L. Woodbury, R. C. Zangar, A protein microarray ELISA
for screening biological fluids, Methods Mol Biol 264 (2004) 161–172.
[27] B. Schaack, J. Reboud, S. Combe, B. Fouqué, F. Berger, S. Boccard, O.
Filhol-Cochet, F. Chatelain, A “DropChip” cell array for DNA and siRNA
transfection combined with drug screening, Nanobiotechnol 1 (2005) 183–190.
[28] H. Zhu, M. Snyder, Protein arrays and microarrays, Curr Opin Chem Biol 5
(2001) 40–45.
[29] A. E. Kamholz, Proliferation of microfluidics in literature and intellectual
property. Lab Chip 4 (2004) 16–20.
[30] A. R. Wu, J. B. Hiatt, R. Lu, J. L. Attema, N. A. Lobo, I. L. Weissman, M. F.
Clarke, S. R. Quake, Automated microfluidic chromatin immunoprecipitation
from 2,000 cells, Lab Chip 9 (2009) 1365–1370.
[31] S. Haeberle, R. Zengerle, J. Ducrée, Centrifugal generation and manipulation
of droplet emulsions, Microfluid Nanofluid 3 (2007) 65–75.
[32] D. J. Harrison, A. Manz, Z. H. Fan, H. Ludi, H. M. Widmer, Capillary
electrophoresis and sample injection systems integrated on a planar glass chip,
Anal Chem 64 (1992) 1926–1932.
[33] J. W. Hong, S. R. Quake, Integrated nanoliter systems, Nat Biotechnol 21
(2003) 1179–1183.
[34] L. M. Mayr, D. Bojanic, Novel trends in high-throughput screening, Curr Opin
Pharmacol 9 (2009) 580–588.
[35] T. Shahian, G. M. Lee, A. Lazic, L. A. Arnold, P. Velusamy, C. M. Roels, R.
K. Guy, C. S. Craik, Inhibition of a viral enzyme by a small-molecule dimer
disruptor, Nat Chem Biol 5 (2009) 640–646.
[36] K. Doering, G. Meder, M. Hinnenberger, J. Woelcke, L. M. Mayr, U.
Hassiepen, A fluorescence lifetime-based assay for protease inhibitor profiling
on human kallikrein 7. J Biomol Screen 14 (2009) 1–9.
[37] L. T. Vassilev, B. T. Vu, B. Graves, D. Carvajal, F. Podlaski, Z. Filipovic, N.
Kong, U. Kammlott, C. Lukacs, C. Klein, In vivo activation of the p53