Development of chick chorioallantoic membrane as a biological testing membrane
Bạn đang xem bản rút gọn của tài liệu. Xem và tải ngay bản đầy đủ của tài liệu tại đây (1.37 MB, 202 trang )
DEVELOPMENT OF CHICK CHORIOALLANTOIC
MEMBRANE AS A BIOLOGICAL TESTING
MEMBRANE
TAY LI MEI, STEPHANIE
B.Sc. (Pharm.) (Hons.), NUS
A THESIS SUBMITTED FOR THE DEGREE OF
DOCTOR OF PHILOSOPHY
DEPARTMENT OF PHARMACY
NATIONAL UNIVERSITY OF SINGAPORE
2010
i
ACKNOWLEDGEMENTS
My deepest gratitude and sincere appreciation to my supervisors, Assoc. Prof. Chan
Lai Wah and Assoc. Prof. Paul Heng. Prof Chan has been the epitome of dedication
and excellence in her steadfast role as supervisor. Her care and concern was
instrumental in driving the project forward. Prof Heng’s infallible expertise and
ability to think broadly as well as his unselfish help proved to be a formidable pillar of
support, especially in ‘egg buying’! Thanks also to Dr. Celine Liew for unselfishly
sharing knowledge and ideas, her thoughtfulness and enjoyable company.
I am grateful to the National University of Singapore for the research scholarship as
well as to Assoc. Prof. Chan Sui Yung, Head of Department, Pharmacy, NUS for the
kind support of resources and facilities in the Department.
My thanks also to Ms. Teresa Ang, Ms. Wong Meiyin and Ms. Yong Sock Leng for
their technical expertise as well as the kindness they showed with regards to
instrument/consumable matters.
The camaraderie at GEANUS has provided much fun, laughter and joy during the
postgraduate years. I enjoyed the past seminars, conferences, experiments, lunches
and meetings with very pleasant companionship. I am proud to say that some
GEANUS-ians have become close friends and I value all past and present GEANUS-
ians for their support, advice as well as friendship all these years.
My friends and family deserve a big thank you for supporting me all these years in all
sorts of ways. My friends have helped to pushed me toward the finishing line. Last
not but least, my parents, to whom I owe a lifetime of debt. They have been selfless in
providing everything that they possibly can and instrumental in my acheivements. I
would not have come this far without them. This thesis is dedicated to them.
Stephanie
2010
TABLE OF CONTENTS
ii
TABLE OF CONTENTS
ACKNOWLEDGEMENTS i
TABLE OF CONTENTS ii
SUMMARY viii
LIST OF ABBREVIATIONS x
LIST OF TABLES xi
LIST OF FIGURES xii
INTRODUCTION 1
A.
T
HE THREE
R
S IN EXPERIMENTATION
2
B.
I
N VITRO AND IN VIVO MODELS
2
C.
D
RUG ABSORPTION
3
C.1.
An overview 3
C.2.
In vitro and in vivo models to assess drug absorption 4
C.3.
Advantages and limitations in the use of animal and human tissues 5
D.
T
HE FERTILIZED CHICKEN EGG AND ITS CHORIOALLANTOIC MEMBRANE
6
D.1.
An Overview 6
D.2.
The CAM 7
D.3.
Applications of the CAM 8
D.4.
Advantages and limitations of the fertilized egg and CAM as models 10
D.5.
The CAM as a model for human tissue 12
E.
T
HE LASER
D
OPPLER PERFUSION IMAGER
(LDPI) 14
E.1.
Principle of Operation 14
E.2.
Applications of the LDPI 16
E.3.
Advantages and limitations of the LDPI 18
E.4.
Assessment of drug absorption on the CAM 20
TABLE OF CONTENTS
iii
F.
I
MAGING
22
F.1.
An overview 22
F.2.
Pertinent applications, advantages and limitations 23
F.3.
Imaging studies conducted on the CAM 23
G.
I
RRITANCY
25
G.1.
An overview 25
G.2.
Irritancy assessment using the CAM 25
H.
P
ERMEATION STUDIES
27
H.1.
Franz transdermal diffusion cell 28
H.2.
Principle of operation 28
H.3.
Applications 29
H.4.
Advantages and limitations 29
H.5.
Assessment of drug permeation using the CAM 31
HYPOTHESES AND OBJECTIVES 32
A.
H
YPOTHESES
34
B.
O
BJECTIVES
34
MATERIALS AND METHODS 35
A.
M
ATERIALS
36
A.1.
CAM 36
A.2.
Blood perfusion and imaging studies 36
A.3.
Franz cell diffusion studies 38
A.3.1.
HPLC studies 38
B.
M
ETHODS
38
B.1.
Preparation of the CAM 38
B.1.i.
Full deshelling method 39
B.1.ii.
Partial deshelling method 39
B.1.iii.
Assessment of egg weight during incubation 40
TABLE OF CONTENTS
iv
B.1.iv.
Measurement of CAM thickness 40
B.2.
Assessment of vessel morphology & irritancy 40
B.3.
Investigation of egg parameters affecting blood perfusion 41
B.3.i.
Embryo Age 41
B.3.ii.
Consistency of egg temperature 41
B.4.
Investigation of influence of LDPI parameters on blood perfusion
measurement 43
B.4.i.
Amplitude 44
B.4.ii.
Threshold 44
B.4.iii.
Area of measurement 47
B.4.iv.
Distance of sample from laser head 47
B.4.v.
Scanning speed and resolution 47
B.4.
Drug studies 47
B.5.
Imaging studies 48
B.5.i.
Imaging of CAM surface 48
B.5.ii.
Image processing 49
B.5.iii.
Measurement of vessel diameter 49
B.6.
Permeation studies with the Franz diffusion cell 49
B.6.i.
Sample preparation 49
B.6.ii.
Synthetic membrane 51
B.6.iii.
CAM 51
B.6.iv.
King cobra skin 51
B.6.v.
Pig skin 52
B.6.vi.
Pig buccal mucosa 52
B.6.vii.
Pig retina tissue 52
B.6.viii.
Assembly of the Franz diffusion cell 52
B.6.ix.
HPLC analysis 54
B.6.ix.a.
Nicotine 54
TABLE OF CONTENTS
v
B.6.ix.b.
GTN 55
B.6.ix.c.
Data analysis 55
B.7.
Statistical Analysis 57
RESULTS AND DISCUSSION 58
A.
P
REPARATION OF THE
CAM 59
A.1.
Full deshelling method 59
A.2.
Partial deshelling method 61
A.3.
Egg weight with incubation time 63
A.4.
CAM thickness 64
B.
I
NFLUENCE OF
CAM
ON BLOOD PERFUSION MEASUREMENT
64
B.1.
Embryo age 64
B.2.
Egg temperature 67
C.
I
NVESTIGATION OF
LDPI
PARAMETERS ON BLOOD PERFUSION MEASUREMENTS
USING ORTHOGONAL ARRAY AND PARTIAL FACTORIAL DESIGN
69
C.1.
Univariate analysis 69
C.2.
Area of measurement 71
C.3.
Distance between sample and Doppler head 71
C.4.
Amplitude 73
C.5.
Threshold 74
C.6.
Scanning speed and resolution 75
D.
E
FFECTS OF TEST SUBSTANCES ON TISSUE MORPHOLOGY
&
IRRITANCY
77
D.1.
The CAM as a model for irritancy assessment 77
D.2.
Propranolol 80
D.3.
70% v/v Ethanol 81
D.4.
Glycerin 81
D.5.
Nicotine 82
D.6.
NMP 83
D.7.
Effects of pH and osmolality of drug solutions on irritation of the CAM 83
TABLE OF CONTENTS
vi
E.
B
LOOD PERFUSION STUDIES
85
E.1.
Indicators of vasoactivity 86
E.1.i.
Perfusion ratio 86
E.1.ii.
Diameter ratio 88
E.2.
Controls 90
E.3.
Glycerin 92
E.5.
Ethanol 96
E.6.
N-Methyl-2-Pyrrolidone 98
E.7.
Propranolol 99
E.8.
Theophylline 102
E.9.
Caffeine 103
E.10.
GTN 107
E.10.i.
Tablet dosage form 108
E.10.ii.
Injection dosage form 110
E.10.iii.
Blood perfusion in CAM veins and CAM arteries 114
E.11.
Auto-regulation of blood perfusion 115
F.
I
MAGING STUDIES
118
F.1.
Effect of test substances on vessel size 118
F.2.
Controls 118
F.3.
70 % v/v ethanol 120
F.4.
NMP 121
F.5.
Glucagon 122
F.6.
Caffeine 123
F.7.
GTN 129
F.8.
Correlation between basal blood perfusion and vessel diameter of the CAM
132
F.8.i.
Caffeine 134
F.8.ii.
GTN 136
TABLE OF CONTENTS
vii
F.9.
Diameter ratio 137
F.9.i.
Caffeine 137
F.9.ii.
GTN 138
G.
P
ERMEATION STUDIES
139
G.1.
Permeation studies with the Franz diffusion cell 139
G.2.
Influence of partition coefficient and molecular weight of drug on
permeation through the CAM 141
G.3.
Nicotine 142
G.3.i.
Synthetic membrane 142
G.3.ii.
Fresh CAM 144
G.3.ii.a
Influence of CAM thickness 144
G.3.ii.b.
Permeation properties through fresh CAM 144
G.3.iii.
Frozen CAM 149
G.3.iv.
Pig skin 150
G.3.v.
Snake skin 151
G.3.vi.
Retina tissue 152
G.3.vii.
Buccal mucosa 153
G.4.
GTN 155
CONCLUSIONS 157
REFERENCES 160
LIST OF POSTER PUBLICATIONS 185
SUMMARY
viii
SUMMARY
The chick choriollantoic membrane (CAM) is a potentially useful model that can be
used for in vivo as well as in situ studies. The use of the CAM does not pose much
ethical challenges. In addition, its relatively easy availability and consistency in
quality render it a convenient biological model for use in experiments requiring live
tissues. Furthermore, the CAM has been used as an alternative to the Draize test for
irritancy assessment. The vascularity and easy access to the CAM would allow it to be
used in vasoactive studies, whereby the extent of drug absorption can be ascertained
via change in blood perfusion as well as the change in diameter of the CAM vessels.
To date, the CAM has not been compared with other membranes in terms of
permeation profiles. This provided the impetus to conduct permeation studies with the
CAM alongside other biological membranes so as to determine which biological
membrane the CAM best represents.
This study showed that the partial deshelling method was more suitable then the full
deshelling method for preparing the CAM to investigate blood perfusion, vessel
diameter and irritancy. The egg should ideally be deshelled at embryonic age 7 days
to allow adequate maturation and to avoid damage to the fragile CAM. The CAM was
useful for assessing irritancy, which was manifested as hyperamaemia, hemorrhage
and clotting. Nicotine, glycerin and high concentrations of propranolol were found to
cause irritancy to the CAM. Measurement using the laser Doppler perfusion imager
(LDPI) was significantly affected by the amplitude and threshold settings. A software
written using Matlab was found to be more efficient than the manual method for
determining the changes in vessel diameter. Changes in vessel diameter were more
SUMMARY
ix
sensitive and reliable than blood perfusion in response to the test substances. Changes
in blood perfusion and vessel diameters with drug concentration were generally
complex due to the compensatory mechanisms of the biological system. Nevertheless,
glyceryl trinitrate was a potentially useful model drug for assessing the effects of
formulation factors on drug absorption through biological membranes. The drug
permeation studies revealed that the CAM best mimic the buccal mucosa, compared
to skin and retina. This paves the potential of the CAM for use as a “live” in vivo
model for assessing formulations for buccal delivery. Overall, the development of
CAM assays is timely as an alternative “living animal” model to reduce testing using
animals.
LIST OF ABBREBVIATIONS
x
LIST OF ABBREVIATIONS
CAM Chorioallantoic membrane
CAMVA Chorioallantoic membrane vascular assay
CV Coefficient of variance
EA Embryo age
GTN Glyceryl trinitrate
HET-CAM Hen’s egg test – Chorioallantoic membrane
HPLC High performance liquid chromatography
K
p
Permeability coefficient
LDPI Laser Doppler perfusion imager
NMP N-methyl-2-pyrrolidone
PAMPA Parallel artificial membrane permeation assay
SE Standard error
UV Ultraviolet
LIST OF TABLES
xi
LIST OF TABLES
Table 1. Comparison of composition between the CAM and human tissues 13
Table 2. Properties of model drugs used 37
Table 3. Grading system for irritation 41
Table 4. LDPI parameters studied using the orthogonal array and partial factorial
design 44
Table 5. The L25 (5
4
) Taguchi design matrix 45
Table 6. LDPI parameters studied with CAM in the univariate analysis 46
Table 7. The L25 (54) Taguchi design matrix for influence of LDPI parameters
on blood perfusion 70
Table 8. Influence of LDPI parameters investigated in accordance with an
orthogonal array design 71
Table 9. Irritation potential of various solvents and drugs 79
Table 10. pH and osmolality values of various drugs 84
Table 11. Perfusion ratio of test substances 87
Table 12. Diameter ratio of test substances 89
Table 13. K
p
values of test membranes with nicotine 145
LIST OF FIGURES
xii
LIST OF FIGURES
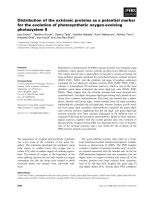
Figure 1. Structure of a fertilized chicken egg 7
Figure 2. Schematic diagram of the LDPI measurement 14
Figure 3. A representative set of readings obtained in the LDPI measurement 16
Figure 4. Deshelling methods: (a) Complete exposure of CAM by full deshelling
method and (b) Partial exposure of CAM by partial deshelling method 39
Figure 5. Photograph of the water-jacketed egg cup connected to a circulating
heated water bath 42
Figure 6. (a) Software interface (b) Binary image of vessel for determination of
vessel diameter 50
Figure 7. Photograph of the Franz cell used: (a) Clamp to hold setup in place (b)
Site for membrane placement (c) Thermostated jacket (d) Receptor
Compartment (e) Hole for introduction of test substance (f) Donor
compartment (g) Side arm for introduction of fresh medium (h) Side
arm from which samples are withdrawn (i) Magnetic stirrer 53
Figure 8. Diagram of the cross section of the Franz cell setup: (a) Clamp to hold
setup in place (b) Site for membrane placement (c) Thermostated jacket
(d) Receptor Compartment (e) Hole for introduction of test substance
(f) Donor compartment (g) Side arm for introduction of fresh medium
(h) Side arm from which samples are withdrawn (i) Magnetic stirrer 53
Figure 9. (a) Viable embryo (b) Dead embryo 60
Figure 10. Decrease in egg weight over time (n = 10) 63
xiii
Figure 11. Baseline blood perfusion in CAM at different EA. The bars represent
the standard error of the measurements. (n = 3 for each data point) 65
Figure 12. Blood perfusion readings of CAM (EA 9) over time with temperature
control of 36 – 37
0
C and without the use of temperature control
(ambient, 26 – 30
0
C) (n = 3) 68
Figure 13. The relationship between the temperature of the water bath and the
temperature of the egg cup (n = 3) 68
Figure 14. Blood perfusion readings using different measurement areas (n = 3) 72
Figure 15. Diagram of LDPI and egg cup illustrating distance between the
Doppler head and sample. 73
Figure 16. Relationship between amplitude and blood perfusion of CAM (EA 9) 74
Figure 17. Relationship between threshold and blood perfusion of CAM (EA 9) 75
Figure 18. Image data and photographs obtained with (a) low scan speed, (b)
medium scan speed, (c) high scan speed, (d) low resolution, (e) medium
resolution and (f) high resolution 76
Figure 19. Example of (a) haemorrhage and (b) embryotoxicity 80
Figure 20. Appearance of CAM (a) after the application of 30 mg/kg of
propranolol and (b) after application of 7.5 mg/kg of propranolol. 80
Figure 21. Appearance of CAM (a) before the application of 4 µg of nicotine per
egg, (b) after the application of 4µg of nicotine per egg, Vessel stasis
was present. (c) before the application of 7 µg of nicotine per egg and
(d) after application of 7 µg of nicotine per egg. Slight clotting and
hyperaemia of the vessels occurred 82
xiv
Figure 22. Change in blood perfusion ratio with time following the addition of 5
% glucose monohydrate solution at 0
min (n = 5) 91
Figure 23. Relationship of blood perfusion ratio with time with 100% glycerin
solution added at 0 min (n = 5) 93
Figure 24. Effect of 2 % w/v menthol on blood perfusion of the CAM (n = 5) 94
Figure 25. Effect of 0.1 % w/v glucagon solution on blood perfusion of the CAM
(n = 5) 95
Figure 26. Effect of 70% ethanol on blood perfusion of the CAM (n = 5) 97
Figure 27. Effect of 1 % and 10 % v/v NMP solution on blood perfusion of the
CAM (n = 5) 99
Figure 28. The relationship between blood perfusion ratio and propranolol dose
(n = 3) 102
Figure 29. Change in blood perfusion with 6 mg/kg and 10 mg/kg of caffeine
added at 0 min (n = 5) 105
Figure 30. Relationship between caffeine concentration and change in blood
perfusion (n = 5) 107
Figure 31. Blood perfusion ratios after application of GTN at time 0 min at dose
of 0.25 mg/kg (n = 5) 109
Figure 32. Relationship between square root of percentage change in blood
perfusion and GTN dose, GTN from tablet dosage form (n = 3) 112
Figure 33. Blood perfusion profile of CAM with 0.01, 0.03 and 0.05 mg/kg GTN
(n = 5) 113
Figure 34. Effect of GTN dose on blood perfusion using GTN injection (n = 5) 113
xv
Figure 35. Relationship between GTN dose and blood perfusion change in CAM
veins and arteries (n = 5) 114
Figure 36. Vessel segments measured by imaging 119
Figure 37. Vessel diameter of CAM over time (control) (n = 5) 119
Figure 38. Effect of 70% ethanol on CAM vessel diameter when added at time 0
min (n = 5) 121
Figure 39. Change in vessel diameter over time with 1 % v/v NMP application on
CAM (n = 5) 122
Figure 40. Change in vessel diameter over time after 1 mg/mL glucagon
application on CAM (n = 5) 123
Figure 41. Time study of vessel diameter in response to different caffeine doses
(n = 5) 125
Figure 42. Relationship between caffeine dose and derivatives of change in vessel
diameter 126
Figure 43. Two types of hormesis response curves (Adapted from Calabrese and
Baldwin, 2003) 128
Figure 44. Change in vessel diameter over time with 0.01, 0.03 and 0.05 mg/kg
GTN (n = 5) 130
Figure 45. Relationship between GTN dose and derivatives of change in vessel
diameter 131
Figure 46. Lack of relationship between blood perfusion and vessel diameter 133
Figure 47. Relationship between blood perfusion and vessel diameter changes
with caffeine 135
xvi
Figure 48. Relationship between blood perfusion and vessel diameter changes
with GTN. The points from left to right refer to the concentration of
0.008 mg/kg, 0.1 mg/kg, 0.15 mg/kg, 0.2 mg/kg, 0.5 mg/kg, 0.03
mg/kg, 0.05 mg/kg, 0.01 mg/kg and 0.02 mg/kg respectively 137
Figure 49. Effect of caffeine dose on perfusion ratio and diameter ratio 138
Figure 50. Effect of GTN concentration on perfusion ratio and diameter ratio 139
Figure 51. Photographs of (a) CAM in egg, (b) CAM specimen, (c) snake skin
specimen, (d) pig skin specimen, (e) pig retina and (f) pig buccal
mucosa 140
Figure 52. Permeation profiles of nicotine through different membranes (n = 3) 143
Figure 53. Average thickness of CAM at different embryo age (n = 3) 146
Figure 54. Relationship between CAM thickness and permeability coefficient 146
Figure 55. Permeation profiles of nicotine through CAM of different EA (n = 3) 147
Figure 56. Plots of EA versus K
p
for nicotine through frozen and fresh CAMs (n
= 3) 149
1
INTRODUCTION
INTRODUCTION
2
A. The three Rs in experimentation
The concept of Reduction, Refinement and Replacement was introduced in 1959. In
spite of the three Rs initiative, it is of interest to note that the number of animals used
for experiments is still on the rise (Festing, 2008). This trend has not abated even
though the number of new drug submissions has been falling over these few years
(Bhogal, 2009). Laboratory animals continue to play an important role in research,
teaching and testing (Balls, 2009). It is crucial to persist in the search for alternative
models of biological membranes in order to reduce the need for live whole animals.
There are various experimental models, and the next section will discuss some
examples that are currently employed in the pharmaceutical area.
B. In vitro and in vivo models
Numerous in vitro and in vivo test models are employed in the pharmaceutical
industry, especially in the area of drug discovery and development. In vivo models are
used in the study of pharmacological activity and toxicity, metabolism,
pharmacokinetics and mechanism of action. The contention with such in vivo models
is the ethical consideration surrounding the use of live animals. Some common live
animals used as in vivo models in experiments include rats, mice and guinea pigs.
Increasingly, there is a push towards the use of in vitro models in studies in view of
the antagonism towards animal testing. In the campaign spearheaded by Russell and
Burch in 1959 to adopt alternatives to in vivo methods, numerous in vitro concepts
have been adopted (Straughan et al., 1996). In vitro models, such as cell lines derived
from human tissues and computional programmes, do not make use of live animals.
However, the use of in vitro models is fraught with complications. The in vitro
INTRODUCTION
3
process bypasses the biotransformation processes that some drugs undergo in vivo.
Furthermore, the test compound may be required to undergo modification so as to
achieve the desired functionalities during in vitro testing, such as aqueous solubility
enhancement, which will not be suitable for an in vivo situation. As such, the results
garnered from such experiments would not be representative of the actions of the drug
in vivo (Straughan et al., 1996). It is of particular interest to look at other current in
vivo methods that take absorption, irritancy and permeation into consideration.
Knowledge of these characteristics would enable pharmaceutical companies to
appropriately tailor and improve on formulations so as to bring safe and effective drug
products into the market.
C. Drug absorption
C.1. An overview
Bioavailability of compounds is affected mainly by the absorption and metabolism
that occur in the body. The distribution and metabolism processes hinge on the
presumption that the drug is able to undergo absorption and enters the circulation of
the body. In vivo drug absorption is one of the critical parameters used to determine
bioavailability of a drug. The rate and extent of absorption of a drug from its dosage
form into the systemic circulation is known as bioavailability. Drug absorption is a
complex process which is influenced by numerous factors, including the surface area
available for absorption, physicochemical drug properties, physiological variables and
formulation factors (Pontiroli et al., 1989, Senel and Hincal, 2001, Subramanian et al.,
2004). For the oral route of administration, factors such as the constituents of the
gastrointestinal fluid, rate of gastric emptying, disease state, drug metabolism and
interaction between the drug and gastrointestinal fluid affect drug bioavailability. The
INTRODUCTION
4
ultimate therapeutic effect of the drug is a function of the plasma drug concentration.
Hence, one of the main goals of formulation studies is to enhance drug permeation
across biological membranes. In the commonly used method of evaluating drug
bioavailability, the drug is administered to an animal and its blood or urine is
collected at different time intervals for assay. A plot of drug concentration of drug
versus time is constructed and the area under the curve is used to indicate the extent of
drug bioavailability. Computational and simulation methods which make use of curve
fitting by compartmental analysis have also been employed, such as Wagner-Nelson
and the Loo Riegelman methods (Cryan et al., 2007). Permeability and solubility of a
drug can be interrelated to obtain an estimation of absorption with the maximum
absorbable dose (Burton and Tullett, 1985). A method has to be sensitive and specific
enough to accurately detect the change in blood drug level that reflects absorption,
whether it is drug concentration in blood/plasma or metabolites in the urine. Hence,
the instruments needed are relatively sophisticated and expensive.
C.2. In vitro and in vivo models to assess drug absorption
In vitro and in vivo models that have been used to assess the absorption of drugs
include animal intestines, artificial membrane, caco-2 cells (Dash et al., 2001, Hugger
et al., 2002, Mathieu et al., 1999, Walgren and Walle, 1999), cultured epithelial and
endothelial cells (Audus et al., 1990), and live animals such as rabbits (Kang and
Singh, 2005), monkeys, rats and beagle dogs (Keller et al., 2007, Pu et al., 2004). Cell
cultures are prone to contamination by microorganisms, as well as cross-
contamination with other cell types. In vitro models have the potential for high
throughput, but they do not possess biological factors such as enzymes, drug
transporters or the cellular pathways through which drugs pass. The parallel artificial
INTRODUCTION
5
membrane permeability assay (PAMPA) requires a long incubation time, which
decreases its suitability for unstable compounds (Hidalgo, 2001). Graphical
approaches to estimate human oral bioavailability from absorption, distribution,
metabolism and excretion data and a pharmacokinetic approach that integrates with in
vitro data have also been attempted (Cai et al., 2006, Mandagere et al., 2002). These
methods are simple and do not require any biological tissues. The lipid composition
of the PAMPA system can also be tailor-made to represent different lipid components
present in the gut. However, PAMPA systems are unable to assess transcellular
passive diffusion, which is the predominant route by which drugs are absorbed. The
caco-2 cell lines, although capable of high throughput, are also unable to mimic the
transport mechanisms in human tissue fully, and face the problem of inter-laboratory
variability (Dressman et al., 2008).
C.3. Advantages and limitations in the use of animal and human tissues
The methods which involve animals are not only expensive but also time consuming.
Human tissues are therefore preferred to animals but the availability of human tissues,
especially large pieces of tissue, is subject to ethical considerations. This is
particularly problematical when considerable quantities are needed. There are also
considerable ethical concerns, thus making human tissues not as easily available. In
addition, there are risks of diseases transfering to handlers of human tissues (Qvist et
al., 2000). Moral issues are also brought into play when the potential donors are
deceased, aborted human fetuses or even healthy volunteers. There is a moral
obligation to use the human tissue in an appropriate and befitting manner. In the
pursuit of alternatives, it would be ideal to have an in vivo model that is sensitive,
inexpensive and capable of high throughput to handle the large number of samples
INTRODUCTION
6
associated with formulation and related studies. Hence, the chick chorioallantoic
membrane (CAM) is potentially a good candidate for an in vivo drug absorption
model.
D. The fertilized chicken egg and its chorioallantoic membrane
D.1. An Overview
Chicken eggs (Figure 1) have been used in studies concerning developmental biology
since the 19
th
century AD. An attractive factor is its reasonable price relative to other
animal models. However, there are over 400 different breeds of chicken, with the
White Leghorn breed being the most commonly used commercially to produce eggs.
Upon fertilization, an egg takes about 20 hours from shell formation to when the egg
is laid. After the egg is laid, the cooling of its contents causes the inner egg
membrane, which is under the outer egg membrane located directly under the shell, to
contract away from the shell, resulting in the formation of an air sac. Below the air sac
is the inner egg membrane, followed by the chick chorioallantoic membrane (CAM).
The CAM, which is found in fertilized egg, is derived from the fusion of 2 extra-
embryonic membranes: chorion and allantois. The chorion and allantois start to fuse
together to form the CAM at about 4 days after the egg is laid (Romanoff, 1960). The
incubation period of the chicken egg is 21 days. The day that the egg is incubated,
which may not coincide with the day that it is laid, is known as embryonic age 0 day
(EA 0). The second day is embryonic age 1 day (EA 1), followed by embryonic age 2
days (EA 2), and so on.
INTRODUCTION
7
Figure 1. Structure of a fertilized chicken egg
D.2. The CAM
Histologically, the CAM consists of three layers: ectoderm, mesoderm and endoderm
(Fuchs and Lindenbaum, 1988). The characteristics of the three germ layers at the
10th day of incubation are as follows. The ectoderm cells are flat and aligned in a
single layer, with another one or two layers of cells beneath. The capillaries, which
were previously located in the mesoderm are now found in the ectoderm layer. The
mesoderm is an embryonic connective tissue with blood vessels passing through it.
The respiratory capillaries are located on the outermost part of the mesoderm at this
stage. The ectoderm is made up of largely cuboidal cells. Besides being a respiratory
and excretory organ, the CAM provides support to the underlying extra-embryonic
Sero-amniotic connection
Allantois
CAM
Outer
shell
membrane
Shell
Embryo
Amnion fluid
Extraembryonic
body cavity
Amnion
Albumen
Yolk
Allantoic
fluid
Air
space
Inner shell
membrane
INTRODUCTION
8
blood vessels such as the vitelline vessels found on the surface of the yolk. The CAM
is also involved in the transport of sodium and chloride ions from the allantoic sac
which is located close to the amnion sac, and calcium from the eggshell to the
vasculature. Through dilation of the associated blood vessels (known as
chorioallantoic vessels), the embryo is able to avoid overheating for a relatively long
time (Valdes et al., 2002, Burggren et al., 2004). The CAM is supplied with blood by
the allantoic artery which stems from the chick embryo (Hochel et al., 1998). The
CAM capillaries are known as the 1
st
order vessels. These vessels merge to form 2
nd
order vessels. Subsequently, 2
nd
order vessels merge to form 3
rd
order vessels. The
CAM is sensitive to changes in oxygen tension and develops inflammatory responses
to a number of irritants (Staton et al., 2009).
D.3. Applications of the CAM
As the CAM is thin and transparent, the highly vascular structures located within can
be easily seen. Hence, it was employed in vasoreactivity studies (Dunn et al., 2005).
The vascularity of the CAM allows it to be used as a model to assess damage to the
vasculature. It was used to assess the damage to vessels induced by phototherapy
(Chin et al., 2004, Kelly et al., 2005, Hammer-Wilson et al., 2002, Saw et al., 2005b,
Saw et al., 2005c) and neovascularization (Dimitropoulou et al., 1998, Lewis et al.,
2006, Patan et al., 1997, Pegaz et al., 2006, Romanoff, 1967). Its immature immune
system allows it to be used in irritancy testing. It was used in irritation studies as an
alternative to the Draize test (Curren and Harbell, 2002, Daston and McNamee, 2005,
Harvell and Maibach, 1998, Lagarto et al., 2006, Vinardell and Garcia, 2000) and also
in the evaluation of inflammatory and growth responses to biomaterials, implants,
smoke and contaminants (Cobb et al., 2003, Klueh et al., 2003, Melkonian et al.,