Integrated platinum carbon nanotube based electrocatalyst for high efficiency proton exchange membrane fuel cells 3
Bạn đang xem bản rút gọn của tài liệu. Xem và tải ngay bản đầy đủ của tài liệu tại đây (10.83 MB, 20 trang )
63
Chapter 3 In situ Grown CNTs on Carbon Paper
3.1 Introduction
This chapter mainly focuses on the CVD synthesis method for the in situ CNT
growth on carbon paper as well as the structural and compositional properties of the in
situ grown CNTs. These in situ grown CNTs were synthesized directly onto carbon
paper to serve as both the gas diffusion layer and catalyst layer simultaneously to
provide high porosity and surface area for PEMFC electrodes. Comparing with other
CNT growth methods, the general thermal CVD technique was chosen to grow the
CNTs for its ease of being scaled-up and relatively low growth temperature [1]. The
aim of this work was to optimize the synthesis process for CNTs grown on carbon
paper, in order to enhance the effectiveness of CNTs as integrated GDL and CL for
PEMFC applications.
Previously, several research groups intended to grow CNTs directly onto carbon
paper as catalyst support for PEMFC applications [2-5]. In 2004, Wang and
coworkers first proposed the idea of in situ growth of CNTs on carbon paper via a
CVD process [2]. They electrodeposited Co catalysts for CNT growth on one side of
carbon paper by a three-electrode DC method in a 5 wt% CoSO
4
and 2 wt% H
3
BO
3
solution at room temperature. It was found that the Co catalysts were selectively
deposited on the side of the carbon paper facing the electrolyte solution, due to the
high hydrophobicity of the carbon paper. This one-side Co deposition allowed the
selective growth of CNTs on one side of carbon paper. To grow CNTs on carbon
paper, the Co coated carbon paper was placed in a CVD furnace at ambient pressure
and heated to 550 °C in 3 h under a 150 sccm N
2
flow and 7.5 sccm H
2
flow. The
64
carbon paper was maintained at these conditions for 30 min and then subjected to
CNT growth under a C
2
H
2
flow of 7.5 sccm at 700 °C for 1 h. This growth process
was rather time-consuming for its long heating conditioning. In addition, it was
observed that the in situ grown CNTs via this process showed a very low density on
the carbon paper, probably due to the low Co loading obtained by the
electrodeposition method. In their progressive work [3], they used Co−Ni bimetallic
catalysts synthesized via similar electrodeposition process to improve CNT growth.
However, the in situ grown CNTs were still not dense enough thus an additional
VXC72R-based gas diffusion layer was applied on the backside of the CNT-based
electrode to enhance electrode hydrophobicity. Later in 2006 Villers et al. [4] also
reported their results of in situ grown CNTs on carbon paper as catalyst support. In
their study, Co−Ni bimetallic catalysts were obtained by dipping the carbon paper into
a mixture of ethanol (93vol%), water (6vol%) and silane (1vol%) solution containing
0.3 M Ni(NO
3
)
2
and 0.3 M Co(NO
3
)
2
for 2 h. During the CNT growth, the carbon
paper was heated at 600 °C for 2 min at 350 sccm Ar and 1.5 sccm H
2
flow to obtain
Co−Ni nanoparticles. Then the temperature was increased to 800 °C for 6 min for
CNT growth under a C
2
H
4
flow of 16 sccm. This method was more time-effective;
however, it was found that the in situ grown CNTs were generally straight covering
on carbon fibers that a VXC72R-based gas diffusion layer was still necessary for the
CNT-based electrode to provide adequate gas diffusion porosity. In a more recent
study by Saha et al. [5], a similar growth process was used to grow CNTs on carbon
paper at 800 °C for 10 min under a gas flow of 90% Ar, 5% H
2
and 5% C
2
H
4
also
catalyzed by Co−Ni nanoparticles. It is noteworthy that the morphology of their in
situ grown CNTs also showed a dendrite pattern that they could not provide sufficient
porosity and an additional GDL is always needed on the backside of the carbon paper.
65
Although these in situ grown CNTs in previous studies may provide an advance as
catalyst support for their high surface area, the overall effectiveness of their synthesis
process and their porous morphology still require considerable optimization work for
their applications in PEMFC electrodes.
In this study, the in situ growth of CNTs on carbon paper was carried out via a
general thermal CVD process using sputtered metal thin films as growth catalyst.
Contrary to previous studies where metal catalysts were deposited by wet chemical
reduction methods, the sputtered metal catalysts were directly deposited onto the
carbon paper surface and the catalyst loading could be easily controlled regardless of
the high inertness of the carbon fibers. In order to obtain in situ grown CNTs with
high surface area and high porosity, a series of optimization studies were conducted
on the influence of different growth conditions, including type of catalyst metal,
sintering of catalyst, growth temperature, catalyst loading, growth duration and flow
rate of C
2
H
4
. Results will be demonstrated and discussed in the following section.
3.2 Optimization of Growth Condition
In this section, the experimental optimization studies on growth conditions for in
situ grown CNTs will be mainly depicted based on the structure and morphology of
the as-grown CNTs on carbon paper. A series of growth conditions were investigated
on their influence toward the structure and morphology of the in situ grown CNTs to
obtain a CNT-modified carbon paper surface with high surface area and high porosity.
66
3.2.1 Type of Catalyst Metal
At the beginning of this study, transition metals Fe, Co and Ni were chosen as
growth catalysts due to their high catalytic activity for CNT growth extensively
reported in previous studies. The catalyst metals were deposited onto carbon paper
separately by direct sputtering without any wet chemical process. The sputtering
conditions were fixed at a 100 W output power and 10 mTorr Ar pressure. For each
metal catalyst, the catalyst loading was controlled at around 16−18 nm in nominal
thickness determined by measuring corresponding film thickness based on
simultaneous deposition on Si wafers. The metal coated carbon paper was then
transferred to the furnace CVD system for CNT growth. Initially the CNT growth
process was carried out under conditions similar to those of the process reported by
Saha et al. [5]. The system was firstly heated up to 750 °C at the rate of 15 °C min
-1
under a carrier gas flow of 100 sccm Ar + 5vol% H
2
. Afterwards, 10 sccm C
2
H
4
was
introduced as the carbon feedstock gas when the temperature was maintained at
750 °C. After 1 h CNT growth the system was cooled down to room temperature
under the same carrier gas.
To evaluate the influence of metal catalyst type on the CNT growth, SEM
images of the as-grown CNTs were investigated as shown in Fig. 3.1. As can be seen
in Fig. 3.1, successful CNT growth was obtained from all the metal catalysts that were
sputter-deposited on the carbon paper. However, the as-grown CNTs showed different
structure and morphology when Fe, Co and Ni were individually used as the growth
catalyst. In Fig. 3.1 (a) and (a’), it was observed that a dense CNT layer was formed
when a thin layer of Fe catalysts were sputter-deposited on the carbon paper. The in
situ grown CNTs had a relatively small size distribution range and little amorphous
67
carbon was observed in the CNT layer. By contrast, although the CNTs produced by
Co and Ni catalysts had a smaller diameter and more curly structure, the in situ grown
CNTs showed a notably lower density that the CNT layer could not fully cover the
Fig. 3.1 SEM images of CNTs grown on carbon paper with (a)&(a’) sputtered Fe
catalysts, (b)&(b’) sputtered Co catalysts, and (c)&(c’) sputtered Ni catalysts. Growth
temperature: 750 °C; growth duration: 1 h; catalyst loading: 16-18 nm thin film; C
2
H
4
flow rate: 10 sccm.
(c)
(b)
(c’)
(b’)
(a)
(a’)
68
carbon paper surface, in comparison with the Fe catalyzed growth. In addition, a
considerable amount of amorphous carbon was observed for both Co and Ni catalyzed
growth (see Fig. 3.1 (b’) and (c’)). Accordingly, we conducted the following
optimization experiments solely based on Fe catalysts.
3.2.2 Growth Temperature
After determination of catalyst type, further optimization studies were carried out
by examining the effect of growth temperature for CNT growth. According to
previous studies described in Section 3.1, the growth temperatures for the in situ
grown CNTs on carbon paper were mostly in the range from 700 °C to 800 °C. To
optimize the growth temperature for in situ CNT growth, a series of growth processes
were carried out at 700 °C, 750 °C and 800 °C, respectively. As shown in Fig. 3.2, in
situ grown CNTs are rarely seen on the carbon papers grown under 700 °C and
800 °C, in contrast to those grown under the initial growth temperature of 750 °C. As
CNT growth temperature is associated to the type of carbon feedstock used, the
unsuccessful CNT growth at 700 °C and 800 °C can be attributed to the fact that
700 °C may not be high enough to effectively activate the dissolution of C
2
H
4
into Fe
catalysts, limiting the CNT growth as well as the carbon graphitization (see Fig. 3.2
(a)). On the other hand, at a high growth temperature of 800 °C, thermal pyrolysis of
C
2
H
4
would take place to form amorphous carbon before it dissolves into Fe catalysts
to form CNTs, thus it can be observed in Fig. 3.2 (c) that even fewer CNTs were
obtained at this growth temperature compared with those grown at a lower
temperature of 700 °C. Contrarily, the CNTs grown at 750 °C showed a vigorous
growth that the carbon paper surface was completely covered by a dense CNT layer
69
(see Fig. 3.2 (b)). Therefore the growth temperature was fixed at 750 °C throughout
the subsequent experiment in this study.
3.2.3 Growth Duration
When the optimum growth temperature was determined as 750 °C, the effect of
growth duration was investigated afterwards. In the above CNT growth processes, the
growth processes were all initially carried out based on one-hour growth duration. It
was presumed that growth duration is also an important factor for effective CNT
growth thus an optimum growth duration is in need to explore for the in situ grown
CNTs. To attain this important parameter, four in situ CNT growth processes were
(a)
(b)
(c)
Fig. 3.2 SEM images of in situ CNT growth at (a) 700 °C, (b) 750 °C and (c) 800 °C.
Growth duration: 1 h; Fe catalyst loading: 4 min sputter-deposition; C
2
H
4
flow rate:
10 sccm.
70
performed under a series of growth periods: 15 min, 30 min, 1 h and 2 h. All the
carbon papers were coated with 4 min sputter-deposited Fe catalysts and the flow rate
of C
2
H
4
was set at 10 sccm. The growth temperature was 750 °C, in accordance with
previous optimization results. The SEM images of the as-grown CNTs are shown in
Fig. 3.3 to reveal the effect of duration scale on CNT growth. It can be clearly seen
that the density of the in situ grown CNTs increased with growth duration from 15
min to 1 h whereas such density increase was not so obvious when the growth
duration was further raised to 2 h. This tendency may probably be due to the CNT
growth limit when the catalysts have lost their activity by being capsuled within the
CNTs [8]. Accordingly, the optimum growth duration was determined as 1 h.
Fig. 3.3 SEM images of CNTs grown under growth duration of (a) 15 min, (b) 30 min,
(c) 1 h and (d) 2 h. Growth temperature: 750 °C; Fe catalyst loading: 4 min sputter-
deposition; C
2
H
4
flow rate: 10 sccm.
(c)
(a) (b)
(d)
71
3.2.4 Catalyst Loading
The effect of Fe catalyst loading was investigated after the growth temperature
and duration had been optimized. In the previous growth processes shown above, all
the Fe-coated carbon papers were obtained via a 4 min sputter-deposition of Fe
catalysts, which corresponds to a thin Fe film of 16−20 nm on a flat substrate. The
specific sputtering rate was thus determined to be 4−5 nm min
-1
, according to the film
thickness measurement by a surface profiler (Alpha-Step
@
500). In order to
investigate the influence of catalyst loading on the CNT growth, a series of Fe-coated
carbon paper were prepared by subjecting them to different sputtering duration,
including 2 min, 4 min, 6 min and 8 min Fe sputter-deposition. The SEM images of
the in situ grown CNTs from these catalyst loadings are illustrated in Fig. 3.4. It can
be clearly seen that the different loadings of Fe catalysts resulted in different structure
and morphology of the in situ grown CNTs. Comparing the results from 2, 4, 6 and 8
min sputter-deposited Fe catalysts, it was found that CNTs grown from 4 min Fe
catalyst were the most dense and uniform in structure and were comparatively longer
and more curly to form a CNT network whereby the surface area and porosity of the
carbon paper surface was greatly enhanced (see Fig. 3.4 (b)). For the 2 min Fe
catalyst, the as-grown CNTs showed relatively smaller size and similar morphology
as those from the 4 min Fe catalyst, whereas the growth was not uniform that some
fibers were barely covered with CNTs as shown in Fig. 3.4 (a). Given that the carbon
paper made of networks of carbon fibers has a high surface roughness, the thickness
of the Fe catalysts sputter-deposited on carbon papers was considerably smaller than
that on flat substrates. It is very likely that the 2 min sputter-deposition of Fe catalyst
was not adequate to evenly disperse on the rough carbon paper surface, resulting in an
uneven CNT growth (see Fig. 3.4 (a)). For the 6 min catalyst (see Fig. 3.4 (c)), it is
72
notable that the CNTs tended to grow in a bigger diameter and had a large size
distribution range. Moreover, the in situ grown CNTs showed a visibly smaller length,
which is probably due to the larger Fe particles formed as a result of the higher
catalyst loading. This phenomenon agrees very well with the theory that CNT growth
rate is roughly proportional to the inverse of CNT diameter. When the catalyst
loading further increased to 8 min sputter-deposition, the CNT growth seemed
impeded and a considerable amount of amorphous carbon was present on the carbon
paper surface (see Fig. 3.4 (d)). This result can be attributed to the thick catalyst layer
deposited on the carbon paper surface that the formation of Fe nanoparticles was
hindered to catalyze the CNT growth. As such, the optimum catalyst loading for the
Fig. 3.4 SEM images of CNTs grown from different Fe catalyst loadings obtained by
(a) 2 min, (b) 4 min, (c) 6 min and (d) 8 min sputter-deposition. Growth temperature:
750 °C;
g
rowth duration: 1 h; C
2
H
4
flow rate: 10 sccm.
(a) (b)
(c)
(d)
73
in situ CNT growth was found to be a 4 min sputter-deposition process for Fe,
corresponding to a thin Fe film with thickness of 16−20 nm on a flat substrate.
3.2.5 Flow Rate of C
2
H
4
Last but not least, besides investigation on growth temperature, growth duration
and Fe catalyst loading, a set of CNT growth processes were performed under
different C
2
H
4
input by varying the C
2
H
4
flow rate, to examine its effect on CNT
growth. The flow rate of carbon feedstock gas was reported to be one of the most
important factors that determine the structure and morphology of CNTs grown via
CVD technique [9]. In this study, a series of C
2
H
4
flow rates of 5 sccm, 10 sccm, 15
sccm, 20 sccm and 25 sccm were investigated to reveal their influence on CNT
growth, respectively. Other growth parameters, such as growth temperature, growth
duration and Fe catalyst loading, were fixed according to the aforementioned
optimization studies. The SEM images of the in situ grown CNTs at different C
2
H
4
flow rate are shown in Fig. 3.5.
As shown in Fig. 3.5 (a), prior to CNT growth the pristine carbon paper showed a
weave structure with straight graphite fibers entangling together, where large holes
and gaps were observed. While after the carbon papers experienced an optimized
growth process based on the above optimization studies, they were all fully covered
by a thick CNT layer whereby the holes and gaps were filled by the dense CNTs.
However, it is noticeable that the CNT layers grown under different C
2
H
4
flow rate
appeared dissimilar from each other in their structure and morphology. With
increasing C
2
H
4
flow rate, it can be clearly seen that the as-grown CNTs on carbon
paper tended to grow comparatively larger in length and smaller in diameter.
74
Moreover, as the C
2
H
4
flow increased, the in situ grown CNTs exhibited a more curly
structure and they twisted together to form a highly porous CNT layer with little
amorphous carbon impurities present. When the C
2
H
4
flow increased up to 25 sccm
(see Fig. 3.5 (f)), it can be observed that the pore size of the CNT layer reduced to
(a)
(b)
(c)
(d)
(e)
(f)
Fig. 3.5 SEM images of (a) pristine carbon paper, and CNTs grown under C
2
H
4
flow rate
of (b) 5 sccm, (c) 10 sccm, (d) 15 sccm, (e) 20 sccm and (f) 25 sccm. Growth
temperature: 750 °C; growth duration: 1 h; Fe catalyst loading: 4 min sputter-deposition.
75
much less than 1um and its porosity was greatly enhanced with regard to that of the
pristine carbon paper. Unlike previous studies where sparse or straight CNTs were
vertically grown on carbon fibers [2-5], the CNT layer grown via the optimized CVD
process at a high C
2
H
4
flow rate above 15 sccm demonstrated extremely high density
and high porosity by curling and coiling together. It indicated that increasing the flow
ratio of carbon feedstock gas/carrier gas may lead to a faster CNT growth rate as well
as a stimulated lateral growth for the CNTs to convolve with each other. As a result, a
dense CNT layer with mesoporous structure was obtained on the carbon paper, and
the carbon paper surface was modified by the dense CNT layer with tremendously
enhanced surface area and porosity. This improvement in surface structure and
morphology is particularly favorable for PEMFC electrodes as it can provide greatly
refined gas diffusion channels, as well as a large increment of surface area for Pt
deposition, thus yielding a considerably enlarged reaction area. However, the
optimum C
2
H
4
flow rate could not be determined solely based on the structure and
morphology of the as-grown CNTs, in situ electrochemical evaluation is necessary to
examine their influence on PEMFC performance, which will be demonstrated and
discussed in the next chapter.
3.3 Characterization of in situ Grown CNTs
Before carrying out in situ electrochemical evaluation on the in situ grown CNTs,
physical characterizations such as BET surface area measurement and Raman
spectroscopy were performed on the CNTs grown at different C
2
H
4
flow rate as
shown in Section 3.2.6. The BET surface area measurement was used to reveal the
surface area increment of the CNT-modified carbon paper. Raman spectroscopy was
also used to provide compositional analysis of the in situ grown CNTs. These
76
0 5 10 15 20
0.0
0.5
1.0
1.5
2.0
2.5
3.0
3.5
BET surface area / m
2
g
-1
C
2
H
4
flow rate / sccm
investigations on the physical properties of the in situ grown CNTs may help us
understand better towards the integrated CNT-grown carbon paper as a potential
electrode component for PEMFC applications.
3.3.1 BET Surface Area of in situ Grown CNTs
In this study, BET surface area measurement was performed on different CNT-
grown carbon papers obtained at a series of C
2
H
4
flow rates. Experimental details are
described in Section 2.3.2. Pure nitrogen was used as the adsorbate gas. In order for
comparison, a pristine carbon paper was also measured for its BET surface area as a
reference. The surface areas of the CNT-grown carbon papers obtained from different
C
2
H
4
flow rate are illustrated in Fig. 3.6, in which the trend in surface area change
with C
2
H
4
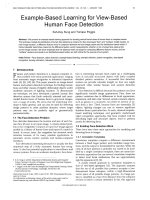
flow rate can be clearly observed. As shown in Fig. 3.6, the surface area of
the pristine carbon paper was increasingly enhanced by the CNTs grown under
increasing C
2
H
4
flow rate. This result is expectable in that the in situ grown CNTs
Fig. 3.6 BET surface area of pristine carbon paper and CNT-grown carbon papers
grown at C
2
H
4
flow rate of 5 sccm, 10 sccm, 15 sccm, and 20 sccm.
77
showed higher density and smaller size from 5 sccm to 25 sccm C
2
H
4
flow rate as
demonstrated in the SEM images in Section 3.2.6. However, it was found that the
surface area of the CNT-grown carbon paper from 25 sccm C
2
H
4
flow rate could not
be obtained due to the poor adsorption of N
2
on the CNT surface. It is likely that the
poor N
2
adsorption may stem from the inert graphitic surface of the CNTs grown at
25 sccm C
2
H
4
flow rate [10].
Table 3.1 gives the surface area of the CNT-grown carbon paper obtained at
corresponding C
2
H
4
flow rate, as well as the weight ratio of the as-grown CNT layer
to the carbon paper. As can be seen in Table 3.1, the surface area of the pristine
carbon paper almost increased 10 times from 0.37 m
2
g
-1
to 3.16 m
2
g
-1
when a CNT
layer was grown onto it at a 20 sccm C
2
H
4
flow rate. As the weight ratio of the as-
grown CNT layer to the carbon paper was approximately around 1−2%, it was
assumed that the surface area of the carbon paper is negligible compared to that of the
in situ grown CNTs. Thus the surface area of the in situ grown CNTs can be estimated
by dividing the surface area increment of the CNT-grown carbon paper by their
weight ratio to the pristine carbon paper. The corresponding values of the estimated
surface areas of the CNTs grown at different C
2
H
4
flow rate are listed in Table 3.1.
According to this approximation, the surface area of the in situ grown CNTs at 20
sccm C
2
H
4
flow rate is up to 176.58 m
2
g
-1
, which is slightly lower to the typical
surface area (250 m
2
g
-1
) of carbon black VXC72R. The large surface area of the in
situ grown CNTs suggests that the CNT layer grown on carbon paper may be a
promising catalyst support material for the subsequent Pt sputter-deposition.
78
Sample 0 5 sccm 10 sccm 15 sccm 20 sccm
Surface area of
CNT-grown carbon
paper / m
2
g
-1
0.37 0.79 1.54 1.87 3.16
Weight ratio of
CNT to carbon
paper
− 1.04% 1.19% 1.24% 1.58%
Estimated surface
area of in situ grown
CNTs / m
2
g
-1
− 40.38 98.32 120.97 176.58
3.3.2 Raman Spectra of in situ Grown CNTs
Normalized Raman spectra of carbon black VXC72R, carbon paper TGPH090
and the in situ grown CNTs at different C
2
H
4
flow rate were obtained to probe the sp
2
(ordered) and sp
3
(disordered) hybridized C Raman peaks of these carbon materials,
which are shown in Fig. 3.7. In Raman spectra of carbon materials, typically, the G
band corresponds to sp
2
hybridization of the ordered graphite state, whereas the D and
D´ band are derived from the disorder-induced features of the carbon structure due to
the finite particle size effect or lattice distortion [11, 12]. As shown in Fig. 3.10, the
Raman spectra of the in situ grown CNTs at different C
2
H
4
flow rate all revealed a
typical Raman peak pattern of multi-walled carbon nanotubes, in which two
characteristic peaks representing the D band and the G band were notably identified at
1345 and 1581 cm
-1
Raman shift [13]. The D´ band was also observed around 1615
cm
-1
, exhibited as a broadened G band. By contrast, the commercial carbon black
VXC72R showed relatively small D and G peaks, suggesting that the graphite content
of this carbon support material was very low. In addition, the Raman shift of the
Table 3.1 Estimated BET surface areas of the in situ grown CNTs obtained
from C
2
H
4
flow rate of 5 sccm, 10 sccm, 15 sccm and 20 sccm.
79
1000 1200 1400 1600 1800 2000
CNT (15 sccm)
CNT (10 sccm)
CNT (5 sccm)
CNT (20 sccm)
Intensity / a.u.
Raman shift / cm
-1
D band
G band
CNT (25 sccm)
VXC72R
carbon paper
D' band
carbon paper TGPH090 showed a sharp G band peak at 1581 cm
-1
and a low D band
peak, indicating a highly graphitized structure of the carbon fibers making up the
carbon paper.
A more in-depth compositional analysis on the in situ grown CNTs was carried
out by calculating the D-to-G band intensity ratio I
D
/I
G
, as listed in Table 3.2. The D-
to-G band intensity ratio I
D
/I
G
is commonly used as an effective means to estimate the
graphitization of CNTs [14]. It was found that the CNTs grown at C
2
H
4
flow rate
from 5 sccm to 20 sccm showed high I
D
/I
G
values approximately in the range from
1.6−1.7. This result reveals that the in situ grown CNTs on carbon paper consisted of
a large portion of disordered sp
3
state on the CNT surface. The high I
D
/I
G
ratio may
mainly be attributed to the defects formed during CNT growth. According to Hull’s
study where Raman spectra of sonochemically oxidized CNTs were inspected [14], it
Fig. 3.7 Raman spectra of carbon black VXC72R, carbon paper TGPH090, and in situ
grown CNTs at C
2
H
4
flow rate of 5 sccm, 10 sccm, 15 sccm, 20 sccm and 25 sccm.
80
was found that the I
D
/I
G
ratio of the CNTs was increased from 1.02 to 1.25 with
increasing oxidation time. It was also revealed in their study that a direct correlation
existed between the uptake of the relative D-to-G band intensity and the density
growth of various functional groups on an oxidized CNT surface with increasing
treatment time. Therefore they reported that the amount of disordered carbon
increases with the severity of surface oxidation. Based on their results, it is likely that
the highly disordered carbon-contained surface of the in situ grown CNTs may be
able to provide a stable Pt-CNT interface for direct Pt deposition without additional
surface oxidation. By contrast, the pristine carbon paper showing high graphitization
was reported to have a large surface tension and was thus difficult to coat with small
metal catalyst particles via electrodeposition. On the other hand, it was noted that the
CNTs grown at 25 sccm C
2
H
4
flow rate had a comparatively low I
D
/I
G
value of 1.41,
suggesting that the in situ grown CNTs have higher ordered sp
2
carbon content. This
may explain the poor N
2
adsorption of this sample during the BET surface area
measurement depicted in the last subsection, which was assumed as the consequences
of the inert graphitic surface of the CNTs grown at 25 sccm C
2
H
4
flow rate.
Sample 5 sccm 10 sccm 15 sccm 20 sccm 25 sccm
I
D
/I
G
ratio
1.71 1.65 1.55 1.63 1.41
Table 3.2 D-to-G band intensity ratio I
D
/I
G
of the in situ grown CNTs obtained from
C
2
H
4
flow rate of 5 sccm, 10 sccm, 15 sccm, 20 sccm and 25 sccm.
81
3.4 Summary
In this chapter, a systematic study on the growth conditions for in situ grown
CNTs on carbon paper is demonstrated. A set of optimized parameters have been
obtained based on the structure and morphology of the CNTs grown under a series of
types of growth conditions (see Table 3.3). After the optimized growth process, the
carbon paper surface was fully covered by a dense CNT layer with enhanced surface
area and porosity. In addition, the in situ grown CNT layers on carbon paper showed
tunable diameter and surface porosity at different C
2
H
4
flow rate. BET surface area
characterization demonstrated that the in situ grown CNT layer had a much larger
surface area than that of the pristine carbon paper. Raman spectroscopy indicated that
the in situ grown CNTs had a large amount of defects on surface, which may provide
various anchoring sites for Pt catalysts. In view of these favorable properties, the CNT
layer grown on carbon paper is proposed as a promising candidate to serve as both gas
diffusion layer and catalyst layer simultaneously for PEMFC electrodes.
Growth
condition
Catalyst type
Growth
temperature
Growth
duration
Catalyst
loading
Optimized
parameter
Fe thin film by
sputtering
750 °C 1 h
16−20 nm on
Si wafer
Table 3.3 Optimized growth conditions for the in situ grown CNTs on
carbon paper via CVD growth process.
82
References
[1] W. Z. Li, D. Z. Wang, S. X. Yang, J. G. Wen, and Z. F. Ren, Chem. Phys. Lett.,
335, 141 (2001).
[2] C. Wang, M. Waje, X. Wang, J. M. Tang, R. C. Haddon, and Y. S. Yan, Nano
Lett., 4 (2), 345 (2004).
[3] X. Wang, M. Waje, and Y.S. Yan, Electrochem. Solid-State Lett., 8, A42 (2005).
[4] D. Villers, S. H. Sun, A. M. Serventi, J. P. Dodelet, and S. Dsilets, J. Phys. Chem.
B, 110 (51), 25916 (2006).
[5] M. S. Saha, R. Li, and X. Sun, J. Power Sources, 177, 314 (2008).
[6] C. L. Cheung, A. Kurtz, H. Park, and C. M. Lieber, J. Phys. Chem., B106, 2429
(2002).
[7] O. A. Nerushev, S. Dittmar, R. E. Morjan, F. Rohmund, and E. E. B. Campbell, J.
Appl. Phys., 93, 4185 (2003).
[8] A. Gohier, C. P. Ewels, T. M. Minea, and M.A. Djouadi, Carbon, 46, 1331 (2008).
[9] Z. Y. Juang, J. F. Lai, C. H. Weng, J. H. Lee, H. J. Lai, T. S. Lai, and C. H. Tsai,
Diamond Relat. Mater., 13, 2140 (2004).
[10] E. Dujardin, T. W. Ebbesen, H. Hiura, and K. Tanigaki, Science, 265, 1850
(1994).
[11] V. Barbarossa, F. Galluzzi, R.Tomaciello, and A. Zanobi, Chem. Phys. Lett., 185,
53 (1991).
[12] G. Vitali, M. Rossi, M. L. Terranova, and V. Sessa, J. Appl. Phys., 77, 4307
(1995).
[13] W. Li, H. Zhang, C. Wang, Y. Zhang, L. Xu, K. Zhu, and S. Xie, Appl. Phys.
Lett., 70 (20), 2684 (1997).
[14] R. V. Hull, L. Li, Y. Xing, and C. C. Chusuei, Chem. Mater., 18, 1780 (2006).