Modifiers of inflammatory angiogenesis in a murine model 3
Bạn đang xem bản rút gọn của tài liệu. Xem và tải ngay bản đầy đủ của tài liệu tại đây (1.67 MB, 90 trang )
74
CHAPTER III RESULTS
3.1 Introduction of corneal and skin injury models
3.1.1 Angiogenesis in the corneal injury model
The corneal injury model has been used to investigate angiogenesis (Azar 2006). In this
study, we have been able to standardize the extent of injury to allow for a fairly consistent
angiogenic response on the cornea. The corneal angiogenesis in BALB/c mice is shown in
Figure 3.1. After 24 hours, the pre-existing vessels vasodilated and corneas became cloudy.
By 72 hours, the sprouts lengthened and multiplied to produce a rich anastomosing plexus.
72 hours to 5 days vascular sprouts elongated and matured, and the cloudiness of cornea
diminished. The angiogenesis reached a peak at day 5 after injury and the vascular sprouts
reached the injured sites. From day 7 regression started, and new vessels began to fade. Our
results are consistent with those reported by Burger et al (1983) and Sunderkötter et al.
(1991). Based on the current data, we have been able to establish that the angiogenesis
response is the highest at day 5 after injury.
3.1.2 Sexual dimorphism in the corneal and skin injury model
To reduce potential variation in experiments, the differences in angiogenesis and skin wound
healing were observed between BALB/c male and female mice. The present study shows
that the degree of corneal angiogenesis in female mice was significantly greater than that in
75
male mice (Fig. 3.2). In contrast there was no significant difference in skin wound healing
between male and female mice (Fig 3.3). However, skin wound healing in female mice
tended to close faster than male mice at days 3, 5 and 7 after injury. As such, only female
mice were used in all the subsequent experiments to establish the corneal and skin injury
models.
76
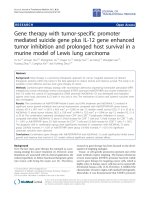
Fig. 3.1 Angiogenesis response in the corneal injury model
The time course of angiogenesis response in the cornea of BALB/c mouse before injury (a),
0.5 hours (b), 1 day (c), 3 days (d), 5 days (e) and 7 days (f) after injury.
77
A
0
0.5
1
1.5
2
2.5
Neovasculized Area (mm
2
)
Female male
**
B
0.4
0.6
0.8
Vessel Length (mm)
Female Male
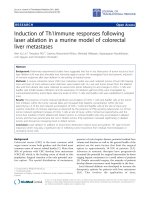
Fig. 3.2 Comparisons of corneal angiogenesis between BALB/c female and male mice
Quantitive analysis of neovascularized area (A) and vessel length (B) at day 5 after corneal
injury. The bars show the mean ± SEM of independent experiments (n = 8). ** P < 0.01
compared with female mice.
78
0
20
40
60
80
100
120
03579111315
Days after wound formation
% of original wound area
Female
Male
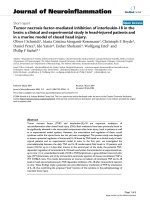
Fig. 3.3 Skin wound healing in BALB/c female and male mice
Wound closure was evaluated by morphometrical analysis of the wound areas. Each wound
region was digitally photographed at the indicated time points, and the percentage of wound
areas to the initial areas was calculated from the photographs. The bars show the mean ±
SEM of independent experiments (n = 6).
79
3.2 Key roles of neutrophils in angiogenesis in the corneal injury model
3.2.1 Lymphocytes have little impacts on angiogenesis in the corneal injury model
Although lymphocytes has been indicated to produce angiogenic factors (Lingen, 2001),
their roles in angiogenesis induced by injury are still unclear. We established the corneal
injury model in Rag1KO mice and control mice to study the roles of lymphocytes in
inflammatory angiogenesis. As shown in Figure 3.4, there was no difference in corneal
angiogenesis between BALB/c and Rag1 KO mice indicating that lymphocytes may not
play important roles in natural inflammatory angiogenesis.
80
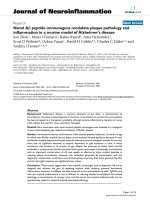
Fig. 3.4 Comparison of corneal angiogenesis between female BALB/c and Rag1 KO
mice
A Corneal angiogenesis at day 3 and day 5 after injury in BALB/c and Rag1KO mice. B
and C: Quantitative analysis of neovascularization at day 5 after injury. The bars show the
mean ± SEM of independent experiments (n = 6).
81
3.2.2 Key roles of neutrophils in angiogenesis in the corneal injury model
Neutrophils are the dominant infiltrating leukocyte population in the early stages of
inflammation. Neutrophils have been shown to play an important role in the inflammatory
response, acting as a first line of self-defense against invading microorganisms (Kasama et
al., 2005; Scapini et al., 2000). However, recent studies have indicated that neutrophils
may also play an important role in angiogenesis. Isolated human neutrophils are known to
release VEGF from preformed stores upon activation (Gaudry et al. 1997). Neutrophils are
also associated with angiogenesis in a Matrigel sponge model in vivo induced (Kibbey et
al., 1994). The induction of angiogenesis by IL-8/CXCL8 is also neutrophil dependent, the
angiogenic response being completely abrogated upon neutrophil depletion (Benelli et al.,
2002). However, no direct in vivo evidence relates the neutrophil to natural inflammatory
angiogenesis. Thus, we have used a corneal injury model to study the role of neutrophils in
the process of natural inflammatory angiogenesis as well as the mechanisms underlying the
observed response.
I. Efficacy of neutrophil depletion by RB6-8C5 treatment
To determine the role of neutrophils in inflammatory angiogenesis, neutrophils were
systemically depleted by intraperitoneal administration of RB6-8C5. Neutrophil depletion
was confirmed by Giemsa staining of the blood smear. Peripheral blood was collected from
mice at days -1, 0, 2 and 5 after injury to determine the extent of neutropenia. Peripheral
82
blood counts are shown in Table 3.1. Generally, very few neutrophils were found in the
peripheral blood of RB6-8C5-treated mice. RB6-8C5 treatment resulted in more than 97%
reduction in the number of circulating neutrophils during the course of experiment (Table
3.1). This result indicated that RB6-8C5 antibody could efficiently deplete circulating
neutrophils, which provides a reproducible systemic neutropenia model for the study of
neutrophil function. Neutrophil depletion had minimal effects on the differential count of
monocytes.
II. Effects of neutrophil depletion on corneal angiogenesis
The effect of neutrophil depletion on the corneal angiogenesis was evaluated by the
biomicroscopic observations, microvessel counts and measurements in new vessel length
and neovascularized area (Fig. 3.5).
Figure 3.6 shows corneas at days 3 and 5 after injury in the control and RB6-8C5 treatment
groups. In the control group, the limbal vessels began sprouting into the corneas at day 3
after the injury. Subsequently, vascular sprouts matured and elongated to the injury site,
reaching it at day 5, with the new vessel length and neovascularized area at 0.68±0.04 mm
and 2.08±0.15 mm
2
respectively (Fig. 3.5B, 3.5C). Neutrophil depletion severely inhibited
corneal angiogenesis: fewer new buds of vessels were present in the corneas of
RB6-8C5-treated mice by day 3, and no obvious progression of new vessel growth during
the process of angiogenesis was visible (Fig. 3.5A). By quantitative image analysis,
neutrophil depletion resulted in more than 90% reduction in new blood vessel length and
83
neovascularized area compared with the control mice at day 5 after injury (Fig. 3.5B,
3.5C).
We next assessed the role of neutrophils in angiogenesis by determining the microvessel
density. Figure 3.6 demonstrates that neutrophil depletion decreased the microvessel
density. In the control group, a 1.5-fold increase occurred in the microvessel density from
day 3 to day 5 after injury. Compared with the control group, 75% and 90% reduction in
the microvessel density were observed in the RB6-8C5 treatment group at day 3 and day 5
after injury, respectively. Moreover, the microvessel density remained unchanged from
day 3 to day 5 in the RB6-8C5 treatment group.
III. Effects of neutrophil depletion on corneal inflammation response
24 hours after injury the corneas became cloudy in both control and RB6-8C5-treated
groups and the degree of cloudiness was graded. We found that RB6-8C5-treated mice
showed significantly less corneal opacity than control mice from day 1 to day 3 (Fig. 3.7).
At day 1 after injury the mean scale of control group was 2.2, while it was 1.4 in RB6-8C5
-treated group. At day 5 after injury, the mean scale of control group increased to 2.4;
however, in RB6-8C5 treated group, it decreased to 1.1. Current data suggest that
neutrophil depletion significantly reduced the opacity in the cornea following injury,
which is consistent with the previous work (Oshima et al., 2006).
84
IV. Effects of neutrophil depletion on neutrophil infiltration
We then examined whether the observed inhibition of the angiogenic response in the
RB6-8C5 treatment group was due to the impaired neutrophil recruitment. Corneal
neutrophil counts were performed 1, 3, and 5 days after the injury by
immunohistochemical stain (Fig. 3.8). In the control group, the neutrophil infiltration was
highest at day 1 after injury and subsequently decreased at day 3 and day 5 (Fig.3.8 B
control 1 and control 2). H&E stains (Fig. 3.8 B control 2) were performed to confirm the
results of the immunohistochemistry stain. In the RB6-8C5 treatment group, there were
few neutrophils detected in the cornea during the 5 days after the injury. Uninjured corneas
did not possess any neutrophils in the control and RB6-8C5 treatment groups (data not
shown).
In the normal cornea there are a few residential macrophages. After injury, the number of
macrophage in the cornea had no increase both in the control and RB6-8C5 treated mice.
There were no T or B cells detected in the uninjured cornea. At day 5 after injury, few T
cells were detected in the corneas of control and RB6-8C5 treated mice. We could not
detect B cells in the corneas of control and RB6-8C5-treated mice during 5 days following
the injury (data not shown).
85
Table 3.1 Peripheral blood counts in the control and RB6-8C5 treated mice
Groups
% of total counts( days after injury)
-1 0 2 5
Neutrophil
Control 13.1±1.7 14.3±3.1 19.3±2.4 15.3±4.2
RB6-8C5 treatment 12.6±2.3 0.3±0.6 0.6±0.6 0.9±1.1
Monocyte
Control 2.7±0.2 2.5±0.1 2.5±0.3 2.7±0.4
RB6-8C5 treatment 2.7±0.4 2.8±0.3 2.8±0.2 2.9±0.6
Lymphocyte
Control 83.5±1.8 82.3±3.0 77.3±2.4 81.1±3.9
RB6-8C5 treatment 83.6±2.3 96.8±0.9 96.6±0.7 96.1±0.9
Eosinophils
Control 0.8±0.5 1.0±0.2 0.9±0.2 1.0±0.2
RB6-8C5 treatment 1.0±0.4 0 0.1±0.1 0.2±0.2
Mice were given 0.1 mg of control IgG or RB6-8C5 at 3 days interval beginning on day -1.
Blood smears were stained with Giemsa stain, and at least 250 cells per slide were counted.
Data are presented as means± standard deviation. The data are representative of 3 separate
experiments. Each experiment included five mice.
86
A
B C
0
0.2
0.4
0.6
0.8
Vessel Length (mm)
Control
RB6-8C5 treatment
***
0
0.5
1
1.5
2
2.5
Neovasculized Area (mm
2
)
Control
RB6-8C5 treatment
***
Fig. 3.5 Effects of neutrophil depletion on angiogenesis in the corneal injury model
A Corneal neovascularization at day 3 and day 5 after injury in the control and RB6-8C5
treatment groups. B and C Quantitative analysis of neovascularization at day 5 after injury.
Bars show the mean ± SEM of independent experiments (n = 10). *** P < 0.001 compared
with control group.
87
A
B
0
10
20
30
40
50
60
70
80
90
100
Day 3 Day 5
Days after injury
CD31 number per mm
2
Control
RB6-8C5 treatment
* ***
Fig. 3.6 Effects of neutrophil depletion on microvessel density in the cornea
A Representative photographs of CD31 immunohistochemistry stain in the corneas of
control and RB6-8C5 treatment groups at day 5 after injury (original magnification x 100,
bar 100 µm). B Quantitative analysis of CD31 immunohistochemistry stain in the corneas
of control and RB6-8C5 treatment groups at days 3 and 5 after injury. Bars show the mean
± SEM (n=6). * P < 0.05 *** P < 0.001 compared with control group.
88
0
0.5
1
1.5
2
2.5
3
Day1 Day3
Days after injury
Scale of cornea opacity
Control
RB6-8C5 treatment
*
*
Fig. 3.7 Effects of neutrophil depletion on the degree of corneal opacity
Scale of cornea opacity was evaluated at days 1and 3 after injury in the control and
RB6-8C5 treated groups. Bars show the mean ± SEM of independent experiments (n = 10).
* P < 0.05 compared with control group.
89
A
0
1000
2000
3000
4000
5000
6000
7000
8000
9000
10000
Day 1 Day 3 Day 5
Days after injury
Neutrophil infiltration (counts/mm
3
)
Control
RB6-8C5 treatment
Fig. 3.8 Infiltration of neutrophils in the corneal angiogenesis.
A Quantitative analysis of neutrophil infiltration during the process of angiogenesis. Bars
show the mean ± SEM of independent experiments (n = 6). The neutrophil counts in
RB6-8C5 treated group were extremely low.
90
B
Fig. 3.8 Infiltration of neutrophils in the corneal angiogenesis.
B Representative micrographs of immunohistochemistry and hematoxylin and eosin (H&E)
staining of corneal sections in the control and RB6-8C5 treatment groups. RB6-8C5
Immunostaining for neutrophils in the cornea of the RB6-8C5 treatment group after injury.
Bar 100 μm (original magnification:×100). Control 1 Immunostaining for neutrophils in
the cornea of the control group after injury. Bar 100 μm (original magnification: ×100).
Control 2 H&E staining of neutrophils in the cornea of the control group after injury. Bar
30 μm (original magnification: ×400, oil)
91
V. Induction and localization of VEGF in cornea
VEGF is a potent stimulator of the endothelial cell growth and can stimulate both the
physiological and pathological angiogenesis (Kim et al., 1992). In the present study, we
compared VEGF proteins in the cornea at 0, 1, 3 and 5 days after injury by the ELISA
method. In the control group, the protein level of VEGF increased nearly 2 fold from day 0
to day 1 after injury, decreased at day 3, and returned to near control levels by day 5
(8.42±2.37 pg/cornea). Neutrophil depletion decreased VEGF protein levels by 63% and
54% at day 1 and day 3 after injury, respectively (Fig. 3.9A).
To determine the cellular source of VEGF in the injured cornea, serial sections of eyeballs
taken 1 day after injury were immunostained for VEGF in the control and RB6-8C5
treatment groups. Both corneal epithelial cells and the infiltrating neutrophils were
positively stained with VEGF in the cornea of the control group (Fig. 3.9B). No positive
staining was observed in the negative control for VEGF (Fig. 3.9B). In contrast, in the
RB6-8C5 treatment group, no VEGF positive signals were detected in the corneas (Fig.
3.9B). No VEGF-positive stain was observed in the normal corneas (data not shown).
92
0
5
10
15
20
25
30
35
Day 0 Day 1 Day 3 Day 5
Days after injury
VEGF (pg/cornea)
Control
RB6-8C5 treatment
***
***
Fig. 3.9 Detection of VEGF in the cornea during angiogenesis
A Time kinetics for protein levels of VEGF after injury in the control and RB6-8C5
treatment groups. The bars show the mean ± SEM (n=6). *** P < 0.005 compared with
control group.
93
B
Fig. 3.9 Detection of VEGF in the cornea during angiogenesis
B Representative photographs of VEGF immunohistochemistry staining in the cornea at
day 1 after injury. a Negative control for VEGF in the cornea at day 1 after injury (original
magnification: x 100). b Immunostaining for VEGF in the cornea of the control group at
day 1 after injury (original magnification: x 100). c Immunostaining for VEGF in the
cornea of the control group at day 1 after injury (original magnification: x 400). d H&E
staining in the cornea of the control group (original magnification: x 400, oil). e
94
Immunostaining for VEGF in the cornea of the RB6-8C5 treatment group (original
magnification: x 100, bar 100 µm). f Immunostaining for VEGF in the cornea of the
RB6-8C5 treatment group (original magnification: x 400, bar 30 µm).
95
VI. Effects of neutrophil depletion on induction of MIP-1α, MIP-2, TNF-α and
MCP-1 in cornea
MIP-2 and TNF-α have been reported to have critical roles in angiogenesis (Szekanecz and
Koch 2001; Kim et al. 2001; Fahey et al. 1990). MIP-1α is able to promote neutrophil
infiltration (Wolpe et al. 1988). Therefore, we determined the protein levels of MIP-1α,
MIP-2, and TNF-α using ELISA in the in vivo murine corneal injury model (Fig.
3.10-3.12).
MIP-2 and MIP-1α protein levels were increased significantly at day 1 after injury and
decreased markedly by day 5. In the uninjured cornea, the levels of MIP-1α and MIP-2
proteins were not detected. In contrast, TNF-α (28.77±2.97 pg/cornea) was observed in the
uninjured cornea and the level remained unchanged after the injury.
Neutrophil depletion was shown to inhibit the protein levels of MIP-1α and MIP-2 in the
cornea (Fig. 3.10; 3.11). MIP-1α and MIP-2 proteins in the RB6-8C5 treatment group were
found to be only 27% and 24% of the levels in the control group at day 1 after injury. By
day 5, the proteins were undetectable in the RB6-8C5-treated cornea. Neutrophil depletion
had no effects on the levels of TNF-α in the cornea compared with the control group (Fig.
3.12).
96
The expression of MCP-1 protein was also observed (Fig.3.13). The protein level of
MCP-1 was increased at day 1, and decreased at day 3 after injury in both control and
RB6-8C5 treated mice. In contrast to the level of MIP-1α and MIP-2, the protein level of
MCP-1 was significantly higher in RB6-8C5-treated group as compared with control group
(Fig. 3.13).
VII. PMA- induced VEGF, MIP-1α and MIP-2 release from murine neutrophils in a
in vitro study
Human neutrophils have been shown to have an intracellular pool of VEGF and release
VEGF upon PMA stimulation (Gaudry et al. 1997). In this study, we investigated whether
murine neutrophils have preformed stores of VEGF and could release them upon
stimulation. As shown in Figure 3.14, VEGF was undetectable in the supernatant, whereas,
a considerable amount of VEGF was found inside the neutrophils (0 and 16.88 pg/10
6
cells,
respectively). After PMA treatment, a small amount of intracellular VEGF were detected
while a considerable amount of VEGF was detected in the supernatant (0.3 and 12.14
pg/10
6
cells, respectively). Upon PMA stimulation, the maximal level of VEGF secreted
was similar to the intracellular content of unstimulated neutrophils. The data suggests the
possible existence of an intracellular pool of VEGF in mouse neutrophils. Pretreatment of
neutrophils with cycloheximide did not affect PMA-induced VEGF release, reinforcing the
hypothesis that VEGF may be released from a pre-existing intracellular pool instead of de
novo synthesis (Fig. 3.14).
97
We investigated the contents of MIP-1α and MIP-2 in the culture supernatant and inside
the neutrophils with or without PMA activation. In the unstimulated neutrophils, no
MIP-1α and MIP-2 was found intracellularly. However, after stimulation, the amount of
MIP-1α and MIP-2 in the cell supernatant reached 222 pg and 276 pg, respectively,
suggesting that neutrophils produced MIP-1α and MIP-2 from de novo synthesis (Fig.
3.15). The hypothesis was further supported by the finding that PMA-induced MIP-1α and
MIP-2 production was abrogated by the pretreatment with cycloheximide.
98
0
10
20
30
40
50
Day 1Day 3Day 5
Days after injury
MIP-1α (pg/cornea)
Control
RB6-8C5 treatment
***
*
Fig. 3.10 Time kinetics for protein levels of MIP-1α in the corneal injury model
Corneas were removed at the indicated time after injury. Corneal lysate was prepared and
individually assayed by enzyme-linked immunosorbent assay. Bars show the mean ± SEM
(n=6). *P < 0.05, **P < 0.01, ***P < 0.005 compared with control group.