Study of field emission characteristics of ultrathin film coated carbon nanotubes core shell structures 6b
Bạn đang xem bản rút gọn của tài liệu. Xem và tải ngay bản đầy đủ của tài liệu tại đây (22.78 MB, 6 trang )
Chapter 6 Field
Emission Study of Hydrogenated Tetrahedral Amorphous Carbon Coated Carbon
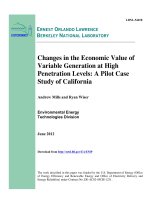
Fig. 6.9
Schematic illustration of effective potential area (shadowed parts) of electron
tunneling varying with the change
represents the vacuum level,
CBM means the conduction band minimum, and VBM is the valence band maximum.
In addition, it is
noted that the F
regions with a knee point in between, one in the lower field region and the other in the
higher field region. The
deviation of the F
commonly observed for semiconductor field
overheating of the emitter tips and
Emission Study of Hydrogenated Tetrahedral Amorphous Carbon Coated Carbon
Nanotubes Core-Shell Nanostructures
Schematic illustration of effective potential area (shadowed parts) of electron
tunneling varying with the change
of the
thickness of the coating ultrathin film.
represents the vacuum level,
E
F
donates the Fermi energy, Ø
is the work function of CNT,
CBM means the conduction band minimum, and VBM is the valence band maximum.
noted that the F
-N plots of some samples
comprise
regions with a knee point in between, one in the lower field region and the other in the
deviation of the F
-
N plot in the high electric field region is
commonly observed for semiconductor field
emitters and it is probably due to
overheating of the emitter tips and
the space charge effect [20-23].
More specifically,
Emission Study of Hydrogenated Tetrahedral Amorphous Carbon Coated Carbon
134
Schematic illustration of effective potential area (shadowed parts) of electron
thickness of the coating ultrathin film.
E
vac
is the work function of CNT,
CBM means the conduction band minimum, and VBM is the valence band maximum.
comprise
two linear
regions with a knee point in between, one in the lower field region and the other in the
N plot in the high electric field region is
emitters and it is probably due to
the
More specifically,
Chapter 6 Field Emission Study of Hydrogenated Tetrahedral Amorphous Carbon Coated Carbon
Nanotubes Core-Shell Nanostructures
135
with the increase of ambient temperature during emission process, the work function of
the emitter would change such that the emitter exhibited enhanced FE performance. On
the other hand, space charge would be generated around the emitter tips during
emission, which sharply reduced the local electric field on the emission sites. As the
ta-C mostly consists of sp
3
carbon bonds while CNTs are rich in sp
2
bonds, deposition
of ta-C onto the CNT surface would result in a decreased conductivity, which explains
the more severe space charge effect of the ta-C coated samples during emission
process.
6.4 Hydrogenation Effect on FE Properties of the
Composite Emitters
Hydrogenation treatment is a commonly used method to improve the surface
conductivity of diamond [24-28]. Recently, surface hydrogenation has been found to
be capable of significantly reducing the work functions of DLC thin films [29].
Theoretically, higher conductivity and lower surface work function for diamond or
ta-C films would enhance the FE properties of the ta-C coated CNT emitters.
Therefore, in this project, hydrogen plasma treatments with varied durations (10, 20
and 30 s) were conducted on the 50 nm ta-C coated CNT composite emitters in order
to investigate the hydrogenation effect on their FE performances. The same
experiment was also carried out on the 100 nm ta-C coated CNT samples for
confirmation purpose. Approximately 7 µm long high density vertically-aligned CNTs
Chapter 6 Field Emission Study of Hydrogenated Tetrahedral Amorphous Carbon Coated Carbon
Nanotubes Core-Shell Nanostructures
136
were used as substrate in this project.
6.4.1 Characterization by SEM and TEM
Fig. 6.10 shows the top and cross-sectional view SEM images of the 50 nm ta-C
coated composite emitters with and without hydrogen plasma post-treatment. From
the top view it can be clearly observed that the nanotubes become increasing thinner
as the duration of hydrogen plasma treatments was increased. From the
cross-sectional view it is obvious that without hydrogenation treatment, the CNT tips
are wrapped with thin films, which look like a layer of whiskers formed with the
average diameter larger than that of the pristine CNTs and the whiskers extended from
the tips of the CNTs. With a 10 s surface hydrogenation treatment, the sample appears
similar with the one without hydrogenation treatment in cross-sectional image.
However, the tips of these whiskers seem to protrude out and stand freely rather than
exhibiting curly shape at the tips like the pristine ta-C coated CNTs do. With 20 s
hydrogenation, the surface of the sample becomes very flat, without many random
protrusions of individual nanotubes. Moreover, little or no thick whiskers can be
observed from this image. With an even longer hydrogen plasma treatment, i.e., 30 s
hydrogenation duration, strictly no thick whiskers can be found on the CNT tips. The
surface is rather flat and the average diameter of these nanotubes is comparable to that
Chapter 6 Field
Emission Study of Hydrogenated Tetrahedral Amorphous Carbon Coated Carbon
Fig. 6.10 Top and cross-
sectional view SEM images of composite emitters. (a) and (b) 50 nm
ta-
C coated CNTs; (c) and (d) 50 nm ta
(e) and (f) 50 nm ta-
C coated CNTs with
ta-
C coated CNTs with
Emission Study of Hydrogenated Tetrahedral Amorphous Carbon Coated Carbon
Nanotubes Core-Shell Nanostructures
sectional view SEM images of composite emitters. (a) and (b) 50 nm
C coated CNTs; (c) and (d) 50 nm ta
-C coated CNTs with a
10 s hydrogenation treatment;
C coated CNTs with
a
20 s hydrogenation treatment; (g) and (h) 50 nm
C coated CNTs with
a 30 s hydrogenation treatment.
Emission Study of Hydrogenated Tetrahedral Amorphous Carbon Coated Carbon
137
sectional view SEM images of composite emitters. (a) and (b) 50 nm
10 s hydrogenation treatment;
20 s hydrogenation treatment; (g) and (h) 50 nm
Chapter 6 Field Emission Study of Hydrogenated Tetrahedral Amorphous Carbon Coated Carbon
Nanotubes Core-Shell Nanostructures
138
of the pristine CNTs. Hence, it is reasonable to assume that the coated tips of these
nanotubes were fully etched away by the hydrogen plasma. This assumption was
further confirmed by the emitters’ average length reduce, which was around 0.5 µm
comparing the 30 s hydrogenation sample to the 20 s sample. The same features can
be extracted as well from the SEM images of the 100 nm ta-C coated composite
emitters with and without hydrogen plasma post-treatment as shown in Fig. 6.11.
High resolution TEM images of the composite emitters with and without
hydrogenation treatment are shown in Fig. 6.12. Fig. 6.12(a) confirms the core-shell
structure of the composite emitter. After the 10 s hydrogen plasma treatment, the edge
of the composite nanotube was slightly etched as shown in Fig. 6.12(b). With the 30 s
hydrogenation treatment, the nanotube was severely etched at the surface such that the
CNT can be hardly observed, which was believed to be entirely etched away by
plasma as shown in Fig. 6.12(c).
Chapter 6 Field
Emission Study of Hydrogenated Tetrahedral Amorphous Carbon Coated Carbon
Fig. 6.11 Top and cross-
sectional view SEM images of composite emit
ta-
C coated CNTs; (c) and (d) 100 nm ta
(e) and (f) 100 nm ta-
C coated CNTs with
ta-
C coated CNTs with
Emission Study of Hydrogenated Tetrahedral Amorphous Carbon Coated Carbon
Nanotubes Core-Shell Nanostructures
sectional view SEM images of composite emit
ters. (a) and (b) 100 nm
C coated CNTs; (c) and (d) 100 nm ta
-C coated CNTs with a
10 s hydrogenation treatment;
C coated CNTs with
a
20 s hydrogenation treatment; (g) and (h) 100 nm
C coated CNTs with
a 30 s hydrogenation treatment.
Emission Study of Hydrogenated Tetrahedral Amorphous Carbon Coated Carbon
139
ters. (a) and (b) 100 nm
10 s hydrogenation treatment;
20 s hydrogenation treatment; (g) and (h) 100 nm