Proline rich acidic protein 1 in life and death 3
Bạn đang xem bản rút gọn của tài liệu. Xem và tải ngay bản đầy đủ của tài liệu tại đây (1.26 MB, 24 trang )
75
CHAPTER THREE
RESULTS
76
3.1 PRAP1 and intestinal differentiation
3.1.1 PRAP1 is expressed in epithelial cells of the intestines
The expression of PRAP1 in human intestinal tract was studied using
immunohistochemistry. Paraffin embedded tissue sections of small intestine and
colon were used. In the small intestine (Figure 3.11), the expression of PRAP1
was found primarily in the epithelial cells at the top of the intestinal mucosa.
PRAP1 expression was not detected in the goblet cells. There is little or no
detectable expression of PRAP1 in the crypt, which is the proliferative region of
the intestinal mucosa. Expression of PRAP1 was also not detected in the Paneth
cells that reside at the base of crypts. A group of cells were stained very strongly
for PRAP1 protein. These cells have a distribution pattern similar to that of
intermediate cells which have rare occurrence in the intestinal epithelium
(Troughton and Trier 1969).
A similar expression pattern was observed in the colon mucosa. As shown
in Figure 3.12-A, there was little or no detectable expression of PRAP1 in the
goblet cells or in the crypt. Intermediate-like cells with strong PRAP1 staining
were also detected. Furthermore, PRAP1 expression was localized on the luminal
side of the intestinal tracts (Figure 3.12-B). This correlates with the polarization of
the mucosal epithelial cells.
In conclusion, our results showed that PRAP1 expression was strongly
associated with the differentiation of the intestinal epithelium. Differentiation of
the gut can be achieved by a number of ways. We used three different models to
study the relationship between PRAP1 and the differentiation of the intestinal
cells.
77
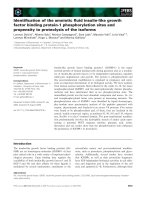
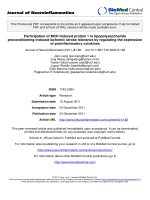
Figure 3.11 PRAP1 is expressed in the epithelial cells of small intestine
Representative figure showing PRAP1 immunohistochemical staining in normal
human small intestine tissue (X100 magnification). Blue hemotoxylin was used as
nuclear counterstain. Red arrow indicates high levels of PRAP1 in cells at the top
of the villus. Black arrow points to the crypt-villus junction.
78
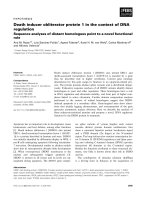
Figure 3.12 PRAP1 is expressed in the epithelial cells of colon
Representative figures showing PRAP1 immunohistochemical staining in normal
human colon. A: Black arrow indicates positive PRAP1 staining cells at the top of
the villus (100X magnification). B: Red arrow indicates high levels of PRAP1
protein in cells at the top of villus. G points to globlet cell. L indicates the luminal
side of the colon (400X magnification).
79
3.1.2 Induction of PRAP1 by WNT-TCF pathway inhibition
The WNT-TCF signaling pathway plays a central role in controlling the
switch between proliferation and differentiation in the intestinal epithelium (Pinto
and Clevers 2005; Radtke and Clevers 2005; Radtke, Clevers et al. 2006).
Blocking the WNT-TCF signaling pathway results in β-catenin degradation and
consequently, the ablation of β-catenin-TCF dependent gene transcription that is
essential for maintaining the proliferative/undifferentiated state of intestinal
epithelial cells. In this study, we used a cell line, L8, from the Clever’s lab. This
cell line carries a doxycycline-inducible expression plasmid encoding N-
terminally truncated TCF-4 (dnTCF-4). This truncated form cannot bind β-catenin
and thus blocks the formation of endogenous β-catenin/TCF complex. As shown
in Figure 3.13, there was an increase in the differentiation marker, GALECTIN-4
expression at 48 hours after inhibiting the WNT-TCF signaling pathway by
dnTCF-4, indicating that induction of dnTCF resulted in the differentiation of
colon epithelial cells. When the same lysate was probed for PRAP1 (Figure 3.14),
it was shown that an increase in GALECTIN-4 at 48 hours correlated with an
increase in PRAP1. This is consistent with our hypothesis that PRAP1 expression
is correlated to cellular differentiation status.
3.1.3 Induction of PRAP1 by sodium butyrate
HT 29 cells were treated with 5mM sodium butyrate to induce
differentiation as documented (Zhang, Wong et al. 2003). The differentiation
status of the HT 29 cells was assessed by the level of a differentiation marker,
alkaline phosphatase activity. PRAP1 expression was induced by sodium butyrate
at 48 and 72 hours after treatment (Figure 3.15). The induction of PRAP1
correlated significantly with the alkaline phosphatase
80
Figure 3.13 Differentiation is induced by blocking TCF4
Representative western blot of GALECTIN-4 (a differentiation marker) and
GAPDH (loading control) in L8 cells after treatment with doxycycline to induce
the expression of dnTCF4 (N-terminal truncated TCF) for 24, 48 and 72 hr.
Figure 3.14 PRAP1 is induced in differentiated colorectal cancer cells
Representative western blot of PRAP1 and GAPDH (loading control) in L8 cells
after treatment with doxycycline for 24, 48 and 72 hours.
81
Figure 3.15 PRAP1 expression is induced by sodium butyrate
Representative western blot of PRAP1 and GAPDH (loading control) in HT 29
cells after treatment with 5mM sodium butyrate for 24, 48 and 72 hours.
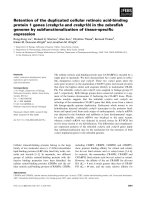
Figure 3.16 PRAP1 expression is correlated with differentiation
A: Representative figure showing the alkaline phosphatase activities (a
differentiation marker) in HT 29 cells after treatment with 5mM sodium butyrate
for 24, 48 and 72 hours.
B: Representative figure showing the level of PRAP1 protein expression
calculated and normalized with GAPDH using densitometer in HT 29 cells after
treatment with 5mM sodium butyrate for 24, 48 and 72 hours. Correlation index
was calculated using GraphPad software. * p<0.05.
r = 0.96*
82
activity (R=0.96, Figure 3.16). Together, our results lend support to our
observation that PRAP1 is associated with differentiation.
3.1.4 Induction of PRAP1 by glucose deprivation
HT 29 cells can be induced to differentiate by the removal of glucose
(Zweibaum, Pinto et al. 1985; Liu, Huang et al. 2006). Consistent with the
reported results, HT 29 cells with the ability to grow without glucose showed an
increase of more than 2-fold in the alkaline phosphatase activities as compared to
the untreated control cells (Figure 3.17-A). The expression of PRAP1 was
increased by 2.5-fold in these differentiated cells compared to the control cells
without glucose deprivation (Figure 3.17-B). Together, our results support our
conclusion that PRAP1 is strongly associated with differentiation.
3.2 Regulation of PRAP1 expression by differentiation
3.2.1 Induction of PRAP1 expression at mRNA level
To further study the regulation of PRAP1 by differentiation, we examined
the induction of PRAP1 expression at mRNA level using quantitative RT-PCR.
As shown in Figure 3.18-A, PRAP1 mRNA expression level was increased at 48
hours after the induction of dnTCF, and further increased to 4.5-fold at 72 hours.
Similar results were observed in the sodium butyrate model. PRAP1 mRNA
expression level was increased at 48 hours after sodium butyrate treatment, and
further increased to 5-fold at 72 hours (Figure 3.18-B). These data indicate that
induction of PRAP1 occurred by an increase of PRAP1 mRNA.
83
Figure 3.17 PRAP1 expression is induced by glucose deprivation
A: Representative figure showing the alkaline phosphatase activity (a
differentiation marker) in HT 29 cells after subjecting to glucose deprivation.
B: Representative western blot of RPAP1 and GAPDH (loading control) in HT 29
after glucose deprivation treatment (Glu-).
84
Figure 3.18 PRAP1 expression is induced at mRNA level by differentiation
Representative figures showing quantitative RT-PCR of PRAP1 mRNA
expression level normalized with GAPDH (housekeeping gene) in L8 cells after
treatment with doxycycline for 24, 48 and 72 hours (A); and in HT 29 cells after
treatment with 5mM sodium butyrate for 24, 48 and 72 hours (B).
Figure 3.19 Cloning of PRAP1 promoter
Representative agarose gel pictures of PCR cloning products of various lengths of
DNA sequence upstream of PRAP1 transcription start site amplified from BAC
clone. The size and position of each DNA fragments was indicated in the agarose
gel pictures.
85
3.2.2 Transcriptional regulation of PRAP1
3.2.2.1 Promoter characterization of PRAP1
In order to study whether the regulation of PRAP1 is at the transcriptional
level, various lengths of PRAP1 sequence upstream of its transcription start site
were amplified from Bac clone (RP11-122K13) as shown in Figure 3.19. Each
individual fragment was cloned into a firefly luciferase vector without promoter
and enhancer (pGL3-Basic) as shown in Figure 3.20-A. These reporter constructs
containing different lengths of the PRAP1 promoter showed a varied degree of
promoter activity, suggesting the presence of regulatory elements. Majority of the
PRAP1 promoter constructs showed a promoter activity of more than 15-fold as
compared with that of the empty vector. The lowest promoter activity was
observed in the promoter construct with 3000 base pairs upstream of the PRAP1
transcription start site. The activity of the shortest fragment, pGL(-203/0) was
similar as that of larger fragments, suggesting the presence of a core promoter
(Figure 3.20-A).
To further confirm the location of the PRAP1 core promoter, a deletion
construct pGL(-461/-203) was generated by deleting the 203 base pairs upstream
of the transcription start site. Consistent with our observation, the activity of the
deletion construct pGL(-461/-203) decreased to that of basic vector (Figure 3.20-
B). These results indicate that the core promoter of PRAP1 was located within 203
base pairs upstream of the PRAP1 transcription start site.
86
Figure 3.20 PRAP1 promoter activities in L8 cells
A: Left panel: Illustration representing various portions of the prap1 5’ flanking
region of the prap1 gene subcloned upstream of the firefly luciferase gene (pGL3-
Basic). The number in the box indicates the size of each prap1 fragment with
respect to the transcription start site (+1).
Right panel: Representative figure showing the fold induction of prap1 promoter
activity of each fragment in L8 cells. For each transfection, the firefly luciferase
activity was normalized with the Renilla reniformis luciferase activity by the
cotransfected pRL-TK. The relative activity of each construct is expressed as a
ratio to the activity of the pGL-Basic. Bar, mean of three replicates. Bar, SE.
B: Left panel: Illustration showing the deletion construct pGL(-461/-203)
generated by deleting the 203 base pairs upstream of the transcription start site
from the pGL(-461/0) construct.
Right panel: Representative figure showing the fold induction of prap1 promoter
activity of each construct in L8 cells. The promoter activity was measured as
described in A. Column, mean of three replicates; Bar, SE.
87
3.2.2.2 PRAP1 expression was not regulated at transcriptional level
To study the regulation of PRAP1 at transcriptional level, two reporter
constructs of PRAP1 promoter, the longest construct pGL(-3900/0) and the core
promoter pGL(-203/0) were used. These constructs were transfected into L8 cells.
At 24 hours post-transfection, doxycycline was added to induce differentiation.
An increase in PRAP1 mRNA by differentiation was confirmed by RT-PCR
(Figure 3.21-A). At the same time, the promoter activities of PRAP1 were
examined. However, our results showed that there was no increase in the
transcription activity of the core promoter, while the activity of the longest
construct was increased only slightly (Figure 3.21-B). These results suggest that
the increase in PRAP1 mRNA level by cellular differentiation may not due to an
increase in transcription.
3.2.3 PRAP1 mRNA was stabilized in cellular differentiation
Since PRAP1 expression is not regulated at the transcriptional level by
differentiation, we examined whether it was due to an increase in the stability of
PRAP1 mRNA. L8 cells were treated with doxycycline for 72 hours and total
mRNA synthesis was inhibited by treating the cells with actinomycin (4µg/ml) for
0, 2 and 4 hours before harvesting. Our results showed that the stability of PRAP1
mRNA was dramatically enhanced after induction of dnTCF-4 (Figure 3.22). At 2
hours time-point, PRAP1 mRNA level in the more differentiated L8 cells showed
a slower rate of reduction as compared to the control undifferentiated L8 cells
(10% vs 25%). At 4 hours, the level of PRAP1 mRNA in the undifferentiated cells
was further reduced by 70%, whereas the PRAP1 mRNA level in the
differentiated L8 cells was stabilized and did not show any further decay. These
88
results indicate that the increase in PRAP1 mRNA levels following differentiation
occurs at the post-transcriptional level through stabilization of mRNA.
Figure 3.21 PRAP1 is not regulated at transcriptional level by differentiation
A: Representative RT-PCR gel picture of prap1 and gapdh in L8 cells after
treatment with (+) or without (-) doxycycline for 72 hours.
B: Representative figure showing the luciferase activity of prap1 promoter
constructs pGL(-3900/0) and pGL(-203/0) in L8 cells after treatment with
doxycycline for 72 hours. Luciferase activity was calculated as in Figure 3.20.
Column, mean of three replicates; Bar, SE.
89
Figure 3.22 Stability of PRAP1 mRNA is increased by differentiation
Representative figure showing the percentage of PRAP1 mRNA expression level
in L8 cells. Cells were treated with (+) or without (-) doxycycline for four days
and 4 µg/ml of actionomycin was added for 0, 2 and 4 hours to stop endogenous
mRNA synthesis. Relative expression level of PRAP1 was measured and
normalized with GAPDH using quantitative RT-PCR. Level of expression at 0
hour was used as a reference point. Level of PRAP1 expression was expressed as
a percentage of the reference point.
90
3.3 Effect of PRAP1 on differentiation
3.3.1 Effect of PRAP1 overexpression on cellular differentiation
To study the role of PRAP1 in cellular differentiation process, we
overexpressed PRAP1 in both HT 29 cell line and LS 174T cell line, which is the
parental cell line of L8 cells. The effect of PRAP1 on cellular differentiation was
analyzed by the differentiation markers, alkaline phosphatase activity in HT 29
cells, and GALECTIN-4 expression level in LS 174T cells. Our results showed
that PRAP1 was overexpressed in HT 29 cells by transient transfection of PRAP1
gene construct plasmid (pcDNA-PRAP1) for 72 hours (Figure 3.23-A). However,
overexpression of PRAP did not result in any changes in the activities of alkaline
phosphatase in HT 29 cells (Figure 3.23-B). Similar results were also observed in
LS 174T cells. LS 174T cells were transiently transfected with pcDNA-PRAP1
twice at 48 hours interval, and overexpression of PRAP1 was validated by western
blot (Figure 3.24). Overexpression of PRAP1 also did not result in any alteration
in the level of GALECTIN-4 expression in LS 174T cells. Collectively, these
results demonstrate that PRAP1 protein alone is not sufficient to induce
differentiation in the intestinal epithelial cells.
3.3.2 Effect of PRAP1 knockdown on cellular differentiation
The role of PRAP1 in differentiation was further explored by examining
the effect of inhibiting the induction of PRAP1 on the differentiation status. To
achieve this, we used siRNAs to knockdown the induction of PRAP1 mRNA
during differentiation. Briefly, LS 8 cells were first treated with doxycycline for
24 hours to induce PRAP1 expression. Two siRNAs specific for PRAP1 were
transiently transfected to repress this
91
Figure 3.23 Overexpression of PRAP1 do not induce differentiation in HT 29
A: Representative western blot of PRAP1 and GAPDH (loading control) in HT 29
cells after transient transfection with pcDNA (Vector) or pcDNA-PRAP1 for 72
hours.
B: Representative figure showing the alkaline phosphatase activity (a
differentiation marker) in HT 29 cells transiently transfected with pcDNA
(control) or pcDNA-PRAP1 (Prap) for 72 hours. Column, means of three
replicates; Bars, SE.
92
Figure 3.24 Overexpression of PRAP1 do not induce differentiation in L8
cells
Representative western blot of PRAP1, GALECTIN-4 (a differentiation marker)
and GAPDH (loading control) in L8 cells after transient transfection with pcDNA
(Vector) or pcDNA-PRAP1 (PRAP1) twice at 48 hours interval.
Figure 3.25 Repression of PRAP1 expression did not affect differentiation in
L8 cells
Representative RT-PCR gel picture of prap1 and gapdh (A) and western blot of
GALECTIN-4 and GAPDH (B) in L8 cells. Cells were treated with or without
doxycycline for 24 hours and the induced PRAP1 expression was repressed by
transfecting PRAP1-specific siRNAs or control siRNA for 72 hours in the
presence or absence of doxycycline. Lane 1: untreated control; 2: with
doxycycline; 3: control siRNA; 4: PRAP1 siRNA1; 5: PRAP1 siRNA2.
93
upregulation. Our results showed that PRAP1 specific siRNAs were able to
effectively reduce the level of PRAP1 induction to levels comparable to or lower
than the undifferentiated control (Figure 3.25-A). The control siRNAs were also
shown not to be targeting PRAP1. However, there was no change in the level of
GALECTIN-4 expression (Figure 3.25-B). This demonstrated that PRAP1
induction by dnTCF-4 was not essential in the induction of differentiation. This
suggests that PRAP1 may be involved in the functions of epithelial cells
downstream of differentiation. Together, these data showed that perturbation of
PRAP1 expression alone either by overexpression or knockdown was not
sufficient to alter the differentiation status of the cells.
3.4 Role of PRAP1 in differentiated epithelial cells
3.4.1 PRAP1 binds bacteria
Since PRAP1 was expressed in the intermediate-like epithelial cells which
had been shown to express antibacterial peptides, we examined whether PRAP1
protein may also play a similar functional role as that of antibacterial peptides in
the gastrointestinal tract. PRAP1 being a secretory protein and expressed on the
luminal side of the differentiated epithelial cells, strongly suggest that it may be
secreted into the lumen. We hypothesized that PRAP1 may play a role in
protecting the intestinal epithelium from invading microorganisms. To verify this
hypothesis, we first examined whether PRAP1 protein binds to bacteria. We
expressed the recombinant HisPRAP1 protein in BL 21 and purified it. A high
purity of HisPRAP1 was obtained as validated by the SDS-PAGE gel visualized
with Coomassie Blue (Figure 3.26). The binding of HisPRAP1 to E. coli was
94
Figure 3.26 Purity of HisPRAP1 protein
Representative SDS-PAGE gel picture of recombinant His-tagged PRAP1
(HisPRAP1) purified by FPLC and bovine serum albumin (BSA) stained and
visualized with Coomassie blue.
Figure 3.27 HisPRAP1 binds to E.coli
Representative figure showing absorbance reading of HisPRAP1 or BSA binding
to the surface of bacteria E.coli. E.coli were fixed and coated overnight in 96-well
ELISA plate. BSA was also coated overnight as a negative control (BSA/PRAP1).
Coated bacteria were then incubated with HisPRAP1 (E.coli/PRAP1) or BSA
(E.coli/BSA) or empty buffer (E.coli/Blank) for 2 hours. Absorbance was
measured by spectrometer at 450nm with reference at 570nm. Column, mean of 3
replicates; Bar, SE.
95
analyzed by using an ELISA-based assay. Our results showed that HisPRAP1
protein but not the BSA protein was detected on the surface of bacteria,
demonstrating the binding of PRAP1 to bacteria (Figure 3.27).
Another assay was used to further verify the binding of PRAP1 to bacteria.
This assay involves the mixing of Alexa Fluor 568 dye labeled HisPRAP1 and
BSA with fixed bacteria and incubation in the dark for 3 hours on a shaker at
room temperature. After washing off the unbound proteins, the bacteria were
resuspended in PBS and the fluorescence was measured. As shown in Figure 3.28,
HisPRAP1 bound directly to both E. coli and Klebsiella bacteria. The level of
binding was 40-fold more than that of BSA or free dye. These results suggest that
PRAP1 secreted by differentiated epithelial cells may be involved in the
protection of the intestinal tract by immobilizing the bacteria to prevent their
invasion and to facilitate the clearance by professional phagocytes reside in the
intestinal epithelium.
3.4.2 Bactericidal activity of PRAP1
To examine the role of PRAP1 in the innate immunity of the
gastrointestinal tract, we studied its antibacterial property. The pH-dependent
antibacterial activity nature of PRAP1 was examined using colony forming units
(CFU) assay. Briefly, HisPRAP1 was incubated with mid-log phase of bacteria at
pH 7.4 or 4.5 for 2 hours. The mixture was then plated on LB agar plates. After
overnight incubation, number of colonies formed was counted. There was no
difference in the number of colonies formed between HisPRAP1 and the control at
pH 7.4 (Data not shown). However, at pH 4.5, HisPRAP1 exhibited antibacterial
activity. As shown in Figure 3.29, incubation of bacteria with HisPRAP1 resulted
in a significant reduction in the number of colonies formed as
96
Figure 3.28 HisPRAP1 binds to E.coli and Klebsiella
Representative figure showing the fluorescence reading of free dye, Alexa Fluor
594 dye-labeled HisPRAP1 and bovine serum albumin (BSA) binding to the
surface of bacteria E.coli and Klebsiella. The fluorescence was measured in a
fluorescent spectrometer (Excitation 590nm, Emission 635nm). Column, mean of
3 replicates; Bar, SE.
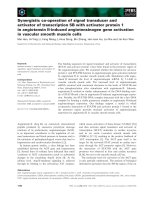
Figure 3.29 Bactericidial activity of HisPRAP1 at pH 4.5
Representative figure showing the colony formation assay. Mid-log phase E.coli
was incubated without (Control) or with HisPRAP1 for 2 hours at pH 4.5 at room
temperature. The mixture was plated on LB agar plates and incubated overnight at
37
o
C. The number of colonies formed were counted. Column, mean of 3
replicates; Bar, SE.*p<0.05.
97
compared to the control (210 vs 550). Together, these data indicate that PRAP1
protein may have bactericidal activity.
3.4.3 Phagocytosis of bacteria
To examine the involvement of PRAP1 in the acquired immunity, we
investigated the phagocytosis potential of PRAP1-coated fluorescent labeled
bacteria by macrophages derived from U937 cells. Briefly, bacteria was incubated
with HisPRAP1 and fed to the macrophages. Percentage of cells with ingested
bacteria was measured by flow cytometry. The phagocytosis of bacteria was very
efficient with 90% of macrophages showing ingestion of bacteria after 5 min
incubation. The rate of phagocytosis was also saturated at as early as 5 min. The
binding of HisPRAP1 to the bacteria did not result in any significant changes in
the rate of phagocytosis mediated by macrophages (Figure 3.30). This may due to
the high efficiency of macrophages in clearing the bacteria and the high
redundancy associated with the process of acquired immunity.
3.5 PRAP1 is a genotoxic stress responsive gene
3.5.1 Induction of PRAP1 by stressors that cause DNA damage
The regulation of PRAP1 expression by stress was studied using the
human colon cancer cell line, HCT 116. Cells were exposed to various stressors:
chemotherapeutic agents used in the treatment of colorectal cancer- 5-flourouracil
(5-FU), camptothecin (CPT) and etoposide (Eto) and environmental stresses such
as nutrient deprivation, ethanol, oxidative stress (hydrogen peroxide) and UV. The
expression of PRAP1 at the mRNA level was highly induced by all of these
chemotherapeutic agents and to a lesser degree level by hydrogen peroxide and
UV (Figure 3.31-A). There was no detectable
98
Figure 3.30 Phagocytosis of E.coli
Top: Representative histogram showing phagocytosis assay of fluorescence-
labeled E.coli uncoated or coated with BSA or HisPRAP1 by macrophages
derived from U937 treated with PMA for 5, 20 and 40 minutes at 37
o
C with
shaking. Uningested E.coli was quenched by trypan blue. The percentage of cells
with ingested E.coli was analyzed by flow cytometry. Red shaded: macrophages
alone (Ctrl); Green: uncoated E.coli and macrophages; Purple: BSA coated E.coli
and macrophages; Blue: HisPRAP1 coated E.coli and macrophages.
Bottom: Summary of the readings obtained. Column, mean of 3 replicates; Bar,
SE.