Development of sphingosine kinase (SPHK) inhibitors and the role of sphingolipids in adult stem cell proliferation and differentiation 3
Bạn đang xem bản rút gọn của tài liệu. Xem và tải ngay bản đầy đủ của tài liệu tại đây (460.18 KB, 58 trang )
Chapter 3 Roles of SPHK Inhibitors in Human BM- and AD- MSCs Differentiation
64
CHAPTER 3 ROLES OF SPHK INHIBITORS IN HUMAN BM-
AND AD- MSCS DIFFERENTIATION
Human stem cells are more and more becoming the research focus for their use in
developmental biology and for their potential in clinical applications, to replace or
replenish destroyed or dysfunctional tissue/organ. However, one of the major risks
using stem cells for therapy is their spontaneous differentiation ability to form teratoma
in the body (Wakitani et al., 2003; Vogel, 2005; Nussbaum et al., 2007; Hentze et al.,
2007). Therefore, promoting stem cells differentiation in a controlled manner will be
highly desirable to reduce the risk of teratoma formation.
Currently, there are several strategies to induce stem cells to differentiate along certain
lineages, introduced in Section 1.4.5.2 Exogenous Cytokines and Growth Factors,
Nonproteinaceous Cocktails, Scaffold, Co-culture, or Genetic Modification for MSCs
Differentiation. However, these methods share several common limitations such as
prolonged culture duration, high cost, inability to consistently differentiate stem cells
along specific lineages, risk of pathogen transmission and the use of controversial
genetic engineering techniques such as viral vector constructs to introduce proliferative
and/or lineage-specific genes. Therefore, it is of wide interest to obtain more knowledge
on the molecule(s) that promote stem cells differentiation in order to develop novel and
safer strategies for stem cells differentiation.
In our study, inhibition of the enzyme SPHK, which is tightly related to the cells
proliferation, was evaluated as a new strategy to promote human MSCs differentiation.
It is well known that proliferation and differentiation are two of the most fundamental
biological processes in the life cycle of the stem cells, and there is a balance between
Chapter 3 Roles of SPHK Inhibitors in Human BM- and AD- MSCs Differentiation
65
them that determines cell fate. When the balance is broken, the cells would grow
without differentiation, or commit into differentiation. Based on the proliferative role of
SPHK, which has been introduced in Chapter 1, we hypothesized that when suppressing
SPHK activity in the stem cells, the balance between proliferation and differentiation
could be lost, the cell growth was arrested, and the cells would then enter into certain
differentiation pathway(s). This hypothesis was supported by a recent study by Pébay et
al. (2005), which showed that S1P could work synergetically with PDGF to promote
human embryonic stem cells proliferation, while the inhibition of SPHK by DMS,
abolished the stemness maintained by S1P+PDGF and caused the cells to spontaneously
differentiate, to unknown and uncharacterized lineage(s). However, no further research
was carried out. For example, it is not known what kinds of cells those human
embryonic stem cells were differentiated into, or whether SPHK inhibition may aid the
stem cells to differentiate into a specific cell-type(s).
In Chapter 2 I introduced the development of novel SPHK inhibitors, and the evaluation
showed that the compounds generated were specific for SPHK1. Among these synthetic
compounds, CP6 showed to be the best inhibitor candidate, in terms of the ability to
penetrate into the cells and inhibit the endogenous SPHK1 and the good yield obtained
from the chemical synthesis procedure. Therefore, in this chapter, CP6 was selected to
study the function of SPHK in human BM-MSCs and AD-MSCs differentiation, and the
non-specific SPHK inhibitor, DMS, was used as a control. Two differentiation
pathways were chosen to study, namely, osteogenic and adipogenic differentiation, as
these are well characterized pathways in human BM- and AD- MSCs differentiation.
Chapter 3 Roles of SPHK Inhibitors in Human BM- and AD- MSCs Differentiation
66
3.1 MATERIALS AND METHODS
All chemicals, if not specially mentioned, were purchased from Sigma-Aldrich,
Singapore.
3.1.1 Cell culture
3.1.1.1 Human AD-MSCs
First, human adipose tissue was obtained from Prof. Dietmar W. Hutmacher’s
laboratory at the National University of Singapore, who had a protocol approved by the
Institutional Review Board, National University Hospital, Singapore, for the
procurement of human adipose tissue. The adipose tissue was obtained from donors,
after full written consent was obtained, who underwent elective liposuction. Then, a
modified cell isolation protocol, based on Zuk et al.’s (2001) method, was used to
process the adipose tissues. Briefly, the tissues were first washed three times with
phosphate buffered saline solution (PBS) to remove the blood within the adipose tissues.
Tissues were then digested with 0.075% collagenase Type I (GIBCO #17101-015) for 2
hours at 37°C with occasional shaking. The mixture was then spun down at 300g for 10
minutes. The digested tissue was separated into three layers with the cells at the bottom
layer. The top layers were discarded and the cells were then re-suspended in culture
media containing high glucose DMEM (GIBCO, #10569) supplemented with 10% heat-
inactivated FBS (GIBCO), 1% of 2mM L-glutamine, 10mg/ml streptomycin and
10U/ml penicillin, and plated in 20 ml culture flasks (TPP, Trasadingen, Switzerland).
Once the cells were attached to the culture flask, the medium was changed to remove
the unattached cells. Half of the growth medium was changed every three days. Cells
are cultured in an incubator at 37°C, 5% CO
2
in a water-saturated environment.
Chapter 3 Roles of SPHK Inhibitors in Human BM- and AD- MSCs Differentiation
67
3.1.1.2 Human BM-MSCs
Human BM-MSCs were a kind gift from Prof. Michael Raghunath, who had purchased
them from Cambrex (Cambrex, USA). Briefly, the cells were obtained from BM
withdrawn from the posterior iliac crest of pelvic bone of normal volunteers (healthy
males and non-pregnant females between the ages of 18 and 45 years old). Human BM-
MSCs were cultured in low glucose DMEM (GIBCO, #10567), supplemented with 10%
FBS, 1% of 2mM L-glutamine, 10mg/ml streptomycin and 10U/ml penicillin. Cells
were cultured in an incubator at 37°C, 5% CO
2
in a water-saturated environment.
3.1.1.3 Stem Cells Seeding Density
Unless otherwise stated, stem cell seeding density used was 5,000cells/cm
2
in all of the
experiments using human BM- and AD- MSCs.
3.1.1.4 Stem Cells Osteogenic and Adipogenic Induction Culture
Condition Culture media Supplements
Normal
growth
DMEM+10% FBS
+1% Penicillin and
Streptomycin
N/A
Adipogenic
differentiation
DMEM+10% FBS
+1% Penicillin and
Streptomycin
0.5mM isobutyl-methylxanthine,
1μM dexamethasone,
10μM insulin,
200μM indomethacin,
1% Penicillin and Streptomycin
Osteogenic
differentiation
DMEM+10% FBS
+1% Penicillin and
Streptomycin
0.01
μ
M 1,25-dihydroxyvitamin D3, 50μM
ascorbate-2-phosphate, 10mM ß-
glycerophosphate
3.1.1.5 Human Fetal Osteoblast Progenitor (hFOB) Cell Line
The hFOB cell line is a clonal, conditionally immortalized human fetal cell line that is
capable of osteoblastic differentiation and bone formation. It was used as a positive
control in MSCs osteogenic differentiation investigations. The cells were cultured in
Chapter 3 Roles of SPHK Inhibitors in Human BM- and AD- MSCs Differentiation
68
RPMI 1640 supplemented with 10% FBS (GIBCO, Invitrogen Singapore), 2mM
glutamine, 10U/ml penicillin and 10mg/ml streptomycin at 37C, 5% carbon dioxide in a
humidified atmosphere.
3.1.2 Cell Lysis
Cell lysates were prepared by lysing the cells in RIPA buffer (0.01M Tris-HCl [pH 7.4],
0.15M NaCl, 1% sodium deoxycholate, 1% Nonidet P-40, 0.1% sodium dodecyl sulfate
[SDS], 1mM EDTA, 1mM phenylmethylsulfonyl fluoride) for one hour at 4°C.
3.1.3 Staining
3.1.3.1 Alizarin Red S Staining
Alizarin Red S staining is widely used to evaluate the calcium-rich deposits generated
by cells. In this study, the staining was used to detect the mineralization in human
MSCs during osteogenic differentiation. Briefly, the induced cells were fixed in 10%
formalin overnight at 4°C. Alizarin Red S working solution was prepared by dissolving
2 grams of Alizarin Red S powder (Sigma-Aldrich #05600) in 100ml of distilled water.
The pH of the working solution was adjusted to 4.1-4.3 using 0.5% ammonium. After
discarding the formalin and washed twice with distilled water, Alizarin Red S working
solution was added to fully cover the fixed cells. Cells were then incubated at room
temperature for 5 minutes and checked under microscope for the orange-red color to
develop. Excess dye was removed and the cells were washed three times with distilled
water. Alizarin Red S staining in each sample was quantified by dissolving the staining
with diH
2
O and detecting the absorbance under 500nm.
Chapter 3 Roles of SPHK Inhibitors in Human BM- and AD- MSCs Differentiation
69
3.1.3.2 Oil Red O Staining
Oil red O staining is commonly used to identify the exogenous or endogenous lipid
deposits. In the present study, it was used to detect the adipogenic differentiation of the
human stem cells. Briefly, cells were fixed in 10% formalin overnight at 4°C. Oil Red O
stock solution was prepared by dissolving 0.7 gram of Oil Red O powder (Sigma-
Aldrich #O-0625) in 200ml isopropanol, followed by filtration. A working solution was
prepared by mixing six parts of the Oil Red O stock solution and four parts of distilled
water. After the formalin was removed, samples were washed with 60% isopropanol,
and Oil Red O working solution was added and incubated for 10 minutes at room
temperature. Following the incubation the dye was removed and the cells were washed
three times with distilled water. Oil Red O staining in each sample was quantified by
dissolving the staining with 100% of isopropanol and detecting the absorbance at
500nm.
3.1.3.3 Fluorescence Immunostaining
Fluorescence immunostaining was used to detect the expression of three typical
osteogenic differentiation proteins: osteocalcin, osteopontin, and osteonectin. In brief,
cells cultured in different conditions were fixed in 100% methanol (in 48 well plates) at
-20°C for at least 24 hours, blocked by 1% BSA in TBS-T (0.05%), and probed with
primary and secondary antibodies.
The primary antibodies against bone matrix proteins
used were: rabbit anti-human osteocalcin (Chemicon, #AB1858) (1:500 dilution); rabbit
anti-human osteopontin (Chemicon, #AB1870) (1:500 dilution), and rabbit anti-human
osteonectin (Chemicon, #AB1858) (1:1000 dilution). The secondary antibody used was
Chapter 3 Roles of SPHK Inhibitors in Human BM- and AD- MSCs Differentiation
70
goat anti-rabbit IgG (Pierce, #31460) (1:5000 dilution). Antibodies were all diluted in
1% BSA in TBS-T (0.05%).
3.1.4 Gene Level Expression Detection
3.1.4.1 RNA Extraction
RNA was extracted from different samples and purified using RNeasy Mini Kit
(QIAGEN, #74106) according to the manufacturer’s instructions; purified RNA
samples were stored at -80°C until further use.
3.1.4.2 Reverse Transcriptional PCR
Purified RNA was reverse transcribed to cDNA using MuLV reverse transcriptase
RNase H (Fermentas, #EP0451) according to the manufacturer’s instructions. Based on
the optimized conditions, initially, RNA was mixed with master mix 1 which contained
Oligo dT primers and incubated at 75°C for 5 minutes, then immediately chilled on ice.
This is called the ‘first-strand reaction’ in RT-PCR. The ratio of master mix 1
components used is shown below:
component
1 reaction (μl)
Poly dT primers
1
μ
l
RNA 10ng
Water (RNase free) (depends on RNA volume)
Total
13
μ
l
Afterwards, master mix 2 was prepared and added into each reaction tube. Reactions
were incubated at 37°C for 60 minutes, and heated at 95°C for 5 minutes to deactivate
the reverse transcriptase. This is the ‘second-strand reaction’ in the reverse transcription
PCR. The ratio of each component for master mix 2 is shown below.
Chapter 3 Roles of SPHK Inhibitors in Human BM- and AD- MSCs Differentiation
71
Component
1 reaction (μl)
dNTP master mix (10Mm) 1
RNase free inhibitor
1 (1
μ
l for 10 reactions)
5 x M-MuLV reaction buffer 4
M-MuLV reverse transcriptase 1 (1ul for 10 reactions)
Total 7ul
3.1.4.3 Real Time PCR
The quantitative real time PCR used in this study was followed the protocol developed
by Leong et al. (2007). This is a novel method using linear double-stranded DNA
molecules as the standards instead of using the typical gene-in-plasmid format.
Standards for different genes were obtained from the serial dilutions of the cDNA got
from the reverse transcription PCR. The exact numbers of DNA copies in the standards
was calculated by the method introduced in Section 3.1.4.3.2 below. Three dilutions of
the standards (such as 1x10
4
copies/μl, 1x10
5
copies/μl, and 1x10
6
copies/μl) were used
for testing the mRNA expression of each gene. Thus, using the standards as controls,
the copy numbers of mRNA expressed in the sample could be calculated. More details
are addressed below.
3.1.4.3.1 Primers Design
Primers for genes of interest were designed according to their cDNA sequences from
PubMed. The uniqueness of the suitable pairs chosen was checked by “blast”
( />). All primers were purchased from Research
BioLab (Singapore). With the designed primers, cDNA from different samples were
amplified by PCR, and verified based on their size in a 2% agarose gel under UV
illumination.
The genes and corresponding primers information is listed below.
Chapter 3 Roles of SPHK Inhibitors in Human BM- and AD- MSCs Differentiation
72
Gene Primer sequence Product size
Human
SPHKs
SPHK1 FW: atgctggctatgagcaggtc
RW: gtgcagagacagcaggttca
101bp
SPHK2 FW: ggaggaagctgtgaagatgc
RW: gcacagcaacagtgagcagt
139bp
Osteogenic
differentiation
related
Osteocalcin FW: gcagagtccagcaaaggt
RW: cagccattgatacaggtagc
70bp
Osteopontin FW: actaccatgagaattgcagtga
RW: tcctcagaacttccagaatcag
70bp
Osteonectin FW: ccacctggactacatcgg
RW: tcctcatccctctcatacag
109bp
Adipogenic
differentiation
related
Fatty acid binding
protein 4
FWD: aaccttagatgggggtgtcc
RWD: gtggaagtgacgcctttca
123bp
Lipoprotein lipase FWD: ccggtttatcaactggatgg
RWD: tggatcgaggccagtaattc
145bp
Leptin
FWD: tgacaccaaaaccctcatca
RWD: atgaagtccaaaccggtgac
102bp
3.1.4.3.2 PCR Standards Preparation
Gel bands of the PCR products of the different genes were excised by a blade under UV.
DNA was extracted and purified using a DNA extraction kit (Fermentas, #K0513)
according to the manufacturer’s instructions. Briefly, gel segments which contained the
DNA were incubated with 6M sodium iodide solution, which could bind DNA, at 55°C
for 5-10 minutes, until the gel dissolved. Silica powder suspension was added and the
entire solution was mixed by vortexing, and incubated for 5-10 minutes at 55°C. The
silica powder/DNA mixture was centrifuged at 10,000g. Pellets collected were washed
three times with the washing buffer provided in the kit, which contained unstated
concentrations of Tris, NaCl and EDTA. DNA was eluted by incubating the pellets with
suitable amount of sterile deionized water at 55°C, and quantified with a
spectrophotometer (NanoDrop ND-1000). All of the 55°C incubation period stated
above could vary, based on the estimated amount of processing DNA. Copies of the
Chapter 3 Roles of SPHK Inhibitors in Human BM- and AD- MSCs Differentiation
73
DNA molecules in the different samples were calculated based on the knowledge of the
average mass of a base pair. The calculation method is addressed below:
The average mass of a base pair in DNA is about 615 dalton according to their
structures (see table below); a dalton (Da), named in honor of the British chemist John
Dalton (1766-1844), is equivalent to 1/12 the mass of the 12C which equals
1.66053873E-27 kg, i.e., 1 Da = 1 atomic mass unit.
Average Nucleotide Mass
DNA Sub-Unit Da 10
-21
g Molecular Formula
dAdenosine Monophosphate (A) 312.2 0.5184 C
10
H
11
N
5
O
5
P
Thymidine Monophosphate (T) 301.2 0.5001 C
10
H
10
N
2
O
7
P
Guanosine Monophosphate (G) 328.2 0.5450 C
10
H
11
N
5
O
6
P
dCytidine Monophosphate (C) 288.2 0.4785 C
9
H
11
N
3
O
6
P
For calculation, if a designed PCR product is 100bp, and the purified DNA
concentration is 10ng/μl, copies of DNA in this sample is calculated in the following
way:
1) Since the PCR product is double strand DNA, and the designed size is 100bp, the
mass of one copy of DNA is: average mass/base pair x size of product =
615x100=61500 (Da), which is equivalent to 61500x1.66053873E-27≈1.02E-22 (kg). In
other words, one molecule of a designed double strand DNA weighs around 1.02E-22
kg.
2) 1μl of DNA solution contains 10ng DNA, which means, 1μl of DNA solution
contains 10ng/1.02E-22kg≈10
11
(copies of molecules).
Serial dilutions were made to generate standards for real time PCR.
Chapter 3 Roles of SPHK Inhibitors in Human BM- and AD- MSCs Differentiation
74
3.1.4.3.3 Quantitative Real Time PCR
A quantitative real time PCR using a thermocycler (Stratagene Mx 3000P) was
performed on the samples using the primers designed, with serial dilutions of standards
and a set of no-template-controls (NTC) to detect particular gene expression in different
samples, as previously described by Leong et al. (2007). Briefly, QuantiTect SYBR
Green PCR kit was used for master mix of PCR reagents (QIAGEN, #204143). Thermal
cycling conditions for PCR and dissociation routines were: 95°C for 10 minutes, 45
cycles of 94°C for 30 seconds, 60°C for 45 seconds, 72°C for 30 seconds, 95°C for 1
second, 60°C for 30 seconds, slow ramp up to 95°C at 0.5°C per second with
continuous measurement, 95°C for 10 seconds, 25°C for 30 seconds, end (dissociation
phase is in italics). Results are presented by the DNA copy numbers in different genes.
3.1.5 Quantification of the Stem Cell Growth (PicoGreen Assay)
Human BM- and AD- MSCs were quantified by detecting the total DNA in the samples
by using Quant-iT PicoGreen dsDNA Reagent (Molecular Probes, USA), which is an
ultra-sensitive fluorescent nucleic acid stain for double-strand DNA, following the
manufacturer instructions. Briefly, cells were cultured in 48-well plates under different
culture conditions. When the cells are ready for testing their DNA components, cells
were washed twice with 1x PBS, and 200μl of distilled water was added into each well
and at least five rounds of freeze-thaw (-80°C and 37°C) were performed to lyse the
cells thoroughly. Cells were then centrifuged and the supernatants that contained DNA
components were measured by PicoGreen.
Chapter 3 Roles of SPHK Inhibitors in Human BM- and AD- MSCs Differentiation
75
3.1.6 Statistical Analysis
Results are expressed as mean ± SD. Significance between mean values was determined
by Student’s t-test. Samples were analyzed by two-sample equal variance, and two-
tailed distribution, with a value of P< 0.05 considered significant.
3.2 RESULTS
3.2.1 RNA Expression of SPHK1 and SPHK2 in Human BM- and AD-
MSCs
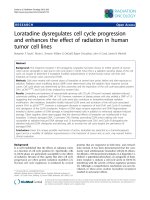
Human BM-MSCs and AD-MSCs were tested on their mRNA expression of SPHK1
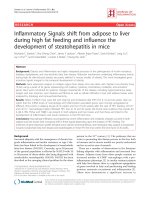
and SPHK2 using real time PCR, and the results are summarized in Figure 3.1.
Expression of SPHK in human MSCs
0
50
100
150
200
250
300
BM AD-MSC-donor1 AD-MSC-donor2
copies/10ng of total RNA
SPHK1
SPHK2
SPHK expression difference in different cells
Cells SPHK1/SPHK2 ratio
Human BMSCs 7.964706
human ADSCs (donor1) 5.59719
human ADSCs (donor2) 6.877579
Figure 3.1 RNA expression of SPHK (1&2) in human BM- and AD- MSCs. A,
RNA samples were extracted from the cells cultured in a normal growth media, and
quantified using real time PCR. SPHK1 and SPHK2 copies in 10ng of total RNA are
shown in; B, ratio of SPHK1/SPHK2 in different samples. Results are the average + the
standard deviation of triplicate samples from at least three separate experiments.
A
B
Chapter 3 Roles of SPHK Inhibitors in Human BM- and AD- MSCs Differentiation
76
The results show that both human BM- and AD- MSCs express SPHK1 and SPHK2,
however, SPHK1 shows a higher level of expression than SPHK2.
3.2.2 Compounds Inhibition on Human MSCs Growth
3.2.2.1 Effects of Different Dosages of DMS and CP6 on Human BM- and
AD- MSCs Growth
CP6 and DMS were first tested at different concentrations for their potential cytotoxic
and/or anti-proliferative effects. Six doses of DMS and CP6 (0.5μM,
1μM, 3μM, 5μM, 10μM, and 20μM) were used on human BM- and AD- MSCs and
cell-growth was measured. The results are shown in Figure 3.2.
Effects of DMS/CP6 on human BM-MSCs growth
0%
20%
40%
60%
80%
100%
120%
0uM 0.5uM 1uM 3uM 5uM 10uM 20uM
compounds conc.
cell growth
DMS
CP6
*
*
*
**
**
*
3.2A
*
*
Chapter 3 Roles of SPHK Inhibitors in Human BM- and AD- MSCs Differentiation
77
Figure 3.2 Effects of DMS/CP6 on human BM- and AD- MSCs growth. Human
BM-MSCs (A) and AD-MSCs (B) were cultured in 10% FBS, supplemented with
different doses of DMS or CP6. Cells were cultured for four days and the cell number
was measured by the PicoGreen assay. Results are the average + the standard deviation
of triplicate samples from at least three separate experiments. (*P<0.01 vs. 0μM, i.e.
control w/o any DMS or CP6; **P<0.05 vs. 0μM, i.e. control w/o any DMS or CP6.
Student’s t-test)
The results presented in Figure 3.2 show that human BM-MSCs are more vulnerable
than AD-MSCs, when treated with DMS or CP6. More specifically, in human BM-
MSCs (Figure 3.2A), DMS significantly inhibited stem cells growth at amounts of 3μM
or higher, and CP6 inhibited the stem cells growth at amounts of 10μM or higher.
However, for human AD-MSCs (Figure 3.2B), DMS showed to inhibit stem cells
growth significantly only when at amounts of 5μM or higher, and CP6 inhibited stem
cells growth at amounts of 20μM.
To maintain similar experimental conditions for both human BM- and AD- MSCs, the
following concentrations were chosen: 0.5μM and 1μM of DMS, 0.5μM, 1μM,
and 5μM of CP6.
Effects of DMS/CP6 on human AD-MSCs growth
0%
20%
40%
60%
80%
100%
120%
0uM 0.5uM 1uM 3uM 5uM 10uM 20uM
compounds conc.
cell growth
DMS
CP6
3.2B
*
*
*
**
Chapter 3 Roles of SPHK Inhibitors in Human BM- and AD- MSCs Differentiation
78
In this test, DMS showed to inhibit cell growth at lower concentration than CP6 for both
human BM- and AD- MSCs. One of the possible reasons for this finding could be, that
DMS has no selectivity for SPHK1 and SPHK2, as well as some other enzymes like
DAGK and PKC (as shown in Chapter 2), whereas CP6 is very specific to SPHK1. So
in Figure 3.2, lower concentrations of DMS might inhibit the stem cells growth not only
through inhibiting SPHK1, but possibly also SPHK2, and some other enzymes.
3.2.2.2 Effects of DMSO on Human BM- and AD- MSCs Growth
Since both CP6 and DMS were dissolved in DMSO, the amount of DMSO used in the
working solution of DMS and CP6 were also tested to detect whether it would affect
human BM- and AD- MSCs growth. The results are shown in Figure 3.3.
A
DMSO Function on human BM-MSCs growth
0%
20%
40%
60%
80%
100%
120%
0 1:20,000 1:15,000 1:10,000 1:2,500 1:1,500 1:1,000 1:500
DMSO ratio
Cell growth
*
*
Chapter 3 Roles of SPHK Inhibitors in Human BM- and AD- MSCs Differentiation
79
Figure 3.3 Effects of DMSO on human BM- and AD- MSCs growth. Cells were
cultured in 10% FBS, supplemented with different doses of DMSO. Human BM-MSCs
(A) and human AD-MSCs (B) were cultured for four days and the cell number was
measured by PicoGreen assay. Results are the average + the standard deviation of
triplicate samples from at least three separate experiments. (*P<0.01 vs. DMSO ratio=0,
Student’s t-test).
The maximum amount of DMSO ever used for dissolving DMS and CP6 in this
research project was 0.04% (1:2500). The results presented in Figure 3.3 clearly
demonstrate that the DMSO amount utilized in these experiments was completely safe,
as it did not inhibit at all cell growth compared with untreated cells (DMSO=0).
3.2.3 Function of CP6 and DMS in Human BM- and AD- MSCs
Differentiation
Human BM- and AD- MSCs are multipotent cells that are capable of differentiating
along osteogenic, chondrogenic, and adipogenic pathways, when stimulated under
appropriate conditions (Section 1.4.4 Clinical Potentials of MSCs). In this study, only
osteogenic and adipogenic differentiation pathways were studied due to the high cost
DMSO Function on human AD-MSCs growth
0%
20%
40%
60%
80%
100%
120%
140%
0 1:20,000 1:15,000 1:10,000 1:2,500 1:1,500 1:1,000 1:500
DMSO ratio
Cell growth
*
*
B
Chapter 3 Roles of SPHK Inhibitors in Human BM- and AD- MSCs Differentiation
80
and limited numbers of the MSCs. The culture conditions for these two differentiation
pathways were addressed in Section 3.1.1.4 Stem Cells Osteogenic and Adipogenic
Induction Culture.
In the following sections, human BM- and AD- MSCs osteogenic differentiation is
addressed first, followed by their adipogenic differentiation study (Section 3.2.3.2
Function of the compounds in human BM- and AD- MSCs adipogenic differentiation).
3.2.3.1 Function of the CP6 and DMS in Human BM- and AD- MSCs
Osteogenic Differentiation
In human BM- and AD- MSCs osteogenic differentiation study, hFOB cells were used
as control cells, as this cell line is capable of osteoblastic differentiation and bone
formation (Yen et al., 2007).
Human BM-MSCs, AD-MSCs, and the hFOB cells were cultured in 6-well plates (for
detecting the RNA expression of several genes in osteogenic differentiation, by real
time PCR), or in 48-well plates (for detecting the mineralization in different samples by
Alizarin Red S staining). The cells growth media was changed to the differentiation
media (Section 3.1.1.4 Stem Cells Osteogenic and Adipogenic Induction Culture) on the
second day. Culture media was changed every three days and the cells were cultured in
the differentiation media for 14 or 28 days.
3.2.3.1.1 Alizarin Red S Staining for Mineralization in Human MSCs Osteogenic
Differentiation
Alizarin Red S stains the mineralization during stem cells differentiation, which is
regarded as a late stage marker in the osteogenic differentiation pathway.
Chapter 3 Roles of SPHK Inhibitors in Human BM- and AD- MSCs Differentiation
81
In all our osteogenic differentiation samples, Alizarin Red S staining did not show a
very positive red color under pH=4.1-4.3. However, when 200μl of 0.5% NH
3
OH was
added into each well, the staining color became redder (as the pH became more
alkaline), and more visible. The staining was quantified by measuring the absorbance at
500nm, and the results are shown in Figure 3.4.
Alizarin Red S Staining of DMS/CP6 treated hFOB cells in Osteogenic Differentiation
0
0.5
1
1.5
2
2.5
3
3.5
4
4.5
5
ctrl OD OD+0.5uM
DMS
OD+1uM
DMS
OD+0.5uM
CP6
OD+1uM
CP6
OD+5uM
CP6
culture conditions
Absorbance at 500nm
14 days
28 days
*
**
*
*
*
3.4A
*
*
Chapter 3 Roles of SPHK Inhibitors in Human BM- and AD- MSCs Differentiation
82
Alizarin Red S Staining of DMS/CP6 treated human BM-MSCs in Osteogenic
Differentiation
0
0.2
0.4
0.6
0.8
1
1.2
1.4
1.6
1.8
ctrl OD OD+0.5uM
DMS
OD+1uM
DMS
OD+0.5uM
CP6
OD+1uM
CP6
OD+5uM
CP6
culture conditions
Absorbance at 500nm
14 days
28 days
*
**
*
3.4B
Alizarin Red S Staining of DMS/CP6 treated human AD-MSCs in
Osteogenic Differentiation (type 1)
0
1
2
3
4
5
6
ctrl OD OD+0.5uM
DMS
OD+1uM
DMS
OD+0.5uM
CP6
OD+1uM
CP6
OD+5uM
CP6
culture conditions
Absorbance at 500nm
14 days
28 days
3.4C
**
Chapter 3 Roles of SPHK Inhibitors in Human BM- and AD- MSCs Differentiation
83
Figure 3.4 Quantification of the Alizarin Red S staining. Cells were cultured in
normal growth media (ctrl), osteogenic differentiation media (OD), or osteogenic
differentiation media with different dosages of DMS or CP6. HFOB (A), human BM-
MSCs (B) and human AD-MSCs (C & D) were fixed and stained after 14 or 28 days of
culture. The staining was dissolved in 200μl of 0.5% NH
3
OH and the absorbance was
measured at 500nm. Figure C shows the trend from at least two donors cells of human
AD-MSCs. Figure D demonstrates the trend from one donor cells of human AD-MSCs.
Results are the average + the standard deviation of triplicate samples from at least three
separate experiments. (* P<0.01, ** P<0.05, Student’s t-test)
Figures 3.4A shows the staining from hFOB cells going through the osteogenic
differentiation. It is clear that the cells showed more staining when induced with the
osteogenic differentiation media (OD), as compared with the non-induced sample (ctrl),
and this finding is consistent in both day 14 and day 28 samples. Interestingly, the cells
induced with the osteogenic differentiation media supplemented with 0.5μM of DMS,
had a higher level of staining (Figure 3.4A, OD+0.5μM DMS 28 days vs. OD 28 days,
P<0.01), indicating that 0.5μM DMS promoted more mineralization formation. A
similar trend was found in 0.5μM of CP6 treated osteogenic-induced cells (OD+0.5μM
CP6) in both 14-day and 28-day samples. However, in the cells induced with the
Alizarin Red S Staining of DMS/CP6 treated human AD-MSCs in
Osteogenic Differentiation (type 2)
0
0.5
1
1.5
2
2.5
ctrl OD OD+0.5uM
DMS
OD+1uM
DMS
OD+0.5uM
CP6
OD+1uM
CP6
OD+5uM
CP6
culture conditions
Absorbance at 500nm
14 days
28 days
**
**
**
*
**
**
**
3.4D
Chapter 3 Roles of SPHK Inhibitors in Human BM- and AD- MSCs Differentiation
84
osteogenic differentiation media together with 1μM of DMS, the staining in 28-day
culture sample was lower than that from 0.5μM of DMS treated samples (Figure 3.4A,
OD+0.5μM DMS 28 days vs. OD+1μM DMS 28 days, P<0.05), and is similar to the
osteogenic induced samples without compound treatment. Similarly, 1μM of CP6 did
not show to promote any enhancement on differentiation above the untreated samples.
An interesting finding in the CP6 treated osteogenic-induced samples is that, after 14
days culture, 5μM of CP6 seemed to promote the osteogenic differentiation (OD+5μM
CP6 14 days vs. OD, P<0.01). Unexpectedly, in the sample cultured for 28 days, 5μM
of CP6 attenuated the osteogenic differentiation in osteogenic-induced cells cultured
(OD+5μM CP6 28 days vs. OD 28 days, P<0.01).
In osteogenic-induced hFOB cells, cultured for 14 days with 0.5μM DMS (OD+0.5μM
DMS), 1μM DMS (OD+1μM DMS), or 1μM CP6 (OD+1μM CP6), the quantified
staining showed to be similar to the osteogenic induced samples without DMS/CP6
(OD).
Figure 3.4B shows the osteogenic differentiation in human BM-MSCs under different
conditions. Similarly with what we got from hFOB test, human BM-MSCs induced with
the osteogenic differentiation media showed more staining after 28 days culture
compared to the non-induced control (OD 28 days vs. ctrl 28 days, P<0.01). However,
osteogenic-induced cells treated with 0.5μM of DMS, 0.5μM of CP6, or 1μM of CP6
for 14 days or 28 days, did not show much difference compared with the induced cells
without inhibitors. Interestingly and similarly with the hFOB test, 1μM of DMS and
5μM of CP6 inhibited the differentiation of the cells-induced for 28 days (OD+1μM
DMS 28 days vs. OD, P<0.05; OD+5μM CP6, P<0.01). Osteogenic-induced samples
Chapter 3 Roles of SPHK Inhibitors in Human BM- and AD- MSCs Differentiation
85
cultured with 0.5μM or 1μM of DMS or 0.5μM, 1μM or 5μM of CP6 for 14 days, did
not show much difference when compared to the samples without inhibitors (OD 14
days).
When human AD-MSCs were studied for their osteogenic differentiation, cells from
certain donors showed to respond positively (or non-negatively) to the osteogenic
differentiation media, and these cells were categorized as type 1 AD-MSCs in this study.
Some cells from other donors showed to respond negatively to the osteogenic
differentiation media, and these cells were categorized as type 2 AD-MSCs.
Figure 3.4C shows the staining in type 1 human AD-MSCs osteogenic differentiation
under different culture conditions. The only conclusive finding in Figure 3.4C is that,
the induced cells cultured with 0.5μM of DMS for 28 days showed more staining as
compared with the induced sample without DMS/CP6 cultured for 28 days (OD+0.5μM
DMS 28 days vs. OD 28 days, P<0.05), which is consistent with what we got from the
hFOB test.
Type 2 human AD-MSCs osteogenic differentiation under different culture conditions is
shown in Figure 3.4D. In this type of AD-MSCs, the presence of 0.5μM of DMS
increased the staining in both 14 days and 28 days culture as compared with the
osteogenic-induced sample without inhibitors (OD+0.5μM DMS 14 days vs. OD 14
days, P<0.05; OD+0.5μM DMS 28 days vs. OD 28 days, P<0.01). Moreover, 0.5μM
and 1μM of CP6 also increased the staining in the 28 days culture samples (OD+0.5μM
CP6 28 days vs. OD 28 days, P<0.05; OD+1μM CP6 28 days vs. OD 28 days, P<0.05).
Chapter 3 Roles of SPHK Inhibitors in Human BM- and AD- MSCs Differentiation
86
Similarly with the hFOB and human BM-MSCs results, 5μM of CP6 attenuated the
staining in the induced cells cultured for 28 days (OD+5μM DMS 28 days vs. OD 28
days, P<0.05). None of the induced cells cultured with 1μM of DMS, 0.5μM of CP6,
1μM of CP6, or 5μM of CP6 for 14 days showed any difference as compared with the
induced sample without DMS/CP6 (OD 14 days).
3.2.3.1.2 Osteocalcin, Osteopontin, and Osteonectin Expression of DMS/CP6
treated Stem Cells in the Osteogenic Differentiation
Besides detecting the degree of the osteogenic differentiation of human BM- and AD-
MSCs by Alizarin Red S staining, we also investigated the expression of differentiation-
related genes in DMS/CP6-treated cells during the osteogenic differentiation.
The expressions of osteocalcin, osteopontin, and osteonectin, generally regarded as
osteogenic differentiation markers (Leong et al., 2006b), were studied.
RNA expression and protein level expression of these three proteins were investigated
by real time PCR and fluorescence immunostaining.
3.2.3.1.2.1 RNA Expression of Osteocalcin, Osteopontin, and Osteonectin
Cells, cultured under the different culture conditions in our experimental set up, were
collected after 14 or 28 days. RNA samples and cDNA samples were prepared using the
methods described in Section 3.1.4 Gene Level Expression Detection. Real-time PCR
was then performed to investigate each sample collected for the RNA expression of
osteocalcin, osteopontin, and osteonectin in DMS/CP6 treated cells. The results are
summarized in Figure 3.5 (for osteocalcin), Figure 3.6 (for osteopontin), and Figure 3.7
(for osteonectin).
Chapter 3 Roles of SPHK Inhibitors in Human BM- and AD- MSCs Differentiation
87
1) Osteocalcin Gene Expression
Osteocalcin gene expression of DMS/CP6 treated hFOB cells and human BM- and AD-
MSCs in osteogenic differentiation is shown in Figure 3.5
Osteocalcin RNA expression of DMS/CP6 treated human BM-MSCs in
Osteogenic Differentiation
0
10000
20000
30000
40000
50000
60000
70000
ctrl OD OD+0.5uM
DMS
OD+1uM
DMS
OD+0.5uM
CP6
OD+1uM
CP6
OD+5uM
CP6
culture conditions
copies per 150ng of total
RNA
14 days
28 days
3.5B
*
*
*
Osteocalcin RNA expression of DMS/CP6 treated hFOB in
Osteogenic Differentiation
0
5000
10000
15000
20000
25000
30000
ctrl OD OD+0.5uM
DMS
OD+1uM
DMS
OD+0.5uM
CP6
OD+1uM
CP6
OD+5uM
CP6
culture conditions
Copies per 150ng total RNA
14 days
28 days
*
*
*
*
*
*
*
*
3.5
A
*
*
Chapter 3 Roles of SPHK Inhibitors in Human BM- and AD- MSCs Differentiation
88
Figure 3.5 Osteocalcin RNA expression. Cells were cultured in normal growth
media (ctrl), osteogenic differentiation media (OD), or osteogenic differentiation media
with different dosages of DMS or CP6. After 14 or 28 days culture, cells were lysed for
total RNA extraction, and cDNA from each sample was used in real time PCR, for
detecting copy numbers of osteocalcin expressed in hFOB (A), human BM-MSCs (B)
and human AD-MSCs (C & D). Figure C shows the trend from at least two donors cells
of human AD-MSCs. Figure D demonstrates the trend from one donor cells of human
AD-MSCs. Results are the average +
the standard deviation of triplicate samples from
at least three separate experiments. (* P<0.01, ** P<0.05, Student’s t-test)
Figure 3.5A shows the osteocalcin gene expression from hFOB cultured in the
osteogenic differentiation-induction media and treated or not with DMS/CP6. The
results show more osteocalcin gene-expression after 28 days of culture in the osteogenic
induction media as compared with the non-induced control cells (OD 28 days vs. ctrl 28
Osteocalcin RNA expression of DMS/CP6 treated human AD-MSCs
(type 1) in Osteogenic Differentiation
0
5000
10000
15000
20000
25000
30000
ctrl OD OD+0.5uM
DMS
OD+1uM
DMS
OD+0.5uM
CP6
OD+1uM
CP6
OD+5uM
CP6
culture conditions
copies per 150ng total RNA
14 days
28 days
**
**
*
*
**
*
*
3.5C
Osteocalcin RNA expression of DMS/CP6 treated AD-MSCs (type 2) in
Osteogenic Differentiation
0
5000
10000
15000
20000
ctrl OD OD+0.5uM
DMS
OD+1uM
DMS
OD+0.5uM
CP6
OD+1uM
CP6
OD+5uM
CP6
culture conditions
copies per 150ng total
RNA
14 days
28 days
3.5D
**
*
**
**
*
*