A functional genomics approach for elucidation of novel mechanisms involved in GnRH regulation of the gonadotropins
Bạn đang xem bản rút gọn của tài liệu. Xem và tải ngay bản đầy đủ của tài liệu tại đây (4.81 MB, 185 trang )
A FUNCTIONAL GENOMICS APPROACH FOR
ELUCIDATION OF NOVEL MECHANISMS INVOLVED IN
GnRH REGULATION OF THE GONADOTROPINS
LUO MIN
NATIONAL UNIVERSITY OF SINGAPORE
2007
A FUNCTIONAL GENOMICS APPROACH FOR
ELUCIDATION OF NOVEL MECHANISMS INVOLVED IN
GnRH REGULATION OF THE GONADOTROPINS
By
LUO
MIN
(B.
SC.)
A
THESIS SUBMITTED
FOR
THE DEGREE OF DOCTOR OF PHILOSOPHY
DEPARTMENT
OF BIOLOGICAL SCIENCES
NATIONAL
UNIVERSITY OF SINGAPORE
2007
NOVEL MECHANISMS INVOLVED IN GnRH
REGULATION
OF THE GONADOTROPINS
Luo Min 2007
i
ACKNOWLEDGEMENTS
This thesis is the result of four years work whereby I have been accompanied and
supported by many people. It is a pleasant aspect that I have now the opportunity to
express my heartfelt thanks and gratitude to all of them.
The first person I would like to thank is my supervisor Dr. Philippa Melamed for her
encouragement, patience, guidance and advice throughout this project, without which this
thesis could not have been possible.
I would like to express my gratitude to my wonderful labmates, especially Ms Koh
Mingshi, Ms Tan Siew Hoon, Ms Wang Sihui, Mr Feng Jiajun, Mr Lim Yi Wei Stefan
and Mr Yang Meng for all their suggestions and help.
I also would like to thank my friends: Ms Hu Zhehua, Ms Qin Yafeng, Ms Wang
Xiaoxing, Mr Li Mo, Ms Qian Zhuolei, Mr Yu Hongbing and Mr Hu Yi, for their
invaluable friendship and encouragement. I am really glad that I have come to know them
in my life.
The financial assistance in the form of a research scholarship provided by NUS is greatly
acknowledged.
Finally, I wish to thank my family, for their constant support and unconditional love.
ii
ABSTRACT
The pituitary gonadotropes synthesize and secrete luteinizing hormone (LH) and follicle-
stimulating hormone (FSH), which control reproductive development and function. In
mature gonadotropes and in the LβT2 cell line, both hormones are regulated by GnRH,
but the hormone-specific β subunits are not expressed in the αT3-1 cells, which represent
an immature gonadotrope. In order to identify novel factors and mechanisms involved in
basal and GnRH-induced gonadotropin gene transcription, subtractive hybridization was
carried out to reveal genes expressed in mature LβT2 but not in immature αT3-1 cells, or
those whose expression in LβT2 cells is induced following GnRH treatment. A number
of candidate genes was identified, among them the ubiquitin-conjugating enzyme 4
(ubc4), and calmodulin-dependent serine/threonine protein phosphatase calcineurin, both
of which are up-regulated following GnRH treatment. Functional studies revealed that
GnRH increases estrogen receptor α (ERα) degradation and transactivation of the LHβ
gene in LβT2 cells, apparently through stimulation of ubc4 expression. It was further
demonstrated that the stimulatory effect of ERα on LHβ expression is mediated through
interactions with other regulatory transcription factors Pitx1 and Sf-1 on the proximal
promoter, without necessarily requiring an ERE. Calcineurin is activated by GnRH and
regulates both basal and GnRH stimulated human αGSU promoter activity, through its
target NFAT proteins. NFAT4, which is not affected by GnRH treatment, is
constitutively associated with the human αGSU promoter and mediates the promoter
basal activity, while NFAT3, activated by GnRH through calcineurin, is associated with
the human αGSU promoter only after GnRH treatment and may mediate the GnRH effect
on the human αGSU promoter. Furthermore, calcineurin plays a role in the GnRH-
mediated derepression of the FSHβ gene in the immature gonadotrope αT3-1 cells,
possibly by activating its targets MEF2D and Nur77. Nur77 expression is induced by
GnRH, which is calcineurin-dependent. Both of the two factors are associated with the
FSHβ gene promoter and activate FSHβ gene transcription or promoter activity when
over-expressed. It was further demonstrated that GnRH-activated CaMKI is also required
for GnRH to overcome the histone deacetylase (HDAC)-mediated repression of the FSHβ
gene.
iii
Table of contents
ACKNOWLEDGEMENTS……………………………………………………………… I
ABSTRACT……………………………………………………………… II
TABLE OF CONTENTS…………………………………………………………………… III
LIST OF FIGURES……………………………………………………………………… VII
LIST OF TABLES………………………………………………………………… ………X
LIST OF ABBREVIATIONS……………………………………………………………… XII
Chapter 1 Introduction…………………………………………………………… …1
1.1 Gonadotropins 1
1.1.1 Physiology of the gonadotropins 1
1.1.2 Genomic organization of the gonadotropins 1
1.1.3 Biological functions of the gonadotropins 3
1.1.4 Murine αT3-1 and LβT2 gonadotrope cell lines 3
1.2 Molecular regulation of gonadotropin synthesis and secretion 5
1.2.1 Transcriptional regulation of gonadotropin subunits 7
1.2.1.1 Transcriptional regulation of the αGSU subunit 7
1.2.1.2 Transcriptional regulation of the LHβ and FSHβ subunits 11
1.2.2 GnRH induced signaling pathways in stimulation of gonadotropins 14
1.2.2.1 Calcium 16
1.2.2.2 PKC/MAPK pathway 17
1.2.2.3 cAMP/PKA pathway 18
1.2.3 Gonadal peptide mediated regulation of FSHβ gene expression 20
1.2.4 Estrogen (E
2
)-mediated regulation of LHβ gene expression 21
1.3 High throughput approaches for studying gene expression 26
1.4 Hypothesis and aims 31
Chapter 2 Materials and Methods ………………………………………………….32
Page
iv
2.1 Tissue culture 32
2.1.1 Medium and culture conditions 32
2.1.2 Storing of cells 32
2.1.3 Recovery of cells 33
2.1.4 Transient transfection of cells 33
2.1.5 Chemical treatment of cells 34
2.2 Plasmid construction 35
2.2.1 Site-directed mutagenesis of promoters 35
2.2.2 Contruction of expression vectors 38
2.2.3 Construction of siRNA constructs 39
2.2.3.1 Oligonucleotide design 39
2.2.3.2 Annealing of oligos 40
2.2.3.3 Restriction digestion of vectors 41
2.2.3.4 Extraction of DNA from gel 41
2.2.3.5 Ligation of annealed oligos and linearized pSUPER vector 41
2.2.4 Constructs for mammalian two-hybrid assay 42
2.3 Isolation, verification and maxiprep of plasmids 43
2.3.1 Transformation of plasmids into Escherichia coli (E.coli) cells 43
2.3.2 Plasmid isolation and verification 44
2.3.3 Large scale plasmid isolation and purification 46
2.4 RT-PCR analysis 46
2.4.1 RNA isolation 46
2.4.2 First strand cDNA synthesis 46
2.4.3 PCR and gel electrophoresis analysis 47
2.4.4 Real-time PCR quantification analysis 50
2.5 Chloroamphenicol acetyl transferase (CAT) assay 52
2.6 Luciferase analysis 53
2.6.1 Mammalian two-hybrid assay 53
2.6.2 Promoter activity study 54
2.7 Statistical analysis 54
v
2.8 Western blot 54
2.9 Subtractive hybridization 57
2.9.1 RNA extraction and mRNA isolation 57
2.9.2 cDNA synthesis and digestion 57
2.9.3 Ligation of tester with two different adaptors 57
2.9.4 First hybridization 58
2.9.5 Second hybridization 59
2.9.6 Primary PCR amplification 59
2.9.7 Secondary PCR amplification 60
2.9.8 Ligation and sequencing the clones 61
2.10 Chromatin Immunoprecipitation (ChIP) 61
2.11 Plasmid Immunoprecipitation (PIP) 64
Chapter 3 Results 66
3.1 Subtractive hybridization 66
3.1.1 Subtractive hybridization of LβT2 and αT3-1 cells 66
3.1.2 Subtractive hybridization of LβT2 cells with and without GnRH treatment . 68
3.2 GnRH induction of ubc4 expression promotes estrogen receptor ubiquitylation
and trans-activation of the LHβ gene……………………………… …………… 72
3.2.1 GnRH induces ubc4 expression in LβT2 cells…………………………… 72
3.2.2 Over-expression of ubc4 reduces ERα protein levels, as does GnRH…… 74
3.2.3 GnRH reduction of ERα protein levels in gonadotropes is proteasome
dependent………………………………………………………………………… 76
3.2.4 The liganded ERα transactivates LHβ directly in synergy with Sf-1 and Pitx1
without requiring a consensus ERE… ……………………………………… 77
3.2.5 GnRH-induced ubc4 enhances ERα transactivation of the LHβ gene…… 81
3.2.6 Ubc4 increases the synergistic effect of ERα with Sf-1 and Pitx1 on the LHβ
promoter………… ……………………………………………………………….83
3.2.7 Ubc4 over-expression increases the interaction of ERα with Sf-1or Pitx1 84
vi
3.3 Calcineurin is involved in the GnRH activation of the αGSU gene promoter 86
3.3.1 Calcineurin catalytic subunit A expression levels increase in response to
GnRH………………………………………………………………………………86
3.3.2 Calcineurin mediates the basal and GnRH stimulatory effect on the human
αGSU promoter……….… ………………………………………………… ……88
3.3.3 The calcineurin target, NFAT, is necessary for the human αGSU promoter
activity…………………………………………………………………………… 93
3.4 Calcineurin plays a role in the GnRH-mediated derepression of the FSHβ gene
in the immature gonadotrope…………………………….…………………… …102
3.4.1 Inhibition of calcineurin abolishes the GnRH derepression effects on the
FSHβ gene……………………………………….………………….…………….102
3.4.2 Nur77 and MEF2D activate the FSHβ gene.……… … ………….…… 103
3.4.3 The mechanism for Nur77 and MEF2D activation of the FSHβ gene….….107
3.4.4 CaMKs roles in mediating of GnRH effects on the FSHβ gene……… … 108
Chapter 4 Discussion ………………….………………………… ……………… 110
4.1 Differential gene expression in gonadotropes…………………………………110
4.1.1 Differential gene expression in the differentiating gonadotrope 110
4.1.2 Genes up-regulated following GnRH treatment in mature gonadotropes 112
4.2 Ubc4 regulation of LHβ gene expression through increasing ERα
transactivation 115
4.3 Calcineurin is involved in GnRH-stimulated human αGSU promoter activity
122
4.4 The role of calcineurin in GnRH-mediated derepression of the FSHβ gene in
the immature gonadotrope 132
4.5 General conclusion and future work 140
Chapter 5 References 142
vii
LIST OF FIGURES
Figure 1.1: Anatomical and functional connections of the hypothalamic-pituitary axis 2
Figure 1.2: A diagrammatic representation of the gonadotrope cell lineage development in the mouse. 4
Figure 1.3: Overview of the regulation of gonadotropins in the hypothalamic-pituitary-gonadal axis 6
Figure 1.4: Several elements define the αGSU gene expression 10
Figure 1.5: Signal transduction pathways activated by GnRH. .15
Figure 1.6: Schematic model of basal and GnRH-stimulated gonadotropin subunit gene expression. 19
Figure 1.7: Disparity between the binding sites on the LHβ gene proximal promoters of teleosts and
mammals. 22
Figure 1.8: Genomic organization and functional domains of murine ERα. 23
Figure 1.9: The ubiquitin-proteasome pathway 25
Figure 1.10: Overview of the BD PCR-Select subtractive hybridization method. 30
Figure 3.1: The subtracted PCR products for the control skeletal muscle cDNA. 69
Figure 3.2: The subtracted PCR products for the LβT2 cDNA following GnRH treatment. 70
Figure 3.3: Subtractive efficiency was confirmed by reduction of GAPDH abundance after PCR-select
subtraction 70
Figure 3.4: The mRNA levels of ubc4 increase following GnRH treatment in LβT2 cells 73
Figure 3.5: GnRH treatment increases of the protein levels of ubc4 73
Figure 3.6: Transfection of siRNA to knockdown ubc4 increases ERα protein levels in cells exposed to
GnRH 75
Figure 3.7: GnRH exposure of gonadotropes causes a reduction in ERα protein levels. 75
Figure 3.8: Proteasome inhibitor MG132 abates the GnRH effect on ERα protein levels. 76
Figure 3.9: The liganded ERα transactivates two vertebrate LHβ gene promoters in synergy with Sf-1 and
Pitx1. 78
Figure 3.10: The response elements required for the activation of the LHβ gene promoters by ERα 80
Figure 3.11: Ubc4 is involved in mediating the effect of GnRH on the LHβ gene and increases ERα
transactivation. 82
Figure 3.12: Ubc4 increases ERα transactivation, and the synergistic effect of ERα with Sf-1 and Pitx-1 . 83
Figure 3.13: Ubc4 increases ERα interaction with Sf-1 and Pitx1 85
Figure 3.14: GnRH exposure of gonadotropes is followed by an increase the mRNA levels of CnA…… 87
Page
viii
Figure 3.15: GnRH exposure of gonadotropes is followed by an increase in CnA protein levels……… 87
Figure 3.16: Effects of inhibition of calcineurin by CsA on the human αGSU gene promoter activity 90
Figure 3.17: Western analysis to confirm siRNA knockdown of CnA protein. 91
Figure 3.18: Effects of siRNA knockdown of calcineurin on the human αGSU gene promoter activity 91
Figure 3.19: Effects of over-expression of CA-CnA on the human αGSU gene promoter activity. 92
Figure 3.20: RT-PCR analysis of the expression of NFAT in αT3-1 cells 93
Figure 3.21: The relative protein levels of NFAT3 in the nucleus increases following GnRH treatment 95
Figure 3.22: NFAT3 is associated with the human αGSU promoter following GnRH treatment 97
Figure 3.23: NFAT4 is constitutively associated with the human αGSU promoter. .98
Figure 3.24: Effects of over-expression of dnNFAT on the human αGSU gene promoter activity 99
Figure 3.25: The consensus and putative NFAT binding sites between -420 and -224 bp in the human
αGSU subunit promoter region. 100
Figure 3.26: Effects of mutation of putative NFAT binding sites on the human αGSU gene promoter
activity 101
Figure 3.27: RT-PCR analysis of FSHβ mRNA levels in αT3-1 cells incubated with GnRH and/or CsA. 102
Figure 3.28: The putative MEF2 and Nur77 binding sites on the proximal 1kb promoter of the mouse FSHβ
subunit gene 103
Figure 3.29: RT-PCR analysis of the effects of over-expression of various transcription factors on the
gonadotropin gene mRNA levels in αT3-1 cells. 104
Figure 3.30: Effects of over-expression of various transcription factors on the FSHβ proximal promoter
activity 105
Figure 3.31: RT-PCR analysis of Nur77 mRNA levels in αT3-1 cells incubated with GnRH and/or CsA.106
Figure 3.32: RT-PCR analysis of MEF2 mRNA levels in αT3-1 cells incubated with GnRH 106
Figure 3.33: Nur77 is associated with the mouse FSHβ promoter 107
Figure 3.34: MEF2 is associated with the mouse FSHβ promoter. 108
Figure 3.35: CaMKI, but not CaMKIV is activated by GnRH in the αT3-1 cells 109
Figure 3.36: RT-PCR analysis to investigate KN-93 effect on the gonadotropin gene mRNA levels in αT3-1
cells 109
Figure 4.1: The identified transcripts up-regulated by GnRH in LβT2 cells 113
Figure 4.2: Model for the role of GnRH-induced activation of ubc4 and ERα ubiquitylation in the activation
of LHβ gene transcription 121
Figure 4.3: Functional domains and crystal structure of calcineurin A (CnA) 123
ix
Figure 4.4: Schematic representation of functional domains of murine NFAT1 127
Figure 4.5: Signal transduction by Ca
2+
, calcineurin, and NFAT in lymphocytes, cardiac valves and
cardiomyocytes 128
Figure 4.6: Possible model for the role of calcineurin and NFATs in regulating human αGSU promoter
activity 131
Figure 4.7: A diagram of Nur77 functional domains 132
Figure 4.8: MEF2 structure and interaction partners 136
Figure 4.9: Three calcineurin-dependent mechanisms for regulation of MEF2 activity 137
Figure 4.10: The possible model for the role of Nur77 and MEF2D in GnRH mediated FSHβ derepression.
139
x
LIST OF TABLES
Table 2.1: Optimized Fugene 6 Reagent (µL): DNA ratio (µg). 33
Table 2.2: Optimized GenePORTER 2 Reagent (µL): DNA ratio (µg) 33
Table 2.3: Site-directed mutagenesis PCR reaction mix 35
Table 2.4: Site-directed mutagenesis PCR cycling parameters (* extension time: 1min/kb of plasmid length
for plasmid < 6kb in size, 2 min /kb of plasmid length for plasmid > 6 kb) 36
Table 2.5: The primers used for site-directed mutagenesis of csLHβ, rLHβ and human αGSU promoters 38
Table 2.6: The primers used for construction of expression vectors. 39
Table 2.7: Oligonucleotides designed for synthesis of siRNA. 40
Table 2.8: Conditions for annealing of siRNA oligos. 40
Table 2.9: Ligation reaction mix 42
Table 2.10: The primers used for construction of pM and pVP constructs 43
Table 2.11: Primers used for sequencing reactions 44
Table 2.12: Sequencing reaction mix. 45
Table 2.13: Sequencing PCR parameters 45
Table 2.14: Reaction mix for annealing oligo dT to isolated mRNA 46
Table 2.15: PCR mix to analyze gene expression levels by RT-PCR. 47
Table 2.16: PCR cycling parameters to analyze gene expression by RT-PCR 48
Table 2.17: Primers used for RT-PCR analysis 49
Table 2.18: Primers used for real time PCR analysis. 50
Table 2.19: Components of real time PCR reaction mix 51
Table 2.20: Cycling parameters for real time PCR 51
Table 2.21: Components of CAT reaction mix 52
Table 2.22: Buffers used in western blot 56
Table 2.23: Antibodies used in western blot. 56
Table 2.24: The ligation reaction mix in subtractive hybridization 58
Table 2.25: The first hybridization mix in subtractive hybridization.
58
Table 2.26: Preparation of the primary PCR mixture in subtractive hybridization 59
Page
xi
Table 2.27: Cycling parameters for the primary PCR in subtractive hybridization 60
Table 2.28: Preparation of the secondary PCR mixture in subtractive hybridization 60
Table 2.29: Cycling parameters for the secondary PCR in subtractive hybridization 61
Table 2.30: Primers used for amplification of the mouse LHβ and FSHβ promoters in ChIP 64
Table 2.31: Primers used for PCR to amplify pGL2 basic vector as well as the human αGSU promoter in
PIP 65
Table 3.1: The genes expressed in LβT2 but not αT3-1 cells, organized by primary function of gene
product 67
Table 3.2: The genes up-regulated in GnRH-treated cells, organized by primary function of the gene
product 71
xii
LIST OF ABBREVIATIONS
αBE α-basal element
ACTH Adrenocorticotrophic hormone
αGSU Glycoprotein α subunit
AP-1 Activating protein 1
ATF Activating transcription factor
CA-CnA Constitutively activate CnA
CaM Calmodulin
CnA Calcineurin catalytic subunit A
ChIP Chromatin immunoprecipitation
CpH Cyclophilin
CRAC Calcium release-activated current
CRE cAMP response element
CREB cAMP response element binding protein
CRH Corticotropin-releasing hormone
CsA Cyclosporine A
DAG Diacylglycerol
DD Differential display
dnNFAT Dominant negative NFAT
Egr-1 Early growth factor 1
EMSA Electrophoretic mobility shift analysis
ERE Estrogen response element
ERK Extracellular signal regulated kinase
Ets E box
xiii
E1 Ubiquitin activating enzyme
E2 Ubiquitin conjugating enzyme
E3 Ubiquitin ligase
E
2
Estrogen
FSH Follicle-stimulating hormone
FSHβ Follicle-stimulating hormone β-subunit
GH Growth hormone
GnRH Gonadotropin-releasing hormone
GnRHR Gonadotropin-releasing hormone receptor
GSE Gonadotrope-specific element
HAT Histone acetyltransferase
HDAC Histone deacetylase
HPA Hypothalamus-pituitary-adrenal
Io Ionomycin
IP3 Inositol 1,4,5 triphosphate
JNK C-Jun NH
2
-terminal kinase
LB Luria Bertani
LH Luteinizing hormone
LHR Luteinizing hormone receptor
LHβ Luteinizing hormone β-subunit
MAPK Mitogen-activated protein kinase
MEF2 Myocyte enhancer factor-2
NFAT Nuclear factor of activated T cells
NFY Nuclear transcription factor-Y
xiv
N-CoR Nuclear
receptor corepressor
Nur77(Nr4a1) Nuclear receptor subfamily 4, group A, member 1
NBRE Nur77-binding
response element
PAGE Polyacrylamide gel eletrophoresis
PCR Polymerase chain reaction
PGBE Pituitary glycoprotein hormone basal element
PIP Plasmid immunoprecipitation
Pitx1 Pituitary homeobox 1
PKA Protein kinase A
PKC Protein kinase C
PLC Phospholipase C
POMC Pro-opiomelanocortin
PRL Prolactin
SAGE Serial analysis of gene expression
SDS Sodium dodecyl sulphate
Sf-1 Steroidogenic factor 1
siRNA Short interfering ribonucleic acids
Smad Mothers against decapentaplegic-related
SMRT Silencing mediator of retinoic and thyroid hormone receptors
SSH Suppressive subtractive hybridization
TSA Trichostatin A
TSE Trophoblast-specific element
TSH Thyroid-stimulating hormone
Ubc Ubiquitin-conjugating enzyme
1
CHAPTER 1 INTRODUCTION
1.1 Gonadotropins
1.1.1 Physiology of the gonadotropins
The pituitary, a small gland located beneath the hypothalamus, rests in a depression of the
skull base called the sella turcica. It synthesizes and secretes polypeptide hormones
essential for growth, reproduction, metabolic regulation, environmental adaptations and
other biological activities. The pituitary consists of three sections: the anterior lobe, the
intermediate lobe and the posterior lobe. The anterior pituitary contains five hormone-
secreting cell types. One of these, the gonadotrope, synthesizes and secretes two distinct
gonadotropins: luteinizing hormone (LH) and follicle-stimulating hormone (FSH;
Jacobson et al., 1979; Fig 1.1)
1.1.2 Genomic organization of the gonadotropins
The gonadotropins LH and FSH belong to the glycoprotein hormone family, which also
includes thyroid-stimulating hormone (TSH) and chorionic gonadotropins (CG; Pierce
and Parsons, 1981). Both LH and FSH are heterodimeric hormones, sharing a common
αGSU, while possessing a hormone specific β subunit, which defines its biological
activity and physiological specificity (Chin and Gharib, 1986; Gharib et al., 1990). The
common α and specific β subunit genes are localized on different chromosomes.
Synthesis of biologically active LH and FSH requires the coordinated transcription and
noncovalent assembly of the two subunits.
2
A
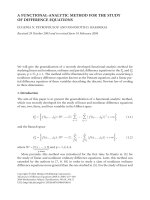
Fig 1.1: Anatomical and functional connections of the hypothalamic-pituitary axis.
(A) The pituitary is a small, bean-shaped gland that sits below the brain in a well-protected position. (B)
Embryologically, anatomically and functionally, the pituitary gland is divided into posterior and anterior
lobes. The latter consists of a collection of endocrine cells: somatotrope, lactotrope, corticotrope,
gonadotrope and thyrotrope. They synthesize and secrete growth hormone (GH); prolactin (PRL);
adrenocorticotropic hormone (ACTH); luteinizing and follicle-stimulating hormone (LH and FSH); and
thyroid-stimulating hormone (TSH), respectively. Nerve cells in the hypothalamus secrete neurohormones
that, via a system of hypophyseal portal vessels, act on the endocrine cells to stimulate or inhibit their
synthesis and secretion. Adapted from Nussey and Whitehead, 1999.
B
3
1.1.3 Biological functions of the gonadotropins
LH and FSH bind to their specific receptors in the gonad to initiate sexual maturation and
maintain cyclical reproductive function (Backstrom et al., 1982). In the testis, LH acts on
the Leydig cells to stimulate synthesis and secretion of steroid hormones, especially the
production of androgens (Dufau, 1988), while FSH acts on the Sertoli cells to stimulate
production of sperm (Tapanainen et al., 1997). In the ovary, FSH stimulates maturation
of ovarian follicles and conversion of androgens to estrogens (Aittomaki et al., 1996;
Kumar et al., 1997), while LH promotes maturation of follicular cells. After the initial
LH receptor (LHR) expression in the small follicles, LH enhances the subsequent stages
of follicular development in granulosa and luteal cells (Richards and Hedin, 1988). The
preovulatory LH surge triggers ovulation of mature follicles by promoting the rupture of
the follicle and the release of the ovum. In addition, LH also leads to the synthesis and
subsequent release of progesterone by the corpus luteum (Norris, 1997).
1.1.4 Murine αT3-1 and LβT2 gonadotrope cell lines
Much of the recent research on the regulation of gonadotropin genes and GnRH signaling
has been carried out using the αT3-1 or LβT2 cell lines, which were generated by
targeted oncogenesis in transgenic mice (Alarid et al., 1996; Turgeon et al., 1996; Windle
et al., 1990). The αT3-1 cell line represents an early gonadotrope that is not fully
differentiated and expresses the pituitary glycoprotein αGSU, GnRH receptor (GnRHr)
and transcription factors steroidogenic factor 1 (Sf-1), pituitary homeobox-1 (Pitx1 or
Ptx1), and early growth response factor-1 (Egr-1), but does not express either the LHβ or
the FSHβ gene (Horn et al., 1991; Windle et al., 1990). The LβT2 cell line represents a
mature gonadotrope that is fully differentiated, expressing the GnRH receptor, Sf-1, Pitx1,
4
Egr-1, both α and LHβ subunits, and LHβ transcription increases in response to GnRH
treatment (Turgeon et al., 1996). Although these cells were originally thought to lack
expression of FSHβ, recent studies have shown that LβT2 cells do express FSHβ, and
support the basal and stimulated FSHβ promoter activity by GnRH and activin (Graham
et al., 1999; Pernasetti et al., 2001; Fig 1.2). Although the transcription factors known to
be essential for LHβ expression are present in both cell lines, LHβ is only expressed in
LβT2 cells (Alarid et al., 1996; Windle et al., 1990). Therefore, the two cell lines provide
useful comparative model systems to investigate FSHβ and LHβ transcriptional
regulation mechanisms at both basal and GnRH-regulated levels.
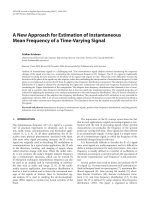
Fig 1.2: A diagrammatic representation of the gonadotrope cell lineage development in the mouse.
The initiation of anterior pituitary differentiation is marked by the expression of the glycoprotein hormone
α subunit gene. The emergence of mature gonadotropes occurs in two stages, with the expression of LHβ
and FSHβ subunit genes on E16.5 and E17.5, respectively. These temporal and distinct stages of
differentiation were captured by target oncogenesis in transgenic mice to generate immortalized immature
and mature pituitary αT3-1 and LβT2 cell lines, respectively. Adapted from Alarid et al., 1996.
Embryonic Day
αT3-1
α, LHβ, GnRHr
Sf-1, Pitx1,Egr-1
FSHβ
+ Activin
α
αT1-1
Early
gonadotrope
Fully
differentiated
gonadotrope
e11.5 e16.5 e17.5
LβT2
α, GnRHr,
Sf-1,
Pitx1,Egr-1
LHβ, FSHβ, Egr-1
+ GnRH
5
1.2 Molecular regulation of gonadotropin synthesis and secretion
The differential synthesis and secretion of gonadotropins are regulated by a number of
factors along the hypothalamus-pituitary-gonadal axis, including gonadotropin-releasing
hormone (GnRH), steroid hormones (estrogen, androgen and progesterone) and gonadal
peptides (activin and inhibin; Gharib et al., 1990; Landefeld et al., 1983; Ling et al., 1986;
Papavasiliou et al., 1986; Fig 1.3). The main regulator of gonadotropins is GnRH, which
is secreted from the hypothalamus in a pulsatile manner to stimulate LH and FSH
expression. GnRH differentially regulates each of the gonadotropin subunit genes
expression through its delivery at the gonadotrope in pulses of different frequency and
amplitude (Dalkin et al., 1989; Haisenleder et al., 1991; Haisenleder et al., 1988; Kirk et
al., 1994). Furthermore, use of GnRH antagonist to block or suppress GnRH actions,
diminishes LH and FSH levels, which leads to failure of sperm production or cessation of
female reproductive cycles (Shupnik, 1990; Shupnik and Fallest, 1994). Gonadal steroids
and peptides act at the hypothalamus to alter GnRH pulsatility and also directly on the
pituitary to either positively or negatively regulate LH and FSH synthesis and secretion
(Dalkin et al., 1992; Landefeld et al., 1984; Roy et al., 1999).
6
Fig 1.3: Overview of the regulation of gonadotropins in the hypothalamic-pituitary-gonadal axis.
GnRH, which is secreted from the hypothalamus, binds to the GnRH receptors on the surface of the
gonadotrope. GnRH acts on the gonadotrope to stimulate the synthesis and secretion of LH and FSH, which
stimulate the production of steroid hormones: testosterone, estrogen and progesterone by the gonads. These
hormones negatively or positively regulate the synthesis of the gonadotropins directly at the pituitary or
indirectly at the hypothalamus by modulating GnRH secretion. The gonadal peptides: inhibin, activin and
follistatin (FS) also have roles in the regulation of gonadotropin gene expression by exerting positive or
negative feedback. Adapted from Brown and McNeilly, 1999.
Hypothalamus
Pituitary
GnRH
Gonads
FSH
and LH
Steroids
Testosterone, Estrogen,
Progesterone
Gonadal Peptides
Inhibin (-ve), Activin (+ve), FS (-ve)
7
1.2.1 Transcriptional regulation of gonadotropin subunits
Transcriptional regulation of gonadotropin subunit genes is mainly achieved by a series
of temporally and spatially expressed transcription factors that are recruited to the
promoters of these genes (Treier et al., 1998). The intrinsic interactions between these
factors or with their specific co-activator complexes initiate and maintain the temporal
and cell-specific expression of gonadotropin genes during the embryonic development.
Initially in the gonadotrope cell lineage, the αGSU transcript is expressed at
approximately embryonic day 11.5 (e11.5) in the mouse, and after a further 5 or 6 days,
LHβ and FSHβ are expressed on e16.5 and e17.5, respectively (Japon et al., 1994).
1.2.1.1 Transcriptional regulation of the αGSU
The common subunit of the glycoprotein hormones, the αGSU, is expressed in three cell
types: gonadotrope, thyrotrope, and trophoblast. The cell-specific expression of this
subunit gene is regulated by distinct sets of cis-acting elements (Hamernik et al., 1992).
In the gonadotrope, more than 15 regulatory elements on the human or mouse αGSU
promoter are reported to define the promoter activity (Fig 1.4). Among these binding
sites, the cAMP response elements (CREs) and the pituitary glycoprotein hormone basal
element (PGBE; Schoderbek et al., 1992) in the 5’ regulatory region are critical for the
αGSU basal promoter activity. Electrophoretic mobility shift analysis (EMSA) and
supershift analysis showed that the CREs could bind different transcription factors,
including CRE binding protein (CREB), activating transcription factors (ATF) 1 and 2,
and c-jun (Drust et al., 1991; Heckert et al., 1995; Heckert et al., 1996). A more recent
report using DNA pull-down assays identified that activating transcription factor 3
8
(ATF3), a transcription factor induced by GnRH, activates the human αGSU promoter
activity by binding the CRE site (Xie et al., 2005). EMSA and screening a mouse cDNA
library revealed that the PGBE binds a LIM-homeodomain transcription factor, LH-2
(Brinkmeier et al., 1998; Roberson et al., 1994). However, PGBE is also bound and
transactivated by P-LIM/Lhx3 (Bach et al., 1995). Use of human αGSU promoter
mutants identified that α-basal element 1 and 2 (αBE1 and 2) are also necessary for the
basal αGSU promoter activity, and these elements were shown to be human specific.
EMSA demonstrated that two factors, designated as αBP1 and αBP2, bind the αBE
region. Southwestern blotting indicated that αBP1 is a heterodimeric protein with the
possible sizes of 54 and 56-KDa, while the attempts to identify αBP2 were unsuccessful
(Heckert et al., 1995). For the mouse αGSU promoter, a specific enhancer region
between -4.6 and -3.7 kb critical for high level expression of αGSU subunit in both
gonadotrope and thyrotrope cells was identified. Transfection studies demonstrated that
the enhancer stimulated the -341/+43 mouse αGSU promoter activity in the αT3-1 cells
(Brinkmeier et al., 1998).
There are also some other weak elements that provide minor contributions to the αGSU
promoter activity, including Sf-1 binding site gonadotrope-specific element (GSE),
GATA2 binding site (αACT), and AP-2 binding site trophoblast-specific element (TSE;
Harris et al., 2003; Johnson et al., 1997b; Steger et al., 1994). In addition, Pitx1 knockout
resulted in suppression of both P-LIM and αGSU gene expression, suggesting that Pitx-1
may also activate αGSU gene expression (Sheng et al., 1996; Tremblay et al., 1998).