Proteomics based identification of potential protein biomarkers for epithelial ovarian cancer
Bạn đang xem bản rút gọn của tài liệu. Xem và tải ngay bản đầy đủ của tài liệu tại đây (13.52 MB, 236 trang )
I
PROTEOMICS-BASED IDENTIFICATION OF
POTENTIAL PROTEIN BIOMARKERS FOR
EPITHELIAL OVARIAN CANCER
ZHAO CHANGQING
(M.B.B.S., M.Sc, CHINA MU)
A THESIS SUBMITTED FOR THE DEGREE OF
DOCTOR OF PHILOSOPHY
DEPARTMENT OF OBSTETRICS & GYNAECOLOGY
NATIONAL UNIVERSITY OF SINGAPORE
June 2007
II
ACKNOWLEDGEMENTS
The work presented in this thesis describes the laboratory research undertaken
by me at the Department of Obstetrics and Gynaecology, Yong Loo Lin School of
Medicine, National University of Singapore (NUS), from August 2003 to June
2007. Throughout this time, I was supported by NUS research scholarship, while
my consumables were funded by TCI and NHG cancer grants.
Firstly, I would like to thank my supervisors, Dr. Loganath Annalamai and Dr.
Mahesh Choolani for their scientific advice, guidance and support during the past
four years. I would also like to extend my gratitude to members in coagulation
laboratory, Dr. Koh Chee Liang Stephen, Ms Chua Seok Eng, Mr Yuen Wai Kong
Raymond, Ms Ng Bee Lian for technical and scientific advice. I am grateful to the
clinical staff and patients, but especially to Professors Arijit Biswas and A.
Ilancheran, Dr. Low Jen Hui Jeffrey, Dr. Ng Soon Yau Joseph, Dr. Lee Weng
Soon James and Dr. Fong Yoke Fai.
I am grateful to Dr. Kothandaraman Narasimhan, Dr. Ponnusamy Sukumar for
their advices, guidance, critical reviewing of my documents and technical support.
I am also thankful to all other Diagnostic Biomarker Discovery Laboratory staffs:
Dr. Nuruddin Mohammed, Dr. Qin Yan, Dr. Ho Sze Yee Sherry, Dr. Zhang
Huoming, Ms Fan Yi Ping, Dr. Aniza Mahyuddin, Ms Tan Lay Geok, Ms Ho Lai
Meng, Ms Liu Lin and Ms Singini Biswas for their insightful discussion, technical
and scientific advice, and moral support.
Finally, I am indebted to my family for their consistent support and inspiration.
III
TABLE OF CONTENTS
ACKNOWLEDGEMENTS II
TABLE OF CONTENTS III
SUMMARY VIII
LIST OF TABLES X
LIST OF FIGURES XI
LIST OF ABBREVIATIONS XIV
CHAPTER 1: INTRODUCTION 1
1.1 Overview 1
1.2 Ovarian cancer 4
1.2.1 Aetiology 4
1.2.1.1 Reproductive and endocrine factors 4
1.2.1.2 Hereditary factors 5
1.2.1.3 Environmental factors 7
1.2.2 Pathology classification 7
1.2.3 Pre-operative Diagnosis of EOCs 10
1.2.3.1 Signs and symptoms 11
1.2.3.2 Blood testing 11
1.2.3.3 Ultrasonography evaluation 12
1.2.4 Management of ovarian cancer patients 13
1.2.5 Intra-operative diagnosis of EOCs 14
1.3 Biomarkers for ovarian cancer 16
1.3.1 The genetic markers 18
1.3.1.1 Gene mutations 19
1.3.1.2 Loss of heterozygosity (LOH) 20
1.3.1.3 DNA methylation 21
1.3.1.4 Changes in gene expression 23
1.3.2 The protein markers 24
1.3.2.1 Protein markers in cyst fluid 24
1.3.2.2 Protein markers in peripheral blood 29
1.3.2.2.1 CA-125 29
1.3.2.2.2 Other EOC-associated molecules
32
1.3.2.2.3 Multiplex platform for biomarker application
39
1.4 Application of proteomics on biomarker discovery 43
1.4.1 Principle of mass spectrometry 43
1.4.1.1 Ionisation techniques 46
1.4.1.2 Mass analyser 47
1.4.1.3 Database searching 49
1.4.2 Approaches for biomarker discovery 50
IV
1.4.2.1 2-DE based research 51
1.4.2.1.1 Technical consideration of 2-DE 51
1.4.2.1.2 2-DE in ovarian cancer
52
1.4.2.2
SELDI-TOF 56
1.4.2.2.1 Technical consideration of SELDI-TOF 56
1.4.2.2.2 SELDI-TOF in ovarian cancer
57
1.4.2.3
Protein microarray analysis 60
1.4.2.3.1 Technical consideration 60
1.4.2.3.2 Protein microarray in ovarian cancer
61
1.4.2.4
MudPIT 61
1.4.2.4.1 Technical consideration 61
1.4.2.4.2 Application of MudPIT
63
1.5 Experiment aims and hypotheses 66
CHAPTER 2: MATERIALS AND METHODS 69
2.1 Materials 69
2.1.1 Human samples 69
2.1.1.1 Ethical approval for use of human samples 69
2.1.1.2 Cyst fluid samples 69
2.1.1.3 Peripheral blood 70
2.1.1.4 Tissue samples 70
2.1.1.5 Cell lines 70
2.1.2 Antibodies, reagents, media, solutions and kits 70
2.1.2.1 Antibodies 70
2.1.2.2 Reagents 71
2.1.2.3 Water and Solutions 72
2.1.2.4 Cell culture media and supplements 73
2.1.2.5 Kits 73
2.1.3 Hardware 73
2.1.3.1 Pipettes, centrifuge tubes, filters 74
2.1.3.2 Blood collection tubes, needles, slides, coverslips 74
2.1.3.3 Centrifuges 74
2.1.3.4 Water bath and thermocycler 74
2.1.3.5 Sonicator 75
2.1.3.6 Proteomics work station 75
2.1.3.7 Microscope, spectrophotometers and transilluminator 75
2.1.3.8 Computer 75
2.1.3.9 Computer software 76
2.2 Methods 77
2.2.1 Sample preparation 77
2.2.1.1 Cyst fluid sample preparation 77
2.2.1.2 Blood sample preparation 78
2.2.1.3 Tissue sample preparation 78
V
2.2.2 Cell culture 78
2.2.2.1 Thawing of frozen cell lines and culture 78
2.2.2.2 Cryopreservation of cell lines 79
2.2.3 Protein quantification 79
2.2.4 SELDI-TOF-MS Analysis 80
2.2.5 SDS-PAGE 81
2.2.5.1 Assembly of apparatus before casting the polyacrylamide gels 81
2.2.5.2 Preparation of SDS-PAGE 82
2.2.5.3 Running SDS-PAGE 82
2.2.6 Native gel electrophoresis 83
2.2.7 Silver staining 84
2.2.8 2-DE 85
2.2.8.1 Sample preparation 85
2.2.8.1.1 Removal of high abundance protein 85
2.2.8.1.2 Sample cleanup
85
2.2.8.2
First-dimension separation 86
2.2.8.3 Second-dimension separation 86
2.2.8.4 Gel staining and image analysis 86
2.2.9 MALDI TOF/MS and MALDI TOF-TOF/MS 87
2.2.9.1 In-gel digestion for mass spectrometry 87
2.2.9.2 MALDI TOF analysis 88
2.2.9.3 MALDI TOF-TOF analysis 88
2.2.9.4 Database search and bioinformatics analysis 89
2.2.10 Western blotting analysis 90
2.2.11 Antibody generation 91
2.2.12 ELISA 91
2.2.13 Measurement of haptoglobin using the PHASE RANGE haptoglobin assay
kits
92
2.2.14 Evaluation of ovarian tumour using ultrasonographic scoring system 93
2.2.15 Measurement of CA-125 level in serum and cyst fluid using sandwich ELISA
method
93
2.2.16 Histochemical and immunohistochemical studies 94
2.2.17 Reverse transcription polymerase chain reaction (RT-PCR) 95
2.2.17.1 Total RNA extraction 95
2.2.17.2 Quantitative analysis of RNA products 95
2.2.17.3 Qualitative analysis of RNA products 96
2.2.17.4 RT-PCR 96
2.2.18 Statistical analysis 97
CHAPTER 3: SELDI-TOF BASED IDENTIFICATION OF
DIFFERENTIALLY EXPRESSED CYST FLUID PROTEIN BIOMARKERS
FOR EOC 99
3.1 Introduction 99
3.2 Protein profiling using SELDI-TOF technology 100
3.3 Protein fractionation and identification using SDS-PAGE and MALDI
TOF-TOF/MS
105
3.3.1 Optimisation of protein precipitation methods for SDS-PAGE 105
VI
3.3.2 Protein fractionation and identification using SDS-PAGE and MALDI TOF-
TOF/MS
107
3.4 Validation of haptoglobin-α
2
subunit using PS20 immunocapture
proteinChip analysis
112
3.5 Validation of haptoglobin-α
2
subunit as potential protein markers in
EOC using conventional immunologic methods
114
3.5.1 Validation using Western blotting analysis 114
3.5.2 Generation of polyclonal antibody and quantitative analysis of haptoglobin-α
subunit in cyst fluid using in-house established ELISA method 116
3.6 Conclusion 118
CHAPTER 4: 2-DE BASED IDENTIFICATION OF DIFFERENTIALLY
EXPRESSED CYST FLUID PROTEIN BIOMARKERS FOR EOC 119
4.1 Introduction 119
4.2 Protein sample preparation prior to 2-DE 120
4.3 Identification of differentially expressed proteins in cyst fluid using 2-DE
based proteomics methods
126
4.3.1 Cyst fluid protein profiles from benign and malignant epithelial ovarian tumours
using 2-DE
126
4.3.2 Identification of differentially expressed proteins in malignant ovarian tumours
using MALDI TOF-TOF/MS
130
4.4 Validation of differentially expressed proteins in cyst fluid using
conventional immunologic methods and RT-PCR
137
4.4.1 Validation of protein identification using 2-DE followed by Western blotting
analysis
137
4.4.2 Validation of differentially expressed proteins in cyst fluid from benign and
malignant ovarian tumours using SDS-PAGE and Western blotting analysis
139
4.4.3 Validation of differentially expressed proteins in tissues from benign and
malignant ovarian tumours using Western blotting analysis
141
4.4.4 Immunohistochemical localisation of ceruloplasmin and haptoglobin in benign
and malignant ovarian tumours
145
4.4.5 Quantitative measurements of ceruloplasmin and haptoglobin in cyst fluid from
benign and malignant ovarian tumours using in-house ELISA method
147
4.4.6 Validation of ceruloplasmin and haptoglobin mRNA expression in ovarian
cancer cell lines using RT-PCR
151
4.5 Conclusions 154
CHAPTER 5: INVESTIGATIONS ON HAPTOGLOBIN AS A
DIAGNOSTIC AND PROGNOSTIC MARKER FOR EOC 156
5.1 Introduction 156
5.2 Pre-operative diagnostic and prognostic significance of haptoglobin in
sera of patients with epithelial ovarian tumours
157
5.3 Development of a novel intra-operative diagnostic kit for detection of
ovarian malignancy using cyst fluid
168
VII
5.4 Conclusion 176
CHAPTER 6: GENERAL DISCUSSION 177
6.1 Hypotheses 178
6.2 Research findings 178
6.3 Significance of this study 181
6.4 Limitations and future directions 182
6.5 Conclusion 185
REFERENCES 186
APPENDIX: PUBLICATIONS
216
VIII
SUMMARY
Epithelial ovarian cancer (EOC) is one of the most common gynaecological
cancers and is a leading cause of death in women worldwide. The current
detection and prognostication protocols generally involve measuring serum
CA-125 levels which have met with limited success. The identification of proteins
released into the cyst fluid of EOC could provide the basis for the discovery of
possible candidate protein markers with diagnostic and prognostic potentials.
Using the proteomics-based methods including surface enhanced laser
desorption/ionisation time of flight (SELDI-TOF), two dimensional gel
electrophoresis (2-DE) and matrix-assisted laser desorption/ionisation time of
flight mass spectrometry (MALDI TOF/MS), the differentially expressed
haptoglobin and ceruloplasmin were identified in cyst fluid from malignant when
compared with benign ovarian tumours. Validation of these biomarkers using
traditional immunologic methods including sodium dodecyl sulphate
polyacrylamide gel electrophoresis (SDS-PAGE), Western analysis,
immunocapture proteinChip analysis, immunohistochemistry and enzyme linked
immunosorbent assay (ELISA) proved the validity of the two proteins as potential
biomarkers. Diagnostic and prognostic significance of haptoglobin in serum as
well as in cyst fluid from patients presenting with various stages of EOCs were
evaluated. Although the serum haptoglobin had limited roles in pre-operative
diagnosis of this disease, the study did provide evidence that pre-operative
serum haptoglobin could serve as an independent prognostic factor in patients
presenting with EOC. Our data indicated that elevated serum haptoglobin levels
were associated with poor outcome for overall survival using both uni- and
multivariate analyses.
IX
The potential application in clinics using cyst fluid haptoglobin levels as an intra-
operative diagnostic method was also tested. It showed that haptoglobin had an
enhanced predictive performance when combined with CA-125 and ultrasound
parameters as a preliminary study using 47 benign and 43 malignant ovarian
tumours giving 88.4% sensitivity and 91.5% specificity with a PPV of 90.5% and
NPV of 89.6% for EOCs. Such intra-operative cyst fluid determination of
haptoglobin levels using a simple test kit with a specific cut-off value has potential
clinical significance in that it could be performed as an adjunct to frozen section
and be utilised to triage women requiring frozen section or sub-specialist consult,
so that these services are more cost-efficient.
X
LIST OF TABLES
Table 1.1 Incidence of ovarian cancer in Singapore, 1968-2002 3
Table 1.2 FIGO staging for primary carcinoma of the ovary 10
Table 1.3 The RMI scoring system 13
Table 1.4 Comparison of ESI and MALDI ionisation methods 47
Table 1.5 Comparison of performance characteristics for tandem mass
spectrometers
48
Table 1.6 Comparison of proteomics technology in clinical application 65
Table 2.1 Composition of mini size SDS-PAGE gel 83
Table 2.2 Composition of mini size native gel 84
Table 2.3 Components for one-step RT-PCR reaction 97
Table 2.4 Condition for one-step RT-PCR reaction 97
Table 3.1 Normalised 17.5 kDa protein peak intensities in cyst fluid from
benign and malignant ovarian tumours
104
Table 3.2 Mean concentration of haptoglobin-α subunit in benign and
malignant ovarian tumours by the ELISA procedure
117
Table 4.1 Proteins identified using 2-DE with MALDI TOF-TOF/MS and
database search in cyst fluid from EOC
136
Table 4.2 Mean concentrations of ceruloplasmin and haptoglobin in cyst
fluids from benign and malignant ovarian tumours by the ELISA
method
149
Table 4.3 Primer pairs used for the amplification for individual gene 151
Table 4.4 RT-PCR reaction condition 152
Table 5.1 Association of serum haptoglobin levels with clinicopathologic
variables
165
Table 5.2 Multivariate survival analysis by Cox regression 165
Table 5.3 Cases with disagreement between frozen section and final paraffin
diagnosis
172
XI
LIST OF FIGURES
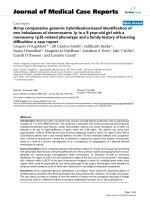
Figure 1.1 Ten most frequent cancers in females in Singapore, 1998-2002 3
Figure 1.2 Molecular marker detection from cancer cells 17
Figure 1.3 Time line indicating the development of proteomics technology 44
Figure 1.4 Illustration of mass spectrometer 45
Figure 1.5 Diagram indicating the database searching for protein
identification.
50
Figure 1.6 Proteomics based methods for biomarker identification 51
Figure 1.7 Disease diagnostics using proteomic patterns 58
Figure 3.1 SELDI-TOF protein profile analysis 102
Figure 3.2 SDS-PAGE (12%) of cyst fluid proteins using three precipitation
methods
106
Figure 3.3 One-dimensional gel electrophoresis of representative cyst fluid
proteins
109
Figure 3.4 Mass spectrum generated by the 15~20 kDa protein band from
SDS-PAGE using MALDI TOF/MS
110
Figure 3.5 Representative CID generated MS/MS spectrum of the amino acid
peptide sequence
111
Figure 3.6 Immunocapture experiments using PS20 proteinChip 113
Figure 3.7 Confirmation of haptoglobin using Western blotting analysis 115
Figure 3.8 Concentrations distribution of cyst fluid haptoglobin-α subunit 117
Figure 4.1 Identification of the high abundance protein in cyst fluid as
albumin
122
Figure 4.2 Representative CID generated MS/MS spectrum of the amino acid
peptide sequence
123
Figure 4.3 SDS-PAGE analysis of representative cyst fluid protein sample
before and after albumin depletion using the anti-albumin antibody
chelating column
124
Figure 4.4 2-DE analysis of representative cyst fluid protein sample before
and after albumin depletion
125
Figure 4.5 Representative silver-stained 2-DE of cyst fluid protein profiles from
benign, borderline tumours as well as early and late stage ovarian
cancers
128
XII
Figure 4.6 Elevated expression of protein spots in cyst fluid from malignant
compared to benign ovarian tumours
129
Figure 4.7 A representative map of silver-stained 2-DE profile obtained from
cyst fluid of EOC
131
Figure 4.8 Identification of ceruloplasmin using MALDI TOF-TOF/MS 132
Figure 4.9 Representative CID generated MS/MS spectrum of the amino acid
peptide sequence
133
Figure 4.10 Identification of haptoglobin using MALDI TOF-TOF/MS 134
Figure 4.11 Representative CID generated MS/MS spectrum of the amino acid
peptide sequence
135
Figure 4.12 Confirmation of identification of ceruloplasmin and haptoglobin
using 2-DE followed by Western blotting analysis
138
Figure 4.13 Western blotting analysis of ceruloplasmin and haptoglobin in cyst
fluid from benign, borderline tumour, early and late stage ovarian
cancers
140
Figure 4.14 H & E staining of representative benign and malignant ovarian
tumours
142
Figure 4.15 Differential expressions of ceruloplasmin and haptoglobin in benign
and malignant ovarian tumour tissues
143
Figure 4.16 Correlations of haptoglobin and ceruloplasmin expression in cyst
fluid and tissue
144
Figure 4.17 Differential expressions of ceruloplasmin and haptoglobin in
ovarian tumour tissue samples examined by
immunohistochemistry
146
Figure 4.18 Western blotting analysis showing binding capacity of goat anti-
human haptoglobin antibody used in ELISA
148
Figure 4.19 Representative standard curve obtained from a serial dilution of
purified haptoglobin
149
Figure 4.20 Concentration distribution of cyst fluid ceruloplasmin and
haptoglobin
150
Figure 4.21 Analysis of integrity of total RNA from ovarian cancer cells using
denaturing formaldehyde agarose gel electrophoresis
152
Figure 4.22 Analysis of mRNA expression of haptoglobin in ovarian cancer
cell lines by RT–PCR
153
Figure 5.1 Concentration distribution of serum haptoglobin and CRP 160
Figure 5.2 Evaluation of diagnostic potential of haptoglobin using ROC curve
analysis
161
XIII
Figure 5.3 Determining suitable serum haptoglobin cut-off value for prognosis
analysis using ROC curves analysis
166
Figure 5.4 Univariate survival analysis of EOCs 166
Figure 5.5 Single regression analysis between haptoglobin and CRP 167
Figure 5.6 Representative picture of the haptoglobin dye binding assay 172
Figure 5.7 Single regression analysis between haptoglobin levels measured
by ELISA and the PHASE RANGE assays
173
Figure 5.8 ROC curve of ultrasound, CA-125 and haptoglobin assay 173
Figure 5.9 Demonstration of designation of the portable device 175
Figure 6.1 Differential expression of IL-22 in ovarian tumour tissue 184
XIV
LIST OF ABBREVIATIONS
µg Microgram
µm Micrometer
2-D DIGE Two dimensional differential in gel electrophoresis
2-DE Two dimensional gel electrophoresis
ACTH Adrenocorticotropic hormone
AFP Alpha-fetoprotein
APC Adenomatous polyposis coli
ATCC American Type Culture Collection
ATIII Antithrombin III
AUC Area under the curve
bp Base pair
BPB Bromophenol blue
BRCA1 Breast cancer 1 Early Onset
BRCA2 Breast cancer 2 Early Onset
BSA Bovine serum albumin
CA125 Cancer antigen 125
CA72-4 Cancer antigen 72-4
CEA Carcinoembryonic antigen
CI Confidence interval
CID Collision induced dissociation
cm Centimetre
CRP C-reactant protein
cSHMT Cytosolic serine hydroxymethyl transferase
CV Coefficients of variance
DCC Deleted in colorectal cancer
DMSO Dimethyl sulfoxide
XV
DNA Deoxy ribonucleic acid
DSRB Domain Specific Review Board
DTT Dithiothreitol
e.g. Example
EAM Energy absorbing molecule
EDTA Ethylenediaminetetraacetic acid
EGF Epidermal growth factor
ELISA Enzyme linked immunosorbent assay
EOC Epithelial ovarian cancer
ESI Electrospray ionisation
FSH Follicle-stimulating hormone
g Centrifugal g force or grams
GTP Guanosine triphosphate
H & E Haematoxylin and eosin
HAP1 Haptoglobin-1 precursor
Hb Haemoglobin
HCl Hydrochloric acid
HPLC High performance liquid chromatography
HRP Horse radish peroxidase
IAA Iodo-acetamide
ICAT Isotope-coded Affinity Tags
IEF Isoelectric focusing
IgG Immunoglobin G
IL Interleukin
IMAC Immobilised affinity capture
kDa Kilo Dalton
LCM Laser capture microdissection
XVI
LH luteinising hormone
LMP Low malignancy potential
LOH Loss of heterozygosity
LPA Lysophosphatidic acid
m/z ratio Mass to charge ratio
MALDI Matrix-assisted laser desorption/ionisation
MCP-1 Monocyte chemoattractant protein-1
M-CSF Macrophage/monocyte colony stimulating factor
mg Milligram
min Minute
ml Millilitre
mM Millimolar
mm Millimetre
MOPS Morpholinopropanesulphonic acid
mRNA Messenger ribonucleic acid
MS Mass spectrometry
MUC-1 Mucin 1
MudPIT Multidimensional protein identification technology
MW Molecular weight
Myc gene Myelocytomatosis virus gene
NaCl Sodium chloride
ND Not detected
ng Nanogram
NP20 Normal phase 20
NPV Negative predictive value
ns Nanosecond
OC 125 Ovarian cancer 125
XVII
OPN Osteopontin
OSE Ovarian surface epithelial cells
PBS Phosphate buffered saline
PCR-SSCP Polymerase chain reaction single strand conformation polymorphism
pg Picogram
pI Isoelectric point
PID Pelvic inflammatory disease
ppm Parts per million
PPV Positive predictive value
PTM Posttranslational modification
PVC Polyvinylchloride
RAS Rats sarcoma gene
RhoGDI Rho G-protein dissociation inhibitor
RMI The risk of malignancy index
ROC Receiver operating characteristics
RP Reversed phase
rpm Revolutions per minute
RPMI Roswell Park Medical Institute
rRNA Ribosome ribonucleic acid
RT Reverse transcription
SAA1 Serum amyloid A1
SAX Strong anion-exchange
SDS-PAGE Sodium dodecyl sulphate polyacrylamide gel electrophoresis
SELDI Surface enhanced laser desorption/ionization
sec Second
TBS Tris buffered saline
Tbx3 T-box transcription factor 3
XVIII
TEMED N,N,N',N'-Tetramethylethylenediamine
TGF-β Transforming growth factor-β
TNF-a Tumour necrosis factor-a
TOF Time-of-flight
TP53 Tumour protein 53
tPA Tissue-type plasminogen activator
TTR Transthyretin
U Unit
uPA Urokinase-like plasminogen activator
UV Ultraviolet
V Volt
VEGF Vascular epidermal growth factor
Vh Volt hour
WCX Weak cation exchange
1
Chapter 1: Introduction
1.1 Overview
1 in 75 women will develop ovarian carcinoma sometime during their lifetime
(Holschneider et al., 2000).
Worldwide there are 204 449 new cases of ovarian
cancer diagnosed annually, and an estimated 124 860 disease-related deaths
(IARC, 2006). Epithelial ovarian cancer is now the leading cause of
gynaecological cancer-related deaths in the UK and the USA (Bristow et al.,
2006). In Singapore, ovarian cancer is the most common gynaecological
malignancy and the fourth most common female cancer (Figure 1.1). The
incidence of this cancer saw a sharp rise from 222 cases in 1968-1972 to 1055
cases in 1998-2002 (Seow. et al., 2004). The age-adjusted rate of incidence for
ovarian cancer was 6.0/100,000 in 1968-1972 and rose to 11.0/100,000 (1998-
2000, Table 1.1).
Despite the progress in cancer therapy, ovarian cancer mortality has remained
virtually unchanged over the past two decades. This is attributed to the
difficulties in early diagnosis and therefore, ovarian cancer has the highest
mortality rate of all the gynaecological cancers (Kristensen et al., 1997). The
overall survival rate of ovarian cancer is about 50% over a 5-year period, and this
is largely dependent upon the stage of the disease at the time of diagnosis.
However, early diagnosis of this cancer results in a 5-year survival rate of about
80% (Kristensen et al., 1997). Regular pelvic examinations and CA-125
measurements followed by radiological diagnosis on an individualised basis have
been the current practice for detection of this enigmatic condition. However,
neither an elevated serum CA-125 level, nor the presence of an ovarian cyst
2
identified by clinical examination and ultrasonography, accurately predicts the
occurrence of an ovarian malignancy (van Nagell et al., 2000).
Recent development in genomic and proteomic technology has made it possible
to apply high throughput methods to detect alterations in gene and protein
expression and their association with disease processes (Welsh et al., 2001;
Zhang et al., 2004). In this context, many polypeptides have been identified to be
highly expressed in tumours with potential clinical utilities. However, there is still
a dearth of clinically useful markers for the diagnosis as well as prognostication of
ovarian cancer.
In this thesis, I explore the possibility of identifying differentially expressed protein
biomarkers in ovarian cyst fluid using combined proteomics-based methods. This
fluid represents a source of potential significance in the identification of target
markers since the protein composition changes occurring in EOC cells will be
probably reflected in the cyst fluid. The exploration of secretion and expression
of these polypeptides may revolutionise the way of diagnosis and prognostication
of ovarian cancer patients.
3
28
14.4
8.1
5.4
5.3
4.9
4.6
4.2
3.3
2.7
0 5 10 15 20 25 30
Breast
Colo-rectum
Lung
Ovary
Cer vix
Stomach
Corpus uteri
Skin
Thyroid
Lymphomas
Figure 1.1 Ten most frequent cancers in females in Singapore, 1998-2002.
Adapted from Seow, (2004)
Table 1.1 Incidence of ovarian cancer in Singapore, 1968-2002
Adapted from Seow, (2004)
Year No.
Age-standardised rate (per
100,000/year)
1968-1972 222 6.0
1973-1977 263 6.3
1978-1982 411 8.6
1983-1987 497 8.8
1988-1992 702 10.5
1993-1997 880 11.4
1998-2002 1055 11.0
4
1.2 Ovarian cancer
1.2.1 Aetiology
The exact aetiopathogenesis of ovarian cancer remains poorly understood.
Current research studies have focused on the reproductive, genetic and
environmental influences in the carcinogenesis of this insidious disease.
1.2.1.1 Reproductive and endocrine factors
Increasing epidemiological studies have indicated that reproductive/hormonal
milieu could be responsible for the high risk of ovarian cancer in postmenopausal
women. The levels of follicle-stimulating hormone (FSH) and luteinising hormone
(LH) reach the highest level in menopausal period. These gonadotropins
together with other steroid hormones such as oestrogen, progesterone and
androgen are believed to be involved in the ovarian tumourigenesis (Risch, 1998;
Ho, 2003). Oestrogen has long been regarded as a causative factor with its level
in ovarian tissue being at least 100 times higher than that in blood. It is
envisaged that the high hormone levels could enable a direct genotoxic effect on
ovarian surface epithelial (OSE) cells (Ho, 2003). In addition to the genetic
damage, studies showed that oestrogen might increase the risk of ovarian cancer
by oestrogen receptor–mediated growth stimulatory responses due to the fact
that expression of oestrogen receptor has been observed in both OSE and
ovarian tumour cells (Karlan et al., 1995; Lau et al., 1999; Syed et al., 2001).
Binding of oestrogen to the receptor could result in cellular proliferation which has
been demonstrated in several oestrogen positive ovarian cancer cell lines
(Langdon et al., 1994). Administration of a competitive agent such as tamoxifen
could significantly inhibit this growth stimulatory effect (Nash et al., 1989).
5
Moreover, numerous oestrogen-regulated proteins have been studied in the
multiple carcinogenesis process of ovarian cancer. These proteins such as cyclin
D1, kallikreins and cathepsin-D are involved in cellular growth, motility and
invasion of the malignant cells (Clinton et al., 1997; Rochefort et al., 2001).
The so called “incessant ovulation” mechanism is considered to be another main
aetiological factor for ovarian carcinogenesis, which was firstly introduced in 1971
due to relatively high risk of ovarian cancer in nulliparous women (Fathalla, 1971).
Most of ovarian cancers originate from OSE cells which cover the entire surface
of ovary and present as a single layer of cuboidal, low columnar or flattened cells
(Blaustein et al., 1979). It was hypothesised that after repeated ovulation, the
repairs of trauma in surface epithelium somehow resulted in aberrant proliferation
and malignant transformation of the OSE cells. This theory was also supported
by the increased incidence of ovarian cancer in the patients subjected to
hyperovulation by drugs (Fathalla, 1971) and protective effects of parity and oral
contraceptive (Rodriguez et al., 1998). Moreover, a study showed that there was
a marked increase of the apoptotic epithelial cells after treatment with
contraceptive in animal models (Rodriguez et al., 1998). This finding suggested
that oral contraceptive might prevent development of ovarian cancer by rendering
the cells which are prone to be malignant to undergo apoptosis.
1.2.1.2 Hereditary factors
Although familial neoplasm only accounts for a small proportion of all ovarian
cancers when compared with the sporadic form of the disease, a strong family
history for malignancy indicates a genetic predisposition to ovarian cancer.
Women with a first-degree relative with ovarian cancer may have as high as 50%
chance of developing this familial disease compared to only 1.4% chance for
6
those without a family history (Schildkraut et al., 1988). For patients with breast
cancer, the relative risk of developing ovarian cancer varies from 0.6 to 6.1
(Hildreth et al., 1981; Cramer et al., 1983a; Koch et al., 1988). Inheritance of
mutated tumour suppressive genes BRCA1 and BRCA2 is believed to have an
important role in development of familial ovarian cancer. Mutations such as point
mutation, gene amplification and chromosomal translocation in these genes
result in loss of function of tumour-suppressive abilities, which is considered as
the first somatic genetic event driving the development of ovarian cancer
(Auersperg et al., 1998). The proteins encoded from these genes function in
transcriptional activation and DNA repair, some of which are key regulators in
maintaining the balance of cellular proliferation and apoptosis (Auersperg et al.,
1998).
For sporadic ovarian cancer, which accounts for more than 95% of the cases, few
mutations of BRCA1 and BRCA2 have been detected, indicating the presence of
genetic changes in other oncogenes and tumour-suppressor genes (Gallion et al.,
1995). Hence, substantial efforts have been directed to determine the altered
region in genome and abnormal genes with lost functions based on mutation or
differential expression study in tumour specimens. More than 60 deregulated
genes have been found in ovarian cancer including HER-2/neu, K-ras, c-myc with
varying frequency (Aunoble et al., 2000), most of which encode proteins that are
involved in growth stimulatory pathways in malignant as well as normal cells.
Activation of these genes due to amplification or mutations has been regarded as
a causative factor in the carcinogenesis of ovarian cancer. For example, It was
reported 32% of ovarian cancer overexpressed HER-2/neu, a gene which
encodes cell membrane receptors involved in transmitting growth stimulatory
signals when compared with normal ovary (Berchuck et al., 1990).
7
1.2.1.3 Environmental factors
The relatively high incidence of ovarian cancer in industrialised countries
suggests that environmental factors or diet may be involved in its aetiology.
Excessive dietary intake of animal fat or red meat have been reported to increase
the risk of EOC (Byers et al., 1983; Shu et al., 1989), while dietary fish and
vegetables have been suggested to have a protective role (La Vecchia et al.,
1987; Shu et al., 1989). The case-control study conducted in 1990 indicated a
positive correlation of increasing consumption of milk with high risk of ovarian
cancer (Mettlin et al., 1990). Moreover, the reports on the association of mumps
infection and risk of ovarian cancer have been conflicting. Cramer and
colleagues found an close relation between childhood mumps and subsequent
ovarian cancer (Cramer et al., 1983b). However, another group from Israel
observed low titres mumps antibody in ovarian cancer patients indicating a weak
aetiological association of this virus with this neoplasm (Menczer et al., 1979).
1.2.2 Pathology classification
Epithelial ovarian tumours account for approximately 60% of all ovarian tumours
and their malignant forms account for more than 90% of all ovarian cancers
(Russell, 1979). According to histologic differentiation, the EOC is classified into
four major groups: serous, mucinous, endometrioid and clear cell tumours. The
malignant tumours usually have the similar histologic architecture of the
endocervix for mucinous cancer, the endometrium for endometrioid cancer and
the fallopian tubes for serous cancer (Russell, 1979). They are also classified as
benign tumours, tumours of low malignant potential (LMP) and malignant tumours
based on cytological features and clinical behaviour. Tumours of low malignant
potential are also named as borderline tumours. This group of tumours is