Identification of serum proteomic biomarkers for early porcine reproductive and respiratory syndrome (PRRS) infection pptx
Bạn đang xem bản rút gọn của tài liệu. Xem và tải ngay bản đầy đủ của tài liệu tại đây (654.63 KB, 16 trang )
RES E AR C H Open Access
Identification of serum proteomic biomarkers for
early porcine reproductive and respiratory
syndrome (PRRS) infection
Sem Genini
1,5*
, Thomas Paternoster
2,6
, Alessia Costa
3
, Sara Botti
1
, Mario Vittorio Luini
4
, Andrea Caprera
1
and
Elisabetta Giuffra
1,7
Abstract
Background: Porcine reproductive and respiratory syndrome (PRRS) is one of the most significant swine diseases
worldwide. Despite its relevance, serum biomarkers associated with early-onset viral infection, when clinical signs
are not detectable and the disease is characterized by a weak anti-viral response and persistent infection, have not
yet been identified. Surface-enhanced laser desorption ionization time of flight mass spectrometry (SELDI-TOF MS)
is a reproducible, accurate, and simple method for the identification of biomarker proteins related to disease in
serum. This work describes the SELDI-TOF MS analyses of sera of 60 PRRSV-positive and 60 PRRSV-negative, as
measured by PCR, asymptomatic Large White piglets at weaning. Sera with comparable and low content of
hemoglobin (< 4.52 μg/mL) were fractionated in 6 different fractions by anion-exchange chromatography and
protein profiles in the mass range 1–200 kDa were obtained with the CM10, IMAC30, and H50 surfaces.
Results: A total of 200 significant peaks (p < 0.05) were identified in the initial discovery phase of the study and 47
of them were confirmed in the validation phase. The majority of peaks (42) were up-regulated in PRRSV-positive
piglets, while 5 were down-regulated. A panel of 14 discriminatory peaks identified in fraction 1 (pH = 9), on the
surface CM10, and acquired at low focus mass provided a serum protein profile diagnostic pattern that enabled to
discriminate between PRRSV-positive and -negative piglets with a sensitivity and specificity of 77% and 73%,
respectively.
Conclusions: SELDI-TOF MS profiling of sera from PRRSV-positive and PRRSV-negative asymptomatic piglets
provided a proteomic signature with large scale diagnostic potential for early identification of PRRSV infection in
weaning piglets. Furthermore, SELDI-TOF protein markers represent a refined phenotype of PRRSV infection that
might be useful for whole genome association studies.
Keywords: Porcine reproductive and respiratory syndrome virus (PRRSV), Pig, SELDI-TOF MS, Proteomic fingerprint
profiling, Biomarkers, Serum
Background
Porcine reproductive and respiratory syndrome (PRRS)
is one of the most important infectious swine diseases
throughout the world [1-3] and is still having, more than
two decades after its emergence, major impacts on pig
health and welfare (reviewed by [4]). The responsible
agent is an enveloped, ca. 15 kb long positive-stranded
RNA virus (PRRSV ) that belongs to the Arteriviridae
family [ 5] and that can cause late-term abortions in sows
and respiratory symptoms and mortality in young or
growing pigs. Once this virus has entered a herd it tends
to remain present and active indefinitely causing severe
economic losses and marketing problems due to high
direct medication costs and considerable animal health
costs needed to control secondary pathogens [6,7].
Pigs of all ages are susceptible to this highly infectious
virus, which has been shown to be present in most pigs
for the first 105 days post infection [8]. However clinical
* Correspondence:
1
Parco Tecnologico Padano - CERSA, Via Einstein, 26900 Lodi, Italy
5
Present address: Department of Clinical Studies, School of Veterinary
Medicine, University of Pennsylvania, Philadelphia, PA 19104 USA
Full list of author information is available at the end of the article
© 2012 Genini et al.; licensee BioMed Central Ltd. This is an Open Access article distributed under the terms of the Creative
Commons Attribution License ( which permits unrestricted use, distribution, and
reproduction in any medium, provided the original work is properly cited.
Genini et al. Proteome Science 2012, 10:48
/>manifestations vary with physiological status and age [9],
as the virus uses several immune evasion ways to com-
plicate the ability of the host to respond to the infection
process [4,10,11]. Weaning piglets, in particular, are
likely to be exposed to the infection. Although PRRSV
viraemia is often asymptomatic in these piglets, their
productive performance is significantly decreased. In-
deed, despite being sero-negative, persistently infected
piglets still harbor PRRSV and have been shown to be a
source of virus for susceptible animals [12].
SELDI-TOF MS analysis allows the comparison of
protein profiles obtained from a large number of diverse
biological samples by combining two principles, chroma-
tography by retention on chip surface on the basis of
defined properties (e.g. charge, surfa ce hydrophobicity,
or biospecific interaction with ligands) and mass spec-
trometry. It is thus distinct from common non-selective
techniques, such as two-dimensional polyacrilamide gel
electrophoresis (2D-PAGE) and matrix-assisted laser de-
sorption ionisation (MALDI) MS. SELDI-TOF MS has
been widely used for diagnostic biomarker discovery and
validation across studies in blood serum/plasma, particu-
larly in cancer research (reviewed by [13]), but also to
characterize and identify biomarkers associated with
viral and other infectious diseases [14-19]. The protein
signatures identified by SELDI-TOF MS analysis have
thus many potential applications in animal health, in-
cluding early diagnosis of diseases, prediction of disease
states, as well as monitoring of disease progression, re-
covery, and response to vaccination. Few reports have
been published for livestock applications [19-22].
Current needs in veterinary medicine and animal hus-
bandry include the identification of tools that allow the
early warning of diseases, especially during the incuba-
tion periods and bef ore the onset of clinical signs.
Therefore, the objective of this study was to identify by
SELDI-TOF MS a proteomic profile able to differentiate
PPRSV-positive from -negative weaning piglets raised in
commercial farms and without clinical symptoms of the
disease. We optimized the experimental conditions pre-
viously described [20] and validated 47 statistically sig-
nificant discriminatory biomarkers. Among these, a
combination of 14 biomarkers identified in F1 on CM10
at low focus mass permitted to correctly assign the pig-
lets to the PPRSV-positive or PRRSV-negative groups
with sensitivity and specificity of 77% and 73%,
respectively.
Results
To enable identification of medium-low abundant pro-
teins, only samples with a total content of hemoglobin
lower than 4.52 μg/mL were included in the study. Total
hemoglobin absorbance and the resulting hemoglobin
content were calculated for all the piglet sera in both
discovery (n = 50) and validation (n = 70) pha ses of the
study [Additional file 1: Table S1 and Additional file 2:
Table S2, respectively].
Fractioning of the sera resulted in six different pH frac-
tions; F1 = pH9, F2 = pH7, F3 = pH5, F4 = pH4, F5 = pH3,
and F6 = organic solvent. The fractions F1, F4, an d F6
were analyzed on the three surfaces CM10, IMAC30, and
H50 at both low and high focus masses. Fractions F2 and
F3 were excluded from further analyses because prelim-
inary data with 3 serum samples showed that they still
contained elevated quantities of abundant proteins (such
as albumin), as well as the quality of the spectra and the
number of signals detected were very low. Fraction F5
was excluded because no signals were detected.
The fractions F1, F4, and F6 on the surfaces CM10,
IMAC30, and H50 showed generally good signal inten-
sities and l ow coefficient o f variation (CV) values (< 30%)
in both the discovery and validation phases. Exceptions
were fraction F1 on IMAC30 (analyzed at high focus
mass) and H50 (both low and high focus masses), as well
as fraction F4 on H50 (low focus mass), which were
therefore excluded from further analyses.
Discovery phase
A total of 50 pig sera, 25 from PRRSV-positive and 25
from PRRSV-negative piglets were analyzed during the
discovery phase of the study [Additional file 1: Table S1].
We found a total of 785 protein peaks in the sera of
all samples (Table 1). The most represented pH fraction
was F6 (n = 381), followed by F4 (n = 223), and F1
(n = 181). On surface CM10 we identified 317 peaks, on
IMAC30 302 peaks, and on H50 166 peaks. Further-
more, a much higher number of peaks (n = 512) was
found on low mass range (1–20 kDa) compared to the
high (n = 273; 20–200 kDa).
Of the total 785 peaks, 200 were statistically significant
(p < 0.05) and permitted to discriminate between
PRRSV-positive and PRRSV-negative piglets. Discrimin-
atory peaks were found in F1 (n = 80), F4 (n = 49), and
F6 (n = 71) on the surfaces CM10 (n = 107), IMAC50
(n = 58), and H50 (n = 35), as well with low (n = 110) and
high (n = 90) focus masses (Table 1).
The highest sensitivity (80%) and specificity (76%)
were obtained with the 22 discriminatory peaks of F1 on
CM10 at low focus mass. Higher sensitivities were found
with the 18 peaks of F4 on CM10 at low focus mass
(87%), the 7 peaks of F6 on CM10 at low focus mass
(85%), and the 12 peaks of F6 on CM10 at high focus
mass (87%), however the specificities of these peaks were
lower (64%, 66%, and 66%, respectively).
Validation phase
The validation phase was performed on 35 new PRRSV-
positive and 35 new PRRSV-negative piglets using the
Genini et al. Proteome Science 2012, 10:48 Page 2 of 16
/>same experimental conditions applied in the discovery
phase [Additional file 2: Table S2]. Of the total 200
peaks that were significant in the discovery phase, 47
were confirmed in the validation phase (Table 2).
In particular, 28 peaks were confirmed on CM10, 19
on IMAC30, whereas none of the peaks could be vali-
dated on the surface H50. In the 3 fractions with differ-
ent pH tested, F1 contained 28 peaks, F4 3 peaks, and
F6 16 peaks. A higher number of peaks (n = 36) corre-
sponded to small peptides (acquired at low focus mass
1–20 kDa), compared to big peptides (n = 11) that were
acquired at high focus mass (20–200 kDa).
The vast majority (42) of the peaks were up-regulated
in PRRSV-positive piglets compared to the negative,
while only 5 peaks (F1 on CM10: 5,468 and 5,536 Da; F6
on CM10: 14,843 Da; and F6 on IMAC30: 27,806 and
27,606 Da) were down-regulated (Table 2). In line with
the result s of the discovery phase, the combination of
peaks with the highest sensitivities (77% and 64.5%) and
specificities (73% and 69.7%) were found on CM10 at
low focus mass with the 14 discriminatory peaks of F1
and the 6 discriminatory peaks of F6, respectively
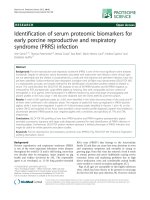
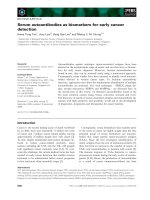
(Table 2). The correctly and incorrectly assigned piglets
using these peaks are graphically illustrated in the heat
map of Figure 1; part 1A shows the 14 peaks of F1 and
part 1B the 6 peaks identified in F6.
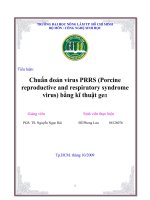
Principal component analysis (PCA) was performed on
the profiles of the 47 discriminatory peaks identified dur-
ing the discovery and confirmed during the validation
phase to identify and quantify independent sources of
variation observed in the data. PCA analysis showed that
58.2% (PCA1), 17.9% (PCA2), and 12.9% (PCA3) of the
total variability within the data was accounted for the X,
Y, and Z axes, respectively. These axes were used to plot
the data (Figure 2) and they provide an overview of the
variation between the individual samples and show how
samples grouped. Figure 2A showed three-dimensionally
that the PCA peak profiles of piglets positive to PRRSV
differed from piglets negative to PRRSV and revealed a
good separation among the profiles of the two different
groups, especially considering the high heterogeneity of
the samples included in the study, as reported in the MM
section and in [Additional file 1: Table S1 and Additional
file 2: Table S2]. Furthermore, with the exception of few
Table 1 Protein peaks identified by SELDI-TOF MS in the discovery phase of the study
Fraction Surface Acquisition focus mass Number of peaks detected Number of significant peaks (p < 0.05)
1 CM10 Low 67 22
1 CM10 High 56 38
1 IMAC30 Low 58 20
1 IMAC30 High None, bad signals and CV >30%
1 H50 Low None, bad signals and CV > 30%
1 H50 High None, bad signals and CV > 30%
Total F1 181 80
4 CM10 Low 51 18
4 CM10 High 37 10
4 IMAC30 Low 73 9
4 IMAC30 High 29 7
4 H50 Low None, bad signals and CV > 30%
4 H50 High 33 5
Total F4 223 49
6 CM10 Low 70 7
6 CM10 High 36 12
6 IMAC30 Low 108 16
6 IMAC30 High 34 6
6 H50 Low 85 18
6 H50 High 48 12
Total F6 381 71
TOTAL 785 200
The 785 total number of peaks detected and the 200 statistically significant (p < 0.05) discriminatory peaks associated with PRRS infection that were identified by
the Ciphergen Express software are reported with the fraction, the array surface, and the acquisition focus mass (low: 1–20 kDa; high: 20–200 kDa).
Genini et al. Proteome Science 2012, 10:48 Page 3 of 16
/>Table 2 Discriminatory protein peaks identified in the discovery phase and confirmed in the validation phase
Fraction Surface Focus mass ROC (regulation) M/Z (kDalton) p-value discovery p-value validation Sensitivity (+/+) Specificity (−/−)
1 CM10 Low 0.69 (up-regulated) 4.151 0.02 0.00
1 CM10 Low 0.82 (up-regulated) 4.458 0.00 0.00
1 CM10 Low 0.32 (down-regulated) 5.468 0.04 0.01
1 CM10 Low 0.28 (down-regulated) 5.536 0.01 0.01
1 CM10 Low 0.74 (up-regulated) 8.308 0.00 0.00
1 CM10 Low 0.71 (up-regulated) 8.516 0.02 0.00
1 CM10 Low 0.88 (up-regulated) 8.918 0.00 0.00
1 CM10 Low 0.87 (up-regulated) 9.124 0.00 0.00
1 CM10 Low 0.82 (up-regulated) 11.404 0.00 0.02
1 CM10 Low 0.76 (up-regulated) 11.613 0.00 0.02
1 CM10 Low 0.69 (up-regulated) 13.785 0.02 0.04
1 CM10 Low 0.80 (up-regulated) 17.218 0.00 0.00
1 CM10 Low 0.80 (up-regulated) 17.838 0.00 0.00
1 CM10 Low 0.74 (up-regulated) 19.761 0.00 0.02
Total number of significant peaks Fraction 1, CM10, low focus mass: 14 77% 73%
1 CM10 High 0.82 (up-regulated) 20.322 0.00 0.00
1 CM10 High 0.77 (up-regulated) 23.496 0.00 0.00
1 CM10 High 0.76 (up-regulated) 54.107 0.00 0.04
1 CM10 High 0.76 (up-regulated) 101.410 0.00 0.01
1 CM10 High 0.76 (up-regulated) 135.096 0.00 0.01
1 CM10 High 0.87 (up-regulated) 147.351 0.00 0.00
Total number of significant peaks Fraction 1, CM10, high focus mass: 6 58.8% 51.5%
1 IMAC30 Low 0.84 (up-regulated) 4.462 0.00 0.006
1 IMAC30 Low 0.80 (up-regulated) 8.843 0.00 0.011
1 IMAC30 Low 0.84 (up-regulated) 8.914 0.00 0.016
1 IMAC30 Low 0.77 (up-regulated) 8.977 0.001 0.008
1 IMAC30 Low 0.82 (up-regulated) 9.119 0.00 0.009
1 IMAC30 Low 0.79 (up-regulated) 9.136 0.00 0.006
1 IMAC30 Low 0.64 (up-regulated) 11.090 0.056 0.04
1 IMAC30 Low 0.79 (up-regulated) 17.860 0.00 0.013
Total number of significant peaks Fraction 1, IMAC30, low focus mass: 8 60.6% 51.5%
4 CM10 High 0.70 (up-regulated) 23.162 0.02 0.00
4 CM10 High 0.67 (up-regulated) 89.049 0.02 0.017
Total number of significant peaks Fraction 4, CM10, high focus mass: 2
4 IMAC30 High 0.67 (up-regulated) 144.495 0.034 0.00
Total number of significant peaks Fraction 4, IMAC30, high focus mass: 1
6 CM10 Low 0.76 (up-regulated) 4.161 0.008 0.00
6 CM10 Low 0.70 (up-regulated) 8.328 0.025 0.013
6 CM10 Low 0.68 (up-regulated) 8.535 0.041 0.008
6 CM10 Low 0.70 (up-regulated) 8.552 0.029 0.010
6 CM10 Low 0.70 (up-regulated) 8.642 0.036 0.013
6 CM10 Low 0.30 (down-regulated) 14.843 0.010 0.015
Total number of significant peaks Fraction 6, CM10, low focus mass: 6 64.5% 69.7%
Genini et al. Proteome Science 2012, 10:48 Page 4 of 16
/>outliers, PCA1 combined with PCA2 also separated well
the two piglet populations (Figure 2B).
Comparison with relevant protein peaks and immunity
genes related to PRRSV infection in other studies
To provide an overview of the current literature and to
try to correlate the discriminatory peaks identified in
this study with relevant proteins, we summarized in
Table 3 the molecular weights of several peaks that have
been shown to be related to PRRSV infection.
First of all, we summarized the available information
on the PRRS viral proteins. The PRRSV genome is ca.
15 kb in size and consists of the 5' untranslated region
(UTR), at least nine open reading frames (ORFs), and
Table 2 Discriminatory protein peaks identified in the discovery phase and confirmed in the validation phase
(Continued)
6 IMAC30 Low 0.74 (up-regulated) 8.928 0.013 0.029
6 IMAC30 Low 0.70 (up-regulated) 10.041 0.025 0.025
6 IMAC30 Low 0.76 (up-regulated) 11.412 0.005 0.00
6 IMAC30 Low 0.74 (up-regulated) 12.237 0.009 0.002
6 IMAC30 Low 0.74 (up-regulated) 12.522 0.009 0.004
6 IMAC30 Low 0.76 (up-regulated) 12.930 0.002 0.003
6 IMAC30 Low 0.78 (up-regulated) 13.143 0.002 0.004
6 IMAC30 Low 0.68 (up-regulated) 17.171 0.045 0.018
Total number of significant peaks Fraction 6, IMAC30, low focus mass: 8 54.5% 53%
6 IMAC30 High 0.28 (down-regulated) 27.806 0.023 0.018
6 IMAC30 High 0.30 (down-regulated) 27.606 0.030 0.017
Total number of significant peaks Fraction 6, IMAC30, high focus mass: 2
Proteomic features of the 47 discriminatory protein peaks identified by SELDI-TOF MS in the discovery phase and confirmed in the validation phase. The peaks are
divided by fraction, array surface, acquisition focus mass (low: 1–20 kDa; high: 20–200 kDa), ROC (Receiver Operating Characteristic = Area Under Curve) value with
regulation status in PRRSV-positive compared to PRRSV-negative piglets, molecular weight, and p-values for both discovery and validation phases. The sensitivity
and specificity of the total number of discriminatory peaks identified per fraction, array surface and acquisition focus mass is also reported. The sensitivity and
specificity were calculated only if the number of peaks was greater than 2.
Figure 1 Heat map showing cluster analysis of the PRRSV-positive and PRRSV-negative piglets tested with the 2 combinations of
discriminatory peaks that showed the highest sensitivity and specificity values. The x-axis of the heat maps shows the piglets analyzed in
the validation phase (blue: PRRSV-positive; red: PRRSV-negative), while the y-axis displays the molecular weights in Dalton of the 14 significant
discriminatory peaks identified in F1 (A) and the 6 peaks in F6 (B) both on the surface CM10 at low focus mass. The maps contain peak fold
changes Z-score normalized over all piglets. They are color coded, with red corresponding to up-regulation and green to down-regulation in
PRRSV-positive piglets. As expected, piglets from the two different groups clustered together, although some incorrectly assigned piglets could
be observed (as confirmed by the calculated sensitivities and specificities values, see text).
Genini et al. Proteome Science 2012, 10:48 Page 5 of 16
/>the 3' UTR followed by a polyadenylation tail. The
expected and experimentally identified MWs for each
viral protein from different studies are reported in
Table 3, along with the MW of the closest discrimin-
atory peak identified in the current study.
Interestingly, the MW of the viral proteins ORF2 b,
ORF4, and ORF7 were very similar (difference of MW
≤0.3 kDa) to up-regulated discriminatory peaks identi-
fied here (Table 3).
As next, we compared proteins related to PRRSV in-
fection that were identified in additional studies
(Table 3); interestingly, all the 9 peaks found by [28],
and in particular the only up-regulated in PRRSV
infected (corresponding to the Alpha 1 S (a1S)-subunit
of porcine Haptoglobin), showed minimal MW differ-
ences (≤0.3 kDa) with up-regulated peaks identified in
this study (Table 3).
Additional discriminatory peaks found in the
current study were very similar (MW differences
≤0. 3 kDa) to those identified in other PRRS-related
pro teomic st udies (Table 3). They corresponded to the
following proteins: Glyceraldehyde-3-phosp hate de-
hydrogenase, Proteasome activator hPA28 subunit
beta, S100 calcium binding protein A1 0, Galectin 1,
and Gastric-a ssociated differentially expressed protein
YA61P [26]; Heat shock 27 kDa protein 1, Superoxide
dismutase 2, Myoglobin, and Vacuolar protein sorting
29 [29]; Heat shock protein 27 kDa and Nucleoside
diphosphate kinase A [30]; Heat shock 27 kDa protein
1, Galectin 1, and Ubiquitin [31].
Discussion
In the present work, we show that proteomic finger-
print profiling is useful in res earches on PRRS
immuno-pathogene sis and might also be a robust, large
scale diagnostic tool for the assessment of the propor-
tion of PRRSV-positive weaning piglets without clinical
symptoms in a herd. Indeed, we confirmed that the
high-throughput capacity of the SELDI-TOF MS tech-
nology allows the screening for disease biomarkers of
hundred of samples in a relative short-time period and
with minimal sample preparation (as previously also
reported by [32]).
Our results indicate that from the 200 significant
peaks found in the discovery pha se, a total of 47 could
be confirmed in the validation phase. These values are
comparable with another study where similar experi-
mental conditions were applied to ovine sera [19].
Our findings also show that the combination of 14
discriminatory peaks in F1 on CM10 at low focus mass
provided the highest sensitivity of 77% and specificity of
73% to correctly assign the piglets to the PPRSV-
positive or PRRSV-negative groups. These percentages
are in line with recent studies in humans using the
Figure 2 Principal component analysis (PCA) showing the effects of the 47 significant discriminatory peaks on piglets positive or
negative to PRRSV infection. The figure shows a projection of the measured peak intensities profiles onto the plane spanned by the three
principal components (PCAs) that are the axes along which the data vary the most, for the 35 PRRSV-positive (blue) and the 35 PRRSV-negative
(red) piglets of the validation study. PCA1, PCA2, and PCA3 accounted for 58.2%, 17.9%, and 12.9% of the variability in the data, respectively. PCA
analysis illustrates a 3-dimentional plot comparison of PCA1, PCA2 and PCA3 in the three axes (A), as well as 2-dimentional score plot
comparisons between PCA1 and PCA2 (B).
Genini et al. Proteome Science 2012, 10:48 Page 6 of 16
/>Table 3 Comparison between relevant PPRSV-related and pig proteins identified in other studies and the
discriminatory peaks found in this study
Method of identification
of the peak [reference]
Protein Reported
MW (kDa)
Regulation
in other studies
MW (kDa) of the peak identified
in this study with a difference
≤0.3 kDa compared to the
other reports (regulation
PRRSV-positive vs. -negative)
PRRSV proteins
- Calculated molecular
mass from amino
acid sequence [23,24]
ORF1a – non structural
polyprotein
260 - 270
- Calculated molecular
mass from amino acid
sequence [23,24]
ORF1ab – non structural
polyprotein
420 - 430
- Estimated size from
amino acid sequence [25]
ORF2a - glycoprotein 2a
(GP2a)
28.4
- 2-DE PAGE and
MALDI-TOF [26]
29.4
- SDS page and western of
MARC-145 cells infected with
PRRSV [27]
ORF2b - non-glycosylated
protein 2b
10 10.041 (up-regulated)
- Estimated size from
amino acid sequence [25]
ORF3 - glycoprotein 3
(GP3)
30.6
- 2-DE PAGE and
MALDI-TOF [26]
29
- Estimated size from
amino acid sequence [25]
ORF4 - glycoprotein 4
(GP4)
20 19.761 (up-regulated)
- 2-DE PAGE and
MALDI-TOF [26]
19.5 19.761 (up-regulated)
- Estimated size from
amino acid sequence [25]
ORF5 - glycoprotein 5
(GP5, E)
22.4
- 2-DE PAGE and
MALDI-TOF [26]
22.4
- Estimated size from
amino acid sequence [25]
ORF6 - matrix protein (M) 18.9
- 2-DE PAGE and
MALDI-TOF [26]
19
- Estimated size from
amino acid sequence [
25]
ORF7 - nucleocapsid
protein (N)
13.8 13.785 (up-regulated)
- 2-DE PAGE and
MALDI-TOF [26]
13.5 13.785 (up-regulated)
Pig protein peaks related to
PRRSV infection
- MALDI-TOF (sera of pigs
after few days of infection
with PRRSV vs. normal) [28]
Alpha 1 S (a1S)-subunit
of porcine Haptoglobin (Hp)
9.244 Up-regulated in PRRSV
infected sera (after 1–7 days)
9.136 (up-regulated)
Unknown peak 4.165 No difference 4.161 (up-regulated)
Unknown peak 4.460 No difference 4.458; 4.462 (both up-regulated)
Unknown peak 5.560 No difference 5.536 (down-regulated)
Unknown peak 8.330 No difference 8.328 (up-regulated)
Unknown peak 8.825 No difference 8.843 (up-regulated)
Unknown peak 12.250/12.55 No difference 12.237/12.522 (both up-regulated)
Unknown peak 14.010 No difference 13.785 (up-regulated)
- 2-DE PAGE and MALDI-TOF
of cellular proteins incorporated
in PRRSV virions [26]
Keratin 10 58.8
Genini et al. Proteome Science 2012, 10:48 Page 7 of 16
/>Table 3 Comparison between relevant PPRSV-related and pig proteins identified in other studies and the
discriminatory peaks found in this study (Continued)
Coronin, actin
binding protein, 1B
55.7
Keratin 9 62
Tubulin, beta polypeptide 47.7
Tubulin, alpha, ubiquitous 50.1
Beta-actin 41.7
Actin, gamma 1
propeptide
41.8
Keratin 1 66
Tropomyosin 1
alpha chain isoform 4
32.9
Cofilin 1 (non-muscle) 18.5
Heat shock 70 kDa
protein 8 isoform 1
70.8
Heat shock 60 kDa
protein 1
61
Ribosomal protein P0 34.2
Heat shock protein 27 22.3
Transketolase 67.8
Pyruvate kinase 57.8
Phosphoglycerate
dehydrogenase
56.6
Aldehyde
dehydrogenase 1A1
54.8
UDP-glucose
dehydrogenase
55
Enolase 1 47.1
Phosphoglycerate kinase
1A isoform 2
44.6
Glyceraldehyde-3-
phosphate
dehydrogenase
23.8 23.496 (up-regulated)
Guanine nucleotide
binding protein
(G protein), beta
polypeptide 1
37.3
L-lactate
dehydrogenase B
36.6
Chain A, Fidarestat
Bound To Human
Aldose Reductase
35.7
PREDICTED:
lactate dehydrogenase
36.6
Peroxiredoxin 1 22.1
Proteasome activator
hPA28 subunit beta
27.3 27.606 (down-regulated)
Triosephosphate
isomerase 1
26.6
Chaperonin containing
TCP1, subunit 3 (gamma)
60.4
Chaperonin containing
TCP1, subunit 6A (zeta 1)
58
Genini et al. Proteome Science 2012, 10:48 Page 8 of 16
/>Table 3 Comparison between relevant PPRSV-related and pig proteins identified in other studies and the
discriminatory peaks found in this study (Continued)
Chaperonin containing
TCP1, subunit 5
(epsilon) protein
59.6
Chaperonin containing
TCP1, subunit 2
57.4
PRP19/PSO4
pre-mRNA processing
factor 19 homolog
55.1
Retinoblastoma
binding protein 4
isoform a
47.6
Eukaryotic
translation initiation
factor 4A isoform 1
46.1
Proliferating cell
nuclear antigen
28.7
Alpha2-HS glycoprotein 35.6
Annexin A2 38.5
Annexin A5 35.9
Annexin A4 36.1
S100 calcium
binding protein A10
11.2 11.090 (up-regulated)
Galectin-1 14.7 14.843 (down-regulated)
T-complex protein 1
isoform a
60.3
Gastric-associated
differentially
expressed protein YA61P
14.9 14.843 (down-regulated)
- 2-DE PAGE and MALDI-TOF
of PAM infected with
PRRSV vs. normal [29]
Lymphocyte
cytosolic protein 1
70 Up-regulated in
infected PAM
65 kDa macrophage
protein
70.2 Up-regulated
L plastin isoform 2 41.4 Up-regulated
Enolase 1 47.1 Up-regulated
BUB3 budding
uninhibited by
benzimidazoles 3
isoform a
37.1 Up-regulated
Heat shock 27 kDa
protein 1
22.9 Up-regulated 23.162 (up-regulated)
Proteasome beta 2
subunit
22.8 Up-regulated
Transgelin 2 21.1 Up-regulated
NADP-dependent
isocitrate dehydrogenase
46.7 Up-regulated
Superoxide dismutase 2 11.7 Up-regulated 11.613 (up-regulated)
Lamin C 65.1 Up-regulated
Aconitase 98.1 Up-regulated
Long chain
acyl-CoA dehydrogenase
47.9 Up-regulated
Proteasome subunit
alpha type 1
29.5 Up-regulated
Genini et al. Proteome Science 2012, 10:48 Page 9 of 16
/>Table 3 Comparison between relevant PPRSV-related and pig proteins identified in other studies and the
discriminatory peaks found in this study (Continued)
70 kDa heat shock
cognate protein
atpase domain
41.9 Up-regulated
Similar to
dihydrolipoamide
S-succinyltransferase
(E2 component of
2-oxo-glutarate complex)
48.9 Up-regulated
Similar to
cleavage stimulation
factor, 3 pre-RNA,
subunit 1 isoform 3
47.3 Up-regulated
Beta Actin 39.2 Down-regulated
in infected PAM
Beta Actin 32.1 Down-regulated
Myoglobin 16.9 Down-regulated 17.171 (up-regulated)
Vacuolar protein
sorting 29
20.5 Down-regulated 20.322 (up-regulated)
Transketolase 67.9 Down-regulated
Eukaryotic
translation initiation
factor 3, subunit 5
37 Down-regulated
Cathepsin D protein 42.7 Down-regulated
Similar to
lymphocyte-specific
protein 1
40.9 Down-regulated
- 2-DE PAGE and
MALDI-TOF of
PAM constitutively
expressing the PRRSVN
protein vs. normal [30]
Proteasome subunit
alpha type 6
28.5 Up-regulated in PAM
expressing PRRSVN
Heat shock protein 27
kDa
23 Up-regulated 23.162 (up-regulated)
Annexin 1 38.5 Up-regulated
Septin 2 42.9 Up-regulated
Spermidine synthase 34.4 Down-regulated in PAM
expressing PRRSVN
Major vault protein 19.3 Down-regulated
Ferritin L subunit 18.3 Down-regulated
Nucleoside
diphosphate kinase A
17.3 Down-regulated 17.218 (up-regulated)
Chaperonin containing
TCP-1 beta subunit
57.8 Down-regulated
Dihydropyrimidinase
related protein 2
62.7 Down-regulated
Translation elongation
factor 2
47.2 Down-regulated
- 2-DE PAGE and
MALDI-TOF of PAM and
Marc-145 cells infected
with PRRSV [31]
Cofilin 1 25.773 Up-regulated in Marc-145
Actin-related protein 16.278 Up-regulated in PAM
Vimentin 30.826 Up-regulated in PAM
Alpha cardiac actin 16.758 Up-regulated in PAM
Genini et al. Proteome Science 2012, 10:48 Page 10 of 16
/>same technology [33,34]. Also the PCA results showed
a good separation of the piglets in the two groups
under examination. This was reached even though the
tested piglets had large variability and heterogeneity, as
they were collected from several farms located in differ-
ent regions, and underwent high environmental pres-
sures, typical of the field conditions. This is mainly due
to the careful choice of the serum samples, where we
tried to minimize the environmental differences by
using same experimental parameters (e.g. sample colle ction
procedures, storage, handl ing) and by including a similar
number of pigs from the same breed (Large White) and
with very similar sex ratios and ages (at weaning).
In a preliminary work [20] we had successfully trans-
ferred the experimental conditions used in profiling
experiments of human sera to pig sera. However, in that
work, none of the potential biomarkers identified in the
discovery phase could be validated in the subsequent val-
idation phase, because of high samples heterogeneity and
high content of serum (e.g. albumin) and contaminant
Table 3 Comparison between relevant PPRSV-related and pig proteins identified in other studies and the
discriminatory peaks found in this study (Continued)
Cofilin 1 18.507 Up-regulated in PAM
Stress 70 protein 55.119 Up-regulated in Marc-145
Peroxiredoxin 2 19.418 Up-regulated in Marc-145
Heat shock 27 kDa
protein 1
22.927 Up-regulated in Marc-145 23.162 (up-regulated)
Peroxiredoxin 6 24.995 Up-regulated in Marc-145
Heat shock protein
beta 1 (HSPB1)
22.768 Up-regulated in PAM
Ubiquitin 8.559 Up-regulated in Marc-145 8.552 (up-regulated)
Cystatin B (CSTB) 25.288 Up-regulated in PAM
FYVE finger containing
phosphoinositide kinase
232.904 Up-regulated in PAM
Pyruvate kinase
isozymes M1/M2 (PKM2)
57.744 Up-regulated in PAM
UPF 0681 protein
KIAA1033
136.330 Up-regulated in Marc-145
Tropomyosin alpha 4
chain (TPM4)
28.504 Up-regulated in PAM
UPF 0568 protein 28.191 Up-regulated in PAM
LIM and SH3 protein 1 29.975 Down-regulated in Marc-145
Plectin 1 532.578 Down-regulated in Marc-145
Glial fibrillary acidic
protein (GFAP)
46.497 Down-regulated in Marc-145
Plectin 1 516.572 Down-regulated in PAM
Galectin 1 14.736 Down-regulated in Marc-145 14.843 (down-regulated)
Galectin 1 14.590 Down-regulated in PAM
Superoxide dismutase 1
(SOD1)
15.236 Down-regulated in PAM
Prohibitin 29.757 Down-regulated in Marc-145
Epidermal fatty
acid-binding protein 5
(FABP5)
15.199 Down-regulated in PAM
A kinase anchoring
protein AKAP350
416.855 Down-regulated in PAM
Pyridoxine 5 phosphate
oxidase variant
29.896 Down-regulated in PAM
List of relevant PPRSV and pig proteins that have been shown in other studies and might correspond to the significantly expressed peaks found here with
SELDI-TOF MS. The method used in other studies to identify the peak with the corresponding reference, the protein names, as well as their MW and regulation
are reported. The last column indicates the MWs (with in parenthesis the regulation in PRRSV-positive compared to PRRSV-negative piglets) of discriminatory
peaks identified in this study that showed a difference ≤0.3 kDa compared to the other studies.
Genini et al. Proteome Science 2012, 10:48 Page 11 of 16
/>proteins (e.g. hemoglobin), having a negative effects on
the detection of significant biomarkers, particularly those
corresponding to the medium-low abundant proteins. It
has been reported that low abundant proteins constitute
about 1% of the entire human serum proteome, with the
remaining 99% being comprised of only 22 proteins [35].
As it was therefore necessary to reduce the level of abun-
dant proteins, in this follow up study, particular relevance
was given to the content of the contaminant protein
hemoglobin. Only non-hemolytic samples with similar,
low contents of hemoglobin were included in the study.
Additionally, to further increase the likelihood to iden-
tify statistically significant discriminatory biomarkers, we
introduced a fractioning step based on anion-exchange
chromatography. In a similar study performed with
MALDI-TOF [28], where serum samples were analyzed
in the first weeks (2–16) of PRRSV infection (also verified
by PCR), a significantly lower number of peaks were iden-
tified compared to the present work. While protein peaks
with M/Z values of 4.165, 4.460, 5.560, 8.330, 8 .825,
12.250/12.550, and 14.010 kDa were found in 94 serum
samples from 59 pigs, only one peak (9.244 kDa), corre-
sponding to the alpha 1 S (a1S)-subunit of porcine Hapto-
globin (Hp), was differentially up-regulated in PRRSV
infected pigs. Interestingly, all these peaks were very simi-
lar (MW difference ≤0.3 kDa) with discriminatory peaks
identified here (details in Table 3). Furthermore, two peaks
identified in this study (23.162 and 14.843 kDa) were simi-
lar to peaks identified elsewhere (corresponding to Heat
shock 27 kDa protein 1 [29-31] and Galectin 1 [26,31], re-
spectively). In accordance with [31], the identified peak
corresponding to Heat shock 27 kDa protein 1 was up-
regulated, while the peak corresponding to Galectin 1 was
down-regulated. Thus, these proteins s eem to be very inter-
esting and s uitable candidates f or futur e investi gations.
The preponderance of the significant biomarkers had a
molecular mass lower than 20 kDa, confirming that
small peptides are a rich source of relevant biomarkers
in SELDI-TOF MS analyses as previously reported in
human [36] and ovine [19] sera. This may also partly be
caused by the fact that the low molecular weight region
(LMW) of the serum proteome, called peptidome, is an
assortment of small intact proteins and proteolytic frag-
ments of larger proteins, including several classes of
physiologically important proteins like peptide hormones
and components of both the innate and adaptive im-
mune systems (i.e. cytokines and chemokines) [35,37].
This is particularly i nteresting as the pat ho-physiological
state of t he body ’s tissue is p redominantly ref lected in the
LMW and l ow a bundance region of the serum proteome,
and specific protein fragments of the serum peptidome have
been shown t o c ontain a r ich s ource of d isease-specific diag-
nostic information a nd they ha ve been correlated with dis-
ease stages in several s tudies (reviewed b y [37]).
In agreement with other studies [29,31], we found
that the majority of the discriminatory biomarkers were
up-regulated in PRRSV-positive piglets. This seems to
suggest that the corresponding proteins might be of
viral origin or related to the innate or adaptive immune
responses (e.g. cytokines, chemokines, acute phase
proteins, toll like receptors). In fact, several peaks
showed high similarities (MW differences ≤0.3 kDa)
with previous works, in particular regarding viral pro-
teins (Table 3). The assignment of the discriminatory
peak to a specific protein will require additional work,
because the SELDI-TOF technology can only detect
masses/peaks of proteins that are differentially e xpressed
between samples but can not directly identify the pro-
teins. T his represents one of the major drawbacks of
this tec hnology compared to other m ethods. However,
an advantage of the SELDI- TOF MS in this regard is
that the r esults of this technique m ight lead to the
identification of new proteins that were previously not
correlated to the disease, and this might hopefully lead
to the ident ific atio n of new biomarker s represent ing the
field situation. The interpretation of these results and
the continuation of this p roject will benefit from the
very imminent termination and publication of the se-
quence of the swine genome [ 38], which will definitely
contribute t o a more precise annot ation and a better
identification of g enes and p roteins a nd thus will greatly
facilitate genome wide mapping as sociation studies.
Conclusions
Although a combination of peaks identifi ed wit h differ-
ent experimental conditions (e.g. using different frac-
tions and different surfaces) might have provided
higher discriminatory power, here we developed a
PRR SV diagnostic test based on peaks identified with
the same experimental conditions (e.g. fraction, sur-
face, and focus mass), which can be reproduced at
high-throughput at reasonable costs. These result s
provide a set of proteomic biomarkers and relate d,
optimized experimental conditions for high-th roughput
profiling of pig populations by SELDI-TOF MS for
whole genome association studi es, where identification
of proteins underlying the phenotype can be made a
posterior i. SELDI-TOF MS might therefore represent a
complementary test or a possible alternative to clas-
sical (PCR) and more recent diagnostic methods (e.g.
antibody detection in saliva) for profiling large flocks
of pigs at reasonable costs, using blood samples that
are routinely collected for general veterinary inspec-
tions. As well, these SELDI-TOF MS based tests could
complement and provide a broader reference for emer-
ging diagnostic methods and have potential applic a-
tions for the detection of relevant proteins having
highly heritable traits (e.g. acute phase proteins).
Genini et al. Proteome Science 2012, 10:48 Page 12 of 16
/>Methods
Piglets
A total of 120 serum samples of Large White piglets
were selected from a well defined and characterized re-
pository database, presently containing more than
20,000 swine samples from 18 different farms of the
Lombardy region, Italy. Selection of the piglets aimed to
minimize environmental factors and experimental condi-
tions that might influence the results [39]. Hence, all
piglets were from the same breed (Large White), had
similar ages (weaning: 45–50 days), and their sera
showed a low and comparable amount of hemoglobin
(calculated as shown below).
In the discovery phase of the study, a total of 50 pig
sera, 25 from PRRSV-positive and 25 from PRRSV-
negative piglets, as determined by PCR (see below), were
analyzed [Additional file 1: Table S1]. The validation
phase was performed with the same experimental condi-
tions as the discovery phase. A total of 35 new PRRSV-
positive and 35 new PRR SV-negative piglets were
examined [Additional file 2: Table S2]. The actual dur-
ation of infection for each individual PRRSV -positive piglet
was unknown, as sera were collected and analyzed once for
each piglet (at w eaning: 45–50 days of age). None of the pig-
lets w as t r ea t ed , as they did not s how any symptom of the
disease.
To ensure large variability and heterogeneity of the
samples and minimize environmental differences, we
included in the PRRSV-positive and -negative groups
similar numbers of piglets with the same sex that origi-
nated from several farms located in different regions. In
fact, PRRSV-positive piglets originated from 6 farms of
the Lodi region (n = 8) and 7 farms of the Mantua region
(n = 52), while PRRSV-negative piglets were collected in
5 farms around Lodi (n = 19) and 9 farms around Man-
tua (n = 41). Sex ratios males/females (44/76) were very
similar in PRRSV-positive (21 vs. 39) and -negative (23
vs. 37) piglets, respectively.
Veterinary inspections of the overall clinical status of
the piglets at the day of serum collection did not evi-
dence any clinical symptoms of PRRS, including respira-
tory distress or sneezing.
Serum samples
All the serum samples were collected, stored, and
handled in the same way. They were obtained for each
piglet by storing two mL of whole blood without antic-
oagulants at room temperature (RT) for 4 h followed by
centrifugation at 3,500 rpm for 4 min. As suggested in a
previous work [20], an abundant quantity of hemoglobin
in the serum can hide early diagnostic biomarkers of
PRRSV by competing with the other serum components
for the binding site of the chromatographic surfaces. To
avoid the consequent signal suppression of the medium-
low abundant proteins, only non-hemolytic samples were
included in the present study.
A total of 200 clear, transparent sera without red pig-
mentation (low hemog lobin content) were first selected
by visual screening from the total sera available in the
database. Hemoglobin content of each serum sample
was then determined according to [40] with minor mod-
ifications. A calibration curve was generated using five
standard solutions (concentrations: 1.8, 3.6, 5.4, 7.2, and
9 μg/ml) of porcine hemoglobin diluted in 400 μL com-
mercially available porcine serum (Sigma Aldrich, St
Louis, MO, USA). Triplicate samples were incubated for
5Ámin at RT, then absorbance (E) was measured at 380,
415, and 440 nm. Absorbance at 380 and 440 nm was used
to discern background absorbance flanking th e absorbance
peak (415 Ánm) of oxygenated hemoglobin. Absorbance due
to hemoglobin was calculated as: E415–[(E380 + E440)/2].
Hemoglobin absorbance values of the samples were con-
verted to μg/mL of hemoglobin by means of the calibra-
tion curve. Of the 200 initial samples, a total of 120
samples having an absorbance ≤ 0.085 (corresponding to
a hemoglobin content below 4.52 μg/mL) were included
in the study; 50 in the discovery and 70 in the validation
phases, respectively.
Viral RN A extraction from the sera wa s performed fol-
lowing standard Roche procedures (High Pure Viral
RNA Kit, Roche Diagnostics GmbH, Germany). Presence
or absence of PRRSV was determined by multiplex PCR
of conserved regions of viral ORF7 using primers and
conditions previously described [41,42]. The test also
enabled to discriminate European and American geno-
types and could detect all the different viral strains
present in the Lombardy region at the time of sample
collection .
Serum fractionation
All the detailed steps of the SELDI-TOF MS process per-
formed here are schematically represented [see Add-
itional file 3: Figure S1]. The protocol follows the
manufacturer’s instructions with minor modifications
(Bio-Rad Laboratories, ProteinChip
W
Serum Fraction-
ation Kit manual).
Briefly, serum samples were pre-fractionated with U9
buffer (9 M urea, 2% 3-[(3-Cholamidopropyl)dimethy-
lammonio]-1-propanesulfonate (CHAPS), 50 mM Tris–
HCl, pH = 9) to favor dissociation of protein complexes
[Additional file 3: Figure S1A].
Sera were fractionated using a ProteinChip Q strong
anion-exchange resin filtration plate (Bio-Rad Laborator-
ies, Hercules, CA). The filtration plate was re-hydrated
and equilibrated with rehydration buffer (50 mM Tris–
HCl, pH = 9) and the resin washed with rehydration buf-
fer and U1 solution (1 M urea, 0.2% CHAPS, 50 mM
Tris–HCl, pH = 9) [Additional file 3: Figure S1B]. Serum
Genini et al. Proteome Science 2012, 10:48 Page 13 of 16
/>samples were then mixed with U1 solution and added to
the equilibrated filtration plate. Successive elutions with
different buffers with decreasing pH and a final organic
solvent (= different fractions) were collected by centrifu-
gation. The buffers used included pH = 9 (50 mM Tris–
HCl, 0.1% n-octyl β-D-glucopyranoside (OGP)), pH = 7
(50 mM 4-(2-Hydroxyethyl)piperazine-1-ethanesulfonic
acid (HEPES), 0.1% OGP), pH = 5 (100 mM Na acetate,
0.1% OGP), pH = 4 (100 mM Na acetate, 0.1% OGP),
pH = 3 (100 mM Na citrate, 0.1% OGP), and organic
solvent (33.3% isopropanol, 16.7% acetonitrile, 0.1% tri-
fluoroacetic acid) [Additional file 3: Figure S1C].
ProteinChip arrays
The six pH fractions obtained (F1 = pH9, F2 = pH7,
F3 = pH5, F4 = pH4, F5 = pH3, and F6 = organic solvent)
were profiled on weak cation-exchange (CM10), immo-
bilized metal affinity capture-copper (IMAC30-CU), and
reverse-phase (H50) ProteinChip
W
arrays. The arrays
were initially placed in a Bioprocessor (C50-30011, Bio-Rad
Laboratories) and then treated according to their surface
[Additional file 3: Figure S1D]. Each sample fraction
was then bound/spotted randomly to the different Pro-
teinChip
W
arrays using array-spe cific binding buffers
[Additional f ile 3: Figure S1E]. A 50% saturated sinapinic
acid (SPA) matrix solution was finally added to each spot
on the ProteinChip array prior to the final analysis [Add-
itional file 3: Figure S1F].
SELDI-TOF MS analysis
ProteinChip arrays were read using a Ciphergen
Protein-Chip Reader PCS4000 model and data were
analyzed with Ciphergen Express Software (Ciphergen
Biosystems).
Profiles were collected in the range 1–200 kDa at the
two different ion focus mass 10 kDa (“low focus mass”)
and 50 kDa (“high focus mass”). The instrument was
calibrated for dataset collection using all-in-one peptide
standard (Bio-Rad Laboratories) in the 1–20 kDa range
for 10 kDa low ion focus mass and all-in-one protein
standard in the 20–200 kDa range for 50 kDa high ion
focus mass [Additional file 3: Figure S1G].
Ciphergen Express software analysis
Spectra were normalized by to tal ion current, starting
and ending at the M/Z of the collection ranges (1–20 or
20–200 kDa) after baseline subtraction and noise calcu-
lation. Outlier spectra were removed. The spectra were
aligned to a reference spectrum with the normalization
factor nearest 1.0. The spectra were aligned only if the
percentage coefficient of variation was reduced after the
alignment. Peaks from the different spectra were aligned
using the cluster wizard function of the Ciphergen Ex-
press 3.0.6 software. The peak detection was automated
within the M/Z range of analysis. Peaks were detected
on the firs t pass when the signal-to-noise (S/N) ratio
was 7 and the peak was 5 times the valley depth. Peaks
below threshold were deleted and all first-pass peaks
were preserved. Clusters were creat ed within 0.15% of
M/Z for each peak detected in the first pass. The clus-
ters were completed by adding peaks with S/N ratio of 2
and two times the valley depth. P-values and ROC/AUC
(Receiver Operating Characteristic/ Area Under Curve)
values were calculated by using the P-value wizard.
A 2-tailed t-test was used for statistical analysis of dif-
ferences in peak intensity between groups. P-values
below 0.05 were considered statistically significant. Prin-
cipal component analysis (PCA) and agglomerative hier-
archical clustering algorithm were applied to investigate
the pattern among the different statistically significant
peaks.
PCA is a multivariate data analysis that transforms
without a loss of essential information a number of cor-
related variables into a smaller number of uncorrelated
variables called principal components (PCs), which can
explain sufficiently the data structure. PCA transform-
ation allows studying many variables simultaneously,
showing how similar samples are correlated and grouped
together. The data structure is visualized directly in a
graphical way by projection of objects onto the space
defined by the selected P CAs (for details see [43]).
Finally, to evaluate the influence of external variables
(e.g. sample processing and acquisition) on the system
under study and to calculate the dispersion of the
acquired data, the coefficient of variation (CV), which is
the normalized measure of dispersion of a probability
distribution and shows the% dispersion of the data in
rapport to the media (intensity variation), was also cal-
culated. Six serum samples commercially available were
prepared and analyzed in parallel with the pig samples
of both, discovery and validation phases. The CV was
calculated for all fractions and surfaces by choosing 6
peaks evenly distributed along the entire range.
Additional files
Additional file 1: Table S1. Pigs tested with SELDI-TOF MS during the
discovery phase of the study. List of the 25 positive and 25 negative pigs
to PRRS (PCR-tested) analyzed with SELDI-TOF MS during the discovery
phase of the study. The pig ID is reported with the total absorbance and
the total amount of hemoglobin present in the sample, the status
regarding the PRRS virus, as well as the sex and the number and location
of the farm (MA = Mantua region, LO = Lodi region).
Additional file 2: Table S2. Pigs tested with SELDI-TOF MS during the
validation phase of the study. List of the 35 positive and 35 negative pigs
to PRRS (PCR-tested) analyzed with SELDI-TOF MS during the validation
phase of the study. The pig ID is reported with the total absorbance and
the total amount of hemoglobin present in the sample, the status
regarding the PRRS virus, as well as the sex and the number and location
of the farm (MA = Mantua region, LO = Lodi region).
Genini et al. Proteome Science 2012, 10:48 Page 14 of 16
/>Additional file 3: Figure S1. Detailed protocol of the SELDI-TOF MS
analysis. Schematic illustration of the protocol used for SELDI-TOF MS,
which follows the manufacturer’s instruction manual with minor
modifications (Bio-Rad Laboratories, ProteinChip
W
Serum Fractionation Kit
manual). The protocol is divided in 7 main steps: A) Pre-fractionation of
the sera; B) Rehydration and equilibration of the Protein Chip Q strong
anion-exchange resin filtration plate; C) Fractionation of the sera; D)
Preparation of ProteinChip
W
Arrays; E) Binding of the serum fractions to
the arrays; F) Preparation and application of the matrix; and G) SELDI-TOF
MS analysis.
Competing interests
The authors declare that they have no competing interests.
Authors’ contributions
SG established the experimental settings, prepared the samples, helped
conceiving the study design, and wrote the manuscript. TP helped with the
analysis of the data and the manuscript writing. ACO conducted the
SELDI-TOF MS experiment and performed statistical analyses. SB arranged for
sample collection and helped to draft the manuscript. MVL developed the
primers to detect PRRSV and performed the PCR analyses to assess
presence/absence of the virus. ACA was responsible for data storage and
database maintenance. EG coordinated the overall project and participated
in the design of the study and helped to draft the manuscript. All authors
read and approved the final manuscript.
Acknowledgements
The authors are very thankful to Maria Cecere, Roberto Grande, Roberto
Malinverni, Silvia Rossini, and Elisa Filippi for technical assistance in the
laboratory and for helpful comments. They also are very thankful to
Joan K. Lunney for critical reading and revision of the manuscript. This
project was supported by a grant of the Italian Ministry of Research
(MIUR project, art.10 D.M. 593/00).
Author details
1
Parco Tecnologico Padano - CERSA, Via Einstein, 26900 Lodi, Italy.
2
IASMA-FEM Research and Innovation Centre, Via E. Mach 1, 38010 San
Michele a/A, TN, Italy.
3
BIOTRACK s.r.l., Via Einstein, 26900 Lodi, Italy.
4
Istituto
Zooprofilattico Sperimentale della Lombardia e dell'Emilia Romagna, 26900
Lodi, Italy.
5
Present address: Department of Clinical Studies, School of
Veterinary Medicine, University of Pennsylvania, Philadelphia, PA 19104 USA.
6
Present address: Sandoz Industrial Products S.p.A., Corso Verona 165, 38068
Rovereto, TN, Italy.
7
Present address: INRA, UMR 1313 de Génétique Animale
et Biologie Intégrative, Jouy-en-Josas, France.
Received: 29 March 2012 Accepted: 17 July 2012
Published: 8 August 2012
References
1. Davies G, Genini S, Bishop SC, Giuffra E: An assessment of opportunities to
dissect host genetic variation in resistance to infectious diseases in
livestock. Animal 2009, 3:415–436.
2. An TQ, Tian ZJ, Xiao Y, Li R, Peng JM, Wei TC, Zhang Y, Zhou YJ, Tong GZ:
Origin of highly pathogenic porcine reproductive and respiratory
syndrome virus, China. Emerg Infect Dis 2010, 16:365–367.
3. Zhou L, Yang H: Porcine reproductive and respiratory syndrome in China.
Virus Res 2010, 154:31–37.
4. Lunney JK, Benfield DA, Rowland RR: Porcine reproductive and respiratory
syndrome virus: an update on an emerging and re-emerging viral
disease of swine. Virus Res 2010, 154:1–6.
5. Snijder EJ, Meulenberg JJ: The molecular biology of arteriviruses. J Gen
Virol 1998, 79:961–979.
6. Cho JG, Dee SA: Porcine reproductive and respiratory syndrome virus.
Theriogenology 2006, 66:655–662.
7. Neumann EJ, Kliebenstein JB, Johnson CD, Mabry JW, Bush EJ, Seitzinger
AH, Green AL, Zimmerman JJ: Assessment of the economic impact of
porcine reproductive and respiratory syndrome on swine production in
the United States. J Am Vet Med Assoc 2005, 227:385–392.
8. Horter DC, Pogranichniy RM, Chang CC, Evans RB, Yoon KJ, Zimmerman JJ:
Characterization of the carrier state in porcine reproductive and
respiratory syndrome virus infection. Vet Microbiol 2002, 86:213–228.
9. Klinge KL, Vaughn EM, Roof MB, Bautista EM, Murtaugh MP: Age-dependent
resistance to Porcine reproductive and respiratory syndrome virus
replication in swine. Virol J 2009, 6:177.
10. Kimman TG, Cornelissen LA, Moormann RJ, Rebel JM, Stockhofe-Zurwieden
N: Challenges for porcine reproductive and respiratory syndrome virus
(PRRSV) vaccinology. Vaccine 2009, 27:3704–3718.
11. Genini S, Delputte PL, Malinverni R, Cecere M, Stella A, Nauwynck HJ, Giuffra
E: Genome-wide transcriptional response of primary alveolar
macrophages following infection with porcine reproductive and
respiratory syndrome virus. J Gen Virol 2008, 89:2550–2564.
12. Wills RW, Doster AR, Galeota JA, Sur JH, Osorio FA: Duration of infection
and proportion of pigs persistently infected with porcine reproductive
and respiratory syndrome virus. J Clin Microbiol 2003, 41:58–62.
13. Somasundaram K, Nijaguna MB, Kumar DM: Serum proteomics of glioma:
methods and applications. Expert Rev Mol Diagn 2009, 9:695–707.
14. Hodgetts A, Levin M, Kroll JS, Langford PR: Biomarker discovery in
infectious diseases using SELDI. Future Microbiol 2007, 2:35–49.
15. Devitt EJ, Power KA, Lawless MW, Browne JA, Gaora PO, Gallagher WM,
Crowe J: Early proteomic analysis may allow noninvasive identification of
hepatitis C response to treatment with pegylated interferon alpha-2b
and ribavirin. Eur J Gastroenterol Hepatol 2011, 23:177–183.
16. Toro-Nieves DM, Rodriguez Y, Plaud M, Ciborowski P, Duan F, Perez Laspiur
J, Wojna V, Melendez LM: Proteomic analyses of monocyte-derived
macrophages infected with human immunodeficiency virus type 1
primary isolates from Hispanic women with and without cognitive
impairment. J Neurovirol 2009, 15:36–50.
17. Pang RT, Poon TC, Chan KC, Lee NL, Chiu RW, Tong YK, Wong RM,
Chim SS, Ngai SM, Sung JJ, Lo YM: Serum proteomic fingerprints of
adult patients with severe acute respiratory syndrome. Clin Chem
2006, 52:421–429.
18. Fenollar F, Goncalves A, Esterni B, Azza S, Habib G, Borg JP, Raoult D:
A serum protein signature with high diagnostic value in bacterial
endocarditis: results from a study based on surface-enhanced laser
desorption/ionization time-of-flight mass spectrometry. J Infect Dis 2006,
194:1356–1366.
19. Rioux MC, Carmona C, Acosta D, Ward B, Ndao M, Gibbs BF, Bennett HP,
Spithill TW: Discovery and validation of serum biomarkers expressed over
the first twelve weeks of Fasciola hepatica infection in sheep. Int J
Parasitol 2008, 38:123–136.
20. Genini S, Cantu M, Botti S, Malinverni R, Costa A, Marras D, Giuffra E:
Diagnostic markers for diseases: SELDI-TOF profiling of pig sera for PRRS.
Dev Biol 2008, 132:399–403.
21. Zhong L, Taylor DL, Whittington RJ: Proteomic profiling of ovine serum by
SELDI-TOF MS: optimisation, reproducibility and feasibility of biomarker
discovery using routinely collected samples. Comp Immunol Microbiol
Infect Dis 2010, 33:47–63.
22. Leak LV, Liotta LA, Krutzsch H, Jones M, Fusaro VA, Ross SJ, Zhao Y, Petricoin
EF 3rd: Proteomic analysis of lymph. Proteomics 2004,
4:753–765.
23. Nelsen CJ, Murtaugh MP, Faaberg KS: Porcine reproductive and respiratory
syndrome virus comparison: divergent evolution on two continents.
J Virol 1999, 73:270–280.
24. Zimmerman J, Karriker L, Ramirez A, Schwartz K, Stevenson G: Diseases of
Swine. New York: John Wiley & Sons Inc; 2012.
25. Meulenberg JJ, Petersen-den Besten A, De Kluyver EP, Moormann RJ,
Schaaper WM, Wensvoort G: Characterization of proteins encoded by
ORFs 2 to 7 of Lelystad virus. Virology 1995, 206:155–163.
26. Zhang C, Xue C, Li Y, Kong Q, Ren X, Li X, Shu D, Bi Y, Cao Y: Profiling of
cellular proteins in porcine reproductive and respiratory syndrome virus
virions by proteomics analysis. Virol J 2010, 7:242.
27. Wu WH, Fang Y, Farwell R, Steffen-Bien M, Rowland RR, Christopher-
Hennings J, Nelson EA: A 10-kDa structural protein of porcine
reproductive and respiratory syndrome virus encoded by ORF2b. Virology
2001, 287:183–191.
28. Gnanandarajah JS, Dvorak CM, Johnson CR, Murtaugh MP: Presence of free
haptoglobin alpha 1 S-subunit in acute porcine reproductive and
respiratory syndrome virus infection. J Gen Virol 2008, 89:2746–2753.
29. Zhang H, Guo X, Ge X, Chen Y, Sun Q, Yang H: Changes in the cellular
proteins of pulmonary alveolar macrophage infected with porcine
Genini et al. Proteome Science 2012, 10:48 Page 15 of 16
/>reproductive and respiratory syndrome virus by proteomics analysis.
J Proteome Res 2009, 8:3091–3097.
30. Sagong M, Lee C: Differential cellular protein expression in continuous
porcine alveolar macrophages regulated by the porcine reproductive
and respiratory syndrome virus nucleocapsid protein. Virus Res 2010,
151:88–96.
31. Ding Z, Li ZJ, Zhang XD, Li YG, Liu CJ, Zhang YP, Li Y: Proteomic alteration
of Marc-145 cells and PAMs after infection by porcine reproductive and
respiratory syndrome virus. Vet Immunol Immunopathol 2012,
145:206–213.
32. Issaq HJ, Veenstra TD, Conrads TP, Felschow D: The SELDI-TOF MS
approach to proteomics: protein profiling and biomarker identification.
Biochem Biophys Res Commun 2002, 292:587–592.
33. Monari E, Casali C, Cuoghi A, Nesci J, Bellei E, Bergamini S, Fantoni LI, Natali
P, Morandi U, Tomasi A: Enriched sera protein profiling for detection of
non-small cell lung cancer biomarkers. Proteome Sci 2011, 9:55.
34. Hu Q, Huang Y, Wang Z, Tao H, Liu J, Yan L, Wang K: Application of
Surface-Enhanced Laser Desorption/Ionization Time-of-Flight Mass
Spectrometry Coupled With an Artificial Neural Network Model for the
Diagnosis of Hepatocellular Carcinoma. Hepatogastroenterology 2012,
59:1902–1906.
35. Tirumalai RS, Chan KC, Prieto DA, Issaq HJ, Conrads TP, Veenstra TD:
Characterization of the low molecular weight human serum proteome.
Mol Cell Proteomics 2003, 2:1096–1103.
36. Hortin GL: The MALDI-TOF mass spectrometric view of the plasma
proteome and peptidome. Clin Chem 2006, 52:1223–1237.
37. Petricoin EF, Belluco C, Araujo RP, Liotta LA: The blood peptidome: a
higher dimension of information content for cancer biomarker
discovery. Nat Rev Cancer 2006, 6:961–967.
38. Archibald AL, Bolund L, Churcher C, Fredholm M, Groenen MA, Harlizius B,
Lee KT, Milan D, Rogers J, Rothschild MF, Uenishi H, Wang J, Schook LB:
Swine Genome Sequencing Consortium: Pig genome sequence–analysis
and publication strategy. BMC Genomics 2010, 11:438.
39. Biffani S, Botti S, Bishop SC, Stella A, Giuffra E: Using SNP array data to test
for host genetic and breed effects on Porcine Reproductive and
Respiratory Syndrome Viremia. BMC Proc 2011, 5(Suppl 4):S28.
40. Rider CV, Gorr TA, Olmstead AW, Wasilak BA, LeBlanc GA: Stress signaling:
coregulation of hemoglobin and male sex determination through a
terpenoid signaling pathway in a crustacean. J Exp Biol 2005,
208:15–
23.
41. Suarez P, Zardoya R, Prieto C, Solana A, Tabares E, Bautista JM, Castro JM:
Direct detection of the porcine reproductive and respiratory syndrome
(PRRS) virus by reverse polymerase chain reaction (RT-PCR). Arch Virol
1994, 135:89–99.
42. Kono Y, Kanno T, Shimizu M, Yamada S, Ohashi S, Nakamine M, Shirai J:
Nested PCR for detection and typing of porcine reproductive and
respiratory syndrome (PRRS) virus in pigs. J Vet Med Sci 1996,
58:941–946.
43. Beebe KR, Pell RJ, Seasholtz MB: Chemometrics: a Practical Guide. New York:
John Wiley & Sons Inc; 1998.
doi:10.1186/1477-5956-10-48
Cite this article as: Genini et al.: Identification of serum proteomic
biomarkers for early porcine reproductive and respiratory syndrome
(PRRS) infection. Proteome Science 2012 10:48.
Submit your next manuscript to BioMed Central
and take full advantage of:
• Convenient online submission
• Thorough peer review
• No space constraints or color figure charges
• Immediate publication on acceptance
• Inclusion in PubMed, CAS, Scopus and Google Scholar
• Research which is freely available for redistribution
Submit your manuscript at
www.biomedcentral.com/submit
Genini et al. Proteome Science 2012, 10:48 Page 16 of 16
/>