Fabrication, characterization, and modeling of silicon multi gate devices
Bạn đang xem bản rút gọn của tài liệu. Xem và tải ngay bản đầy đủ của tài liệu tại đây (2.6 MB, 172 trang )
FABRICATION, CHARACTERIZATION, AND MODELING
OF SILICON MULTI-GATE DEVICES
ZHAO HUI
A THESIS SUBMITTED FOR THE DEGREE OF DOCTOR OF PHILOSOPHY
DEPARTMENT OF ELECTRICAL AND COMPUTER ENGINEERING
FACULTY OF ENGINEERING
NATIONAL UNIVERSITY OF SINGAPORE
To Alick
i
EXECUTIVE SUMMARY
As multi-gate devices such as FinFET and nanowire FETs emerges as leading contenders
of the future generation electron devices, detailed study of their electrical properties,
characterization as well as effective modeling solution are much needed before they
become truly viable for industrial application. This dissertation addresses the fabrication,
characterization and modeling of silicon multi-gate transistors fabricated using the
conventional CMOS platform. Its main purpose is to overcome some major challenges in
both device fabrication and sub-femto farad capacitance measurement and modeling. A
study of three dimensional electric field provided valuable insights to device operation
and optimization for multi-gate devices. Charge Based Capacitance Measurement
(CBCM) was simulated, analyzed, verified and applied for the first time to measurement
of sub-femto farad voltage dependent capacitances. CBCM test keys were designed and
fabricate for measurements of sub-femto scale nanowire capacitance. Also, measurement
of charge and capacitance on single channel nanowire devices were used for self-
consistent tight-binding computation of intrinsic and extrinsic capacitance calculation and
extraction of series resistance and carrier mobility.
ii
ACKNOWLEDGEMENT
First and foremost I offer my most sincere gratitude to my supervisors, Prof. Ganesh
S. Samudra and Dr. Subhash C. Rustagi, for their inspiration, encouragement, and
guidance throughout this work. Without them this thesis would not have been completed
or written. One simply could not wish for a better or friendlier supervisor and teacher.
My gratitude is also devoted to Dr. Patrick Lo, Dr. Navab Singh, and all other
researchers, engineers and colleagues at Institute of Microelectronics, Singapore. They
helped me in so many ways in completing my experiments. I feel extremely privileged to
have been working with them.
I‟m also grateful to Dr. Mark Lundstrom and his group at Purdue University for,
collaboration and their insightful comments and discussions. Especially Mr. Raseong
Kim and Mr. Abhijeet Paul, who has helped in carrying out the tight-binding calculation,
in many ways I have learnt much from the both of them.
In my daily work I have been blessed with a friendly and cheerful group of fellow
students. I thank Ms. Jiang Yu, Mr. Zang Hui, Mr. Wang Jian, Mr. Ma Fa-Jun, Ms. Fu Jia,
Ms. Mao Shengchun for being such companiable classmates and faithful friends. I‟m
indebted to them for giving me so much help, support and encouragement. I‟m also
thankful to all students and engineers in SNDL who have worked together with me and
brightened many a dull lunch time. I will cherish their friendship for a lifetime.
Finally, I thank my parents for their love and for supporting me through all my
studies at Singapore.
I dedicate this work to my husband Alick whose love makes me go on.
iii
TABLE OF CONTENTS
EXECUTIVE SUMMARY i
ACKNOWLEDGEMENT ii
TABLE OF CONTENTS iii
LIST OF FIGURES vii
LIST OF TABLES xv
Chapter 1 Introduction 1
1.1 Planar MOSFET Scaling: History, Trends and Issues 1
1.1.1 Increasing dielectric field and short channel effects 3
1.1.2 Leakage currents 4
1.1.3 Variability 5
1.2 Next Generation MOSFET Devices 5
1.3 Motivation of the Dissertation 8
1.4 Outline of Dissertation 10
Reference for Chapter 1 12
Chapter 2 Simulation of FinFET and Their Scaling Properties 17
2.1 Introduction 17
2.2 The Device Structure, and, 3D Process and Device Simulation 19
2.2.1 Necessity of 3D device structure 19
2.2.2 FinFET device with under-lapped gate structure 20
2.2.3 3D process and device simulation and calibration 22
2.3 Effect of Fringing Field in Multiple Gate FinFET 24
2.4 Effects of High-k Gate Dielectric Material and Dielectric Thickness Scaling 31
iv
2.5 Scaling of Fin Width, Gate Electrode Thickness, and Pitch in Multi-fin Devices . 36
2.6 Implications to Nanowire and Other Nanoscale MOSFET Devices 40
2.7 Chapter Summary and Conclusion 43
Reference for Chapter 2 44
Chapter 3 Charge Based Capacitance Measurement (CBCM) for Femto-Farad
Scale Capacitance Measurement– Simulation and Analysis 49
3.1 Introduction 49
3.1.1 Challenges in C-V characterization of nanoscale devices 49
3.1.2 Conventional measurement options and CBCM 50
3.2 Principle of CBCM and Setup 52
3.3 CBCM Simulation and Efficacy Study of Three Setups 58
3.4 Analysis of Main Sources of Errors 63
3.4.1 Charge Injection Error 64
3.4.2 Random noise due to mismatch/variation 65
3.4.3 Random noise due to numerical error 67
3.5 Assessment of CBCM Efficacy and Its Limits 69
3.6 Chapter summary and conclusion 71
Reference for Chapter 3 73
Chapter 4 Fabrication of Si Nanowire Devices 76
4.1 Introduction and Si NW Process Flow Overview 76
4.2 Substrate Preparation, Lithography and Fin Formation 78
4.3 Stress-limited Oxidation for Nanowire Formation 81
4.3.1 2D Diffusion/oxidation model 83
v
4.3.2 Shape control of the NW channel 85
4.3.3 Observation of stress-limited oxidation 88
4.4 Gate stack Formation, Implant and Metallization 91
4.5 Poly-Si Stringer Effects and Its Elimination 92
4.6 Chapter Summary and Conclusion 98
Reference for Chapter 4 99
Chapter 5 Sub-Femtofarad Scale Capacitance Measurement Using CBCM 102
5.1 Introduction 102
5.2 CBCM Test Key Design and Fabrication 103
5.3 CBCM Test setup and I-V Characterization of DUT and Drivers 106
5.4 Verification of CBCM with LCR Meter Measurement 112
5.5 Femto-farad scale capacitance measurement using CBCM 114
5.6 Chapter Summary and Conclusion 120
Reference for Chapter 5 122
Chapter 6 Device Analysis and Modeling for Single Channel NW Devices 124
6.1 Introduction 124
6.2 3D COMSOL Multiphysics Calculation of Parasitic Capacitance 127
6.3 Simulation of Channel Charges and C-V 132
6.3.1 2D Medici model 133
6.3.2 Self-consistent simulation using sp
3
s*d
5
tight-binding model 135
6.4 Mobility Extraction and Analysis for Single Channel SiNW Device 139
6.5 Chapter Summary and Conclusion 144
Reference for Chapter 6 146
vi
Chapter 7 Conclusions and Future Work 148
7.1 Summary and Major Contributions of Dissertation 148
7.2 Suggestions for Future Works 151
7.2.1 Self-limited oxidation modeling 151
7.2.2 CBCM Measurement for transport modeling 152
7.2.3 Optimization for minimized extrinsic capacitance 152
APPENDIX: LIST OF PUBLICATIONS 154
vii
LIST OF FIGURES
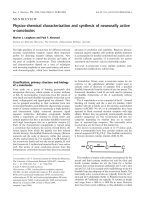
Fig. 1-1: Conventional planar MOSFET structure and constant field scaling theory 1
Fig. 1-2: Oxide field plotted against technology generations . 3
Fig. 1-3: Subthreshold leakage power plotted against year . 5
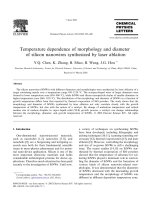
Fig. 1-4: The trade-off relationships among the three main indexes of performance:
current drive I
ON
, the SCE, and the power consumption P
consum
. Listed along the arrows
are the process/device parameters related to the three indexes. 6
Fig. 1-5: Device structure illustrated for (a) – the tri-gate FinFET (b) – the nanowire FET
7
Fig. 2-1: (a) Three-dimensional (3D) schematic of a multiple-fin FinFET device showing
the electric field liens from the gate to the source on the first fin. The spacer region and
the raised S/D regions are not shown. 20
Fig. 2-2: Comparing the 3D simulation result of C
gs
of a FinFET with the 2D estimation
(calculated based on average capacitance per unit gate length) 20
Fig. 2-3: A cross-section of the FinFET device along the cut line in Fig. 2-1. Three major
components of the gate-to-source capacitance C
gs
are illustrated 21
Fig. 2-4: (a) – FinFET structure simulated by Taurus Process™ 3D. (b)&(c) – the implant
profile simulated shown in the device cross section for Arsenic and Phosphorus,
respectively 22
Fig.2-5: Gate work function and dielectric thickness fitting using C-V measurement data
23
Fig. 2-6: Calibrated device gate characteristic 23
Fig. 2-7: Gate-to-source capacitances of three identical devices with different gate and
spacer geometries. Device A- with volume gate electrode and nitride spacer. Device B-
with volume gate electrode and no spacer. Device C- with surface gate electrode and no
spacer. Inset: schematic cross-sections of the three FinFET devices. 25
Fig. 2-8: Comparison of On- and Off-current of the three devices. A- with gate electrode
height 20 nm and nitride spacer. B- with gate electrode height 20 nm and no spacer. C-
with surface gate electrode height 0 nm and no spacer. 26
Fig. 2-9: On- and Off- currents for devices with different spacer widths and materials.
Both devices have volume gate electrode. Fin width is 9 nm and gate length is 13 nm. 27
viii
Fig. 2-10: Electrostatic potential plot for (a)-(e): cross section along x-axis through mid-
fin at bias Vds=0.9 V, Vgs=0.9 V. (f)-(j): cross section perpendicular to x-axis at center
of channel at bias Vds=0.9 V, Vgs=0 V. All devices are identical except for the width of
spacers. Fin body under gate has higher potential for devices without spacer due to
reduced fringing capacitance from gate sidewall to S/D region and under lapped channel
region. 28
Fig. 2-11: Total gate capacitance and intrinsic delay plotted as a function of S/D
extension region length. Shorter extension length is favorable for both enhanced current
drive and reduced gate load capacitance. Bias condition: V
ds
=V
gs
=0.9 V. All devices have
uniform spacer width of 10 nm. 31
Fig. 2-12: Total effective gate capacitance with respect to silicon nitride spacer width for
devices with SiO
2
and HfO
2
(ε=21) gate dielectric material of the same EOT (1nm). All
devices have fin width 9 nm, gate length 13 nm, fin body thickness 13nm. Bias condition:
V
d
=V
g
=0.9V and V
s
=0V. Inset: electric potential plot in channel comparing devices with
different dielectric of same EOT both device has same spacer with of 10nm. 32
Fig. 2-13: Intrisic gate delay with respect to silicon nitride spacer width for devices with
SiO
2
and HfO
2
(ε=21) gate dielectric material of the same EOT (1nm). All devices have
fin width 9 nm, gate length 13 nm, fin body thickness 13 nm. Bias condition: V
d
=V
g
=0.9
V and V
s
=0 V 34
Fig. 2-14: Variation of intrinsic delay and I
ON
normalized by dielectric capacitance with
respect to high- κ dielectric (HfO
2
, ε=21) thickness. 35
Fig. 2-15: Intrinsic delay against fin widths for multi-fin devices of various pitches. All
devices have gate length 13nm, gate and spacer height 20nm, and the fin body thickness
13 nm. Bias condition: V
d
=V
g
=0.9V and V
s
=0V. 38
Fig. 2-16: Comparing intrinsic delay and total effective gate capacitance with respect to
fin pitch for devices with thick FUSI gate electrode and thin metal electrode. Identical
gate workfunction of 4.6 eV are assumed for all devices. All devices have gate length 13
nm, and the fin body thickness 13 nm. Inset: a multi-fin device with very thin gate
electrode that is much less than half pitch. Spacers, BOX and substrate Si layers are not
shown for clarity 39
Fig. 2-17: Progression from FinFET to GAA NWFET 41
ix
Fig. 2-18: Comparing the structural difference between FinFET and NWFET 41
Fig. 2-19: A cross-section of the NWFET device along the centre of channel. Three
major components of the gate-to-source capacitance C
gs
are illustrated 42
Fig. 3-1: Switch capacitance model for CBCM test 53
Fig. 3-2 (a): CBCM implementation circuit with input and output terminals (b):
equivalent circuit with parasitic capacitances for CBCM measurement 54
Fig. 3-3: The pulse shape for the input signals to the test key terminals during CBCM
measurement. PG and NG are applied to the gates of the P and N-type driver respectively,
a constant voltage SD is applied to the source and drain of DUT. 55
Fig. 3-4: CBCM test keys (a): proposed by Chen et al. for interconnect capacitance (b):
proposed by Vendrame et al. Charge feed back in N- and P- transistors of the pass gates
is expected to „balances‟ out (c) proposed by Chang et al. It relaxes the demand on
„matching‟ as same drivers are used two times. (d): Input pulses PG – at P driver gate,
NG – at N driver gate, SD – at S&D of DUT in setup (c). 58
Fig. 3-5: Input and simulated output voltage wave forms for the three methods. For
setups of Fig.3-4 (a) and (b), V
DUT
is at the gate of DUT and V
REF
is tapped at X in the
reference branch. V
dd
is 0.8V. Setup in Fig. 3-4 (b) reduces overall amount of charge
injected. Setup of Fig.3-4 (c) reduces difference in charge injection for two measurements
when PMOS is switching off. The imbalance during the falling and rising edges of the
pulse at S/D may not be significant as P-driver is off. 60
Fig. 3-6: Bias-dependent capacitance derived by CBCM setup of Fig 3-4 (a). DUTs with
1, 10, and 100 parallel fingers are considered and compared with the exact capacitance
(small signal AC analysis in MEDICI). The error is very large for one finger DUT (max
capacitance ~0.45fF). 61
Fig. 3-7: Bias-dependent capacitance derived by the CBCM setup in Fig. 3-4 (b) with 5,
10, and 100 parallel DUT fingers. Solid line is the exact capacitance calculated by AC
small signal method in MEDICI. This method is accurate even at 3 finger DUT (Max
cap=1.35fF). 62
Fig. 3-8: Bias-dependent capacitance derived by the CBCM setup in Fig. 3-4 (c) with 3, 5,
and 100 parallel DUT fingers. Solid line is the exact capacitance calculated by AC small
x
signal method in MEDICI. Large errors are observed for DUTs with 5 or lesser no. of
fingers. 62
Fig. 3-9: Symbols are C’
meas
derived by CBCM simulation for 100- and 1-finger DUT
using FD, and for 1-finger DUT derived using S-G method. Solid line shows the parasitic
at node X obtained from compact model (BSIM3) for the drivers used in the mixed-mode
simulation. The discrepancy is due to charge injection and numerical errors. Inset: The
difference in time dependent current
'
DD
V
I
for DUT with 100-finger and a single-finger
due to effects of charge injection.
Although the DUT is invisible during the charging
cycle in both cases, magnitude of its capacitance still affects the amount of charge
injected to V
DD
. 64
Fig. 3-10: RMS error plotted against introduced random error in the charge for setups of
Fig. 3-3 (a)-(c). Large DUT capacitance enhances tolerance to error in all the methods. 67
Fig. 3-11: C-V curves obtained by CBCM method for DUT with 100, 10 and 5 fingers
using FD and 5-finger C
DUT
curve using S-G method. Solid line shows the C-V
characteristics obtained for the nano-wire device using small-signal analysis (Signal
level= (kT/10q) and frequency: 1MHz). 69
Fig. 3-12 RMS error over the bias range considered in the CBCM simulations plotted
against the relative ratio of C
DUT
and C
par
. The error increases rapidly when C
DUT
is less
than 20% of the magnitude of C
par
. Inset shows the details for C
DUT
/C
par
<12%. 71
Fig. 4-1: Process flow and schematic diagrams for SNW device fabrication 77
Fig. 4-2: Mask layout design schematic for both N and P type single and multiple finger
NW devices. 79
Fig. 4-3: Images of the NW device structure after fin and S&D etch (a): using single
mask lithography, circled region showing the flaring at the corner of each ends of the fin
(b): using double mask two step lithography, circle region showing that the flaring has
been eliminated 80
Fig. 4-4: Schematic illustrating the two masks, two steps process for fin and S&D
definition to eliminate the proximity effect. 81
Fig. 4-5: The relationship between limiting Si core diameters and the corresponding
limiting column oxide thicknesses when the core reduction rate is reduced (less than 0.2
nm/h). Each group of data points on a single extrapolated straight line corresponds to an
xi
identical starting column diameter, di. As the oxidation temperature increases from 850 to
950 ºC, the data points move toward a smaller core diameter and a larger oxide thickness.
82
Fig. 4-6: (a)- the simulation structure cross section (b)-the silicon fin profile evolution
under dry oxidation at 875ºC. (c)-the experiment TEM cross section of twin triangular
NW 85
Fig 4-7. (a)-(d):The initial structure has a variation of 130~160nm in width. (A)-(D): the
corresponding profiles of the silicon cores after 1150ºC 20 minutes oxidation. 87
Fig. 4-8: TEM picture of the silicon core profile after 1050ºC 5 minutes and 875ºC 4
hours dry oxidation. Good corner rounding is observed. The silicon core profile is elliptic.
Estimate dimension of the starting fin is: width=70 nm height=50nm 88
Fig 4-9: TEM cross section image of (a) – initial fin before oxidation (b) – after 80 min
dry oxidation at 975ºC. 89
Fig 4-10: TEM cross section image of NW channel after 1.6, 6 and 15 hrs oxidation at
875°C respectively 90
Fig 4-11: TEM cross section image of NW channel after 1.7, 13.1 and 22 hrs oxidation at
850°C respectively 90
Fig. 4-12: (a) - NW device after gate stack formation showing the shape of the poly-Si
gate and gate contact (b) - SEM image of an inverter circuit of multi-wire NW devices
after metal etch 92
Fig. 4-13: The NW device structure after (a) – poly-Si deposition (b) – poly-Si etch
showing the stringer surrounding S&D sidewall and connected to the gate (c) – zoomed
in image of the stringer (circled with dashed line) formed around the side wall of the
source/drain contact region. 93
Fig. 4-14: Final mask layout design schematic with fin layer and reverse gate layer for
both N and P type single and multiple finger NW devices. 95
Fig. 5-1: CBCM Test key designed to measure C-V and I-V on the same NW DUT. 104
Fig. 5-2: (a) – complete layout of a CBCM test key (b) – zoomed in image of the devices
in the test key (c) – a micro image of the test key fabricated on-chip showing the DUT,
the drivers and the metal connections to testing pads. 105
xii
Fig. 5-3: (a) – SEM image of a test key set fabricated on-chip with a 5 wire multiple
finger DUT (b) – SEM image of a single wire NW DUT after local release (c) – TEM
image of the NW cross section after gate formation. 106
Fig. 5-4: Pulse inputs to PG, NG, S and D terminals (Fig. 5-1) (a) for N-type and (b) for
P-type DUT C-V measurements. 109
Fig. 5-5: (a) – Measured I
d
–V
gs
characteristics for P and N- type SNW DUT under
various bias conditions. The threshold voltages of both N and P devices are extracted
using Gm (Max) technique. (b) - : Measured I
d
–V
g
characteristics for P and N-type
driver devices. These devices have wider channel diameters and thus different threshold
voltages. 112
Fig. 5-6: Calibration of CBCM technique using precision LCR meter (Agilent 4284). The
DUT in this case are 100 finger N (a) and P type (b) SNW devices. The LCR meter
capacitances are influenced by the residual capacitance after calibration which is in the
range of ±2 fF. The error bars in the C-V meters indicate standard deviation of 16
measurements. 113
Fig. 5-7: (a)
DD
V
I
and
'
V
DD
I
plotted as a function of time extracted by TCAD simulation. The
time dependent currents rise/fall sharply during charging discharging phases (b) – (c)
show the zoomed plots of the three current peaks 115
Fig. 5-8: Measured average currents of
DD
V
I
and
'
V
DD
I
, as well as their difference (
DD
V
I
-
'
V
DD
I
)
plotted as a function of V
gsd
. 115
Fig. 5-9: CBCM measurement of C
par
, (C
par
+C
DUT
) and the very low C
DUT
of ~1fF for (a)
N-type (b) P-type single finger SNW device of 0.85 μm gate length. 117
Fig. 5-10: Measured C-V characteristics of (a) N type and (b) P type DUT with gate
lengths of 0.85 µm and 0.6 µm respectively. 16 measurements were taken on the same
device and the error bars represent the standard deviation of capacitance data obtained
from individual charge measurements. 118
Fig. 5-11: C
DUT
–V curve for (a) single finger DUT with S/D contact region length of 1
µm and (b) 5 finger DUT with S/D contact region length of 2 µm, both extracted using
CBCM. 119
Fig. 5-12: Device layout schematic for single finger and 5 finger DUTs 120
xiii
Fig. 6-1: (a) – the C-V characteristic of the NW device modeled (b) –cross sectional
TEM view perpendicularly across channel of the medeled device, inset shows the detail
for the NW channel 127
Fig. 6-2: (a) – cross section TEM view along the channel direction of the modeled device,
with dimensions of poly-Si gate, BOX layer, and pre-metal dielectric thickness illustrate
(b) - The TEM cross-section in the direction of current flow shows that there is
significant under-cut of the buried oxide during the local release of nanowires. This
brings the gate poly to be as close to S/D contact area as the gate dielectric thickness
increasing the parasitic C
G/S
as shown in the zoomed image in the inset. 128
Fig. 6-3: (a) – the simulated device structure in COMSOL with dimension illustrated (b)
– bench-marking the COMSOL analytical simulation result (marked by the red dot) with
the results reported in . 130
Fig. 6-4: (a) – a schematic of the device top view for 3D modeling of parasitic
capacitance (not to scale). Only half of the structure is simulated due to symmetry
(simulation domain is marked by yellow shading). (b) – A 3D snapshot of the simulation
domain (ruler unit: µm). The cut plane parallel to z-direction shows the electric potential
distribution in the structure. 130
Fig. 6-5: Cross section view of the simulated device structure at bias V
gsd
=1 V showing
the electrical potential distribution and dimensions (a) – along Cut line 1 (b) – along Cut
line 2 shown in Fig. 6-3 (a). Both planes are along z-direction. 132
Fig. 6-6: (a) – Simulation domain built in Medici according to the TEM cross section
image of the NW device (b) and (c) – Medici simulation results of electron potential (in
Volt) and electron charge density (in cm
-3
) respectively. Bias condition for (b) and (c) is
V
g
=1 V. 134
Fig. 6-7: Comparing the measurement C-V curve and the C-V extracted from Medici
simulations. 134
Fig. 6-8: (a) – The lattice in the wire cross section in (100)/[100] direction (b)&(c) –
showing the valence and conduction bandstructure respectively for the NW under
consideration 135
Fig. 6-9: The simulated (a) – electric potential distribution and (b) – electron charge
distribution in a triangular NW cross section (c) – the C-V curve obtained by
xiv
measurement and the simulated C-V curve (the parasitic capacitance simulated by
COMSOL was added to the intrinsic gate capacitance) 136
Fig. 6-10 : (a) and (b) Potential and electron density in channel obtained by self-
consistent computation, respectively (c) – measurement C-V curve compared against the
simulated C-V with sp
3
s*d
5
tight-binding model with precise channel cross section
dimension (the parasitic capacitance simulated by COMSOL was added to the intrinsic
gate capacitance) 138
Fig. 6-11: Plotted total resistance (R
tot
=V
ds
/I
ds
) showing the asymptotic behaviour of R
tot
vs V
gs
for both N and P-type DUT NW devices 140
Fig. 6-12: Series resistance for (a) – P-type and (b) – N-type Si NW channels extracted
from the linear region of Id-V
gs
characteristics at high V
gs
by plotting (R
tot
=V
d
/I
d
) against
1/(V
gsd
-V
th
-V
d
/2). 141
Fig. 6-13: Extracted series resistance for different value of θ from a single device
showing that θ and series resistances trade-off with each other. 142
Fig. 6-14: (a) – Inversion charge density plotted against V
gs
(b) – effective mobility
extracted vs. inversion charge density for P-type NW device. 143
Fig. 6-15: Box plot with distribution of the average strong inversion mobility of the (a) –
N and (b) – PMOS transistors respectively for two different thermally grown gate
dielectric thicknesses. The mobility reduces for devices with lower gate dielectric
thickness on account of more significant surface roughness scattering. 144
xv
LIST OF TABLES
Table 4-1: Complete process flow for stringer-free, uniform cross section NW device
fabrication on CMOS platform 97
Table 5-1: Stimuli applied at the terminals of the test key for measuring the I-V
characteristics of the N and P drivers and the DUT, and, the C-V measurement of N and
P-type SNW DUTs. The I-V of Driver devices help in deciding the values of LOW and
HIGH and the levels of PGn, PGp, NGn, and NGp pulses in the table. The drivers are
SNW devices with gate length of 0.35μm and a larger diameter to source/sink sufficient
charging/discharging current. 110
Table 5-2: Comparing experiment results of CBCM technique with the state-of-the-art
121
xvi
1
Chapter 1
Introduction
1.1 Planar MOSFET Scaling: History, Trends and Issues
The first commercially successful CPU product with gate length less than 100 nm
were shipped by Intel© in year 2002, marking the end of Microelectronics Era and
inaugurating the beginning of the Nanoelectronics Era [1]. In the course of less than 50
years, the semiconductor industry has grown from $1B of 1963 to more than $250B in
2007 [2] following essentially Moore‟s law [3] and guided by Dennard‟s scaling theory
[4][5].
Dennard‟s scaling theory is based on device parameters and operating voltage scaling
by the same factor, maintaining a constant electric field in the device. Fig. 1-1 described
the typical planar device structure and how the key technology parameters change
according to Dennard‟s scaling law (κ is the scaling factor).
1/κ
κ
1/κ
1/κ
1/κ
1/κ
1/κ
2
Device dimensions t
OX
, L, W
Substrate doping N
sub
Voltage V
Current I
Capacitance C
ox
Delay per gate VC/I
Power dissipation per circuit
Scaling Factor
Scaling Factor
Device Parameter
Device Parameter
1/κ
κ
1/κ
1/κ
1/κ
1/κ
1/κ
2
Device dimensions t
OX
, L, W
Substrate doping N
sub
Voltage V
Current I
Capacitance C
ox
Delay per gate VC/I
Power dissipation per circuit
Scaling Factor
Scaling Factor
Device Parameter
Device Parameter
1/κ
κ
1/κ
1/κ
1/κ
1/κ
1/κ
2
Device dimensions t
OX
, L, W
Substrate doping N
sub
Voltage V
Current I
Capacitance C
ox
Delay per gate VC/I
Power dissipation per circuit
Scaling Factor
Scaling Factor
Device Parameter
Device Parameter
1/κ
κ
1/κ
1/κ
1/κ
1/κ
1/κ
2
Device dimensions t
OX
, L, W
Substrate doping N
sub
Voltage V
Current I
Capacitance C
ox
Delay per gate VC/I
Power dissipation per circuit
Scaling Factor
Scaling Factor
Device Parameter
Device Parameter
Fig. 1-1: Conventional planar MOSFET structure and constant field scaling theory
Moore and Dennard‟s theory set the technology on a course of regular developing
pace, providing consistent improvements in transistor density, performance and power.
2
Each new generation of technology was expected to reduce minimum feature size by
approximately 0.7x, which translates to a density improvement of 2x in every two years.
To sustain the pace of scaling, numerous new technology and techniques has been
developed and deployed overcoming the challenges of ever smaller device feature.
Pocket and HALO implant, graded channel doping, and shallow junction, are but just a
few of such examples. However, Moore himself has also noted, “no exponential is
forever” [6]. Back in year 1998, the International Technology Roadmap for
Semiconductor (ITRS) [7] has already identified that a new MOS transistor approach,
departing from classical scaling and introducing new materials and properties, was
necessary to continue to double the transistor density in every two years. For this purpose,
silicide materials were used to reduce the series resistance in shallow junction devices.
Strained silicon was adopted as a means of enhancing mobility without reducing doping.
Subsequently, high-κ material based on hafnium and dual metal gate were also
introduced, reducing gate leakage current and equivalent SiO
2
dielectric thickness at the
same time without scaling down the physical thickness of the gate dielectric.
Looking forward, although the basic material for a MOSFET – silicon and Si based
compound material and silicides – are expected to lead commercialization of
nanotechnology for the next two decades [2][8][9], there‟s no doubt that scaling will be
more challenging towards the end of the roadmap. The major ones of these challenges
include controlling leakage currents and short-channel effects (SCEs), and maintaining
control of device parameters such as threshold voltage despite the increasing variability
in nanoscale.
3
1.1.1 Increasing dielectric field and short channel effects
In order to boost the device performance, the gate dielectric thickness has been scaled
more aggressively than the supply voltage, especially for the submicron technology nodes.
For the past 20 years, the power supply only changes from 5 V for 1 µm technology to
~1.5V for the 0.1 nm technology generation. On the other hand, the gate oxide thickness
has been scaled down from 200 Ǻ to less than 20 Ǻ (a few atomic layers thick) below
which significant tunneling takes place. A direct result of this non-proportional scaling is
that the oxide field has continually increased from 1 MV/cm to 5 MV/cm during the last
decades, as shown in Fig. 1-2. There are two obvious advantage of increasing oxide filed:
(1) Neglecting the mobility degradation caused by higher field, the channel
resistance is reduces by approximately the inverse of the field as in
()
eff eff
CHL
eff ox gs TH eff si ox
LL
R
W C V V W E
(1-1)
(2) Increasing oxide field improves the SCE by giving the gate better control of
the channel potential, enabling more rapid scaling of the channel length.
Fig. 1-2: Oxide field plotted against technology generations [10].
4
The minimum MOSFET channel length is ultimately set by the gate dielectric
thickness relative the Si depletion width. As shown by Frank et al. [11], based on the 2D
electrostatic and matching the boundary conditions of electric fields, a scale length λ can
be derived as follows:
tan( / ) tan( / ) 0
si i i si
tt
(1-2)
where t
si
is the depth of depletion region in silicon and t
i
is the thickness of the insulator.
It was a shown that in the extreme limit,
( / )/
i i si si
tt
, dominated by the physical
thickness of the gate insulator. Therefore, there‟s a scaling limit set by the acceptable
SCE for planar transistors even with high-κ gate insulators: the minimum useful channel
length is about 1.5-2 times λ [12]. Empirically, it has been observed that for V
TH
and
Drain-induced-barrier-lowering (DIBL) to be contained, the minimum lateral distance
from source to drain is approximately 40 times the oxide thickness [13].
1.1.2 Leakage currents
Aggressive gate dielectric thickness reduction causes higher gate leakage current. The
minimum SiO
2
thickness is approximately 1.2 nm, or three to four atomic layers,
resulting in a tunneling current of ~ 100 A/cm
2
[14]. On the other hand, scaling of channel
length and/or threshold voltage increases the subthreshold drain leakage due to DIBL. In
some advanced technologies, the subthreshold leakage has become so high as to consume
nearly quarter of the total power dissipated as shown in Fig. 1-3. Ultimately, the off-state
leakage, due to the combination of gate and subthreshold leakage currents, will limit the
smallest dielectric thickness and in turn the practical MOSFET channel length for planar
MOSFETs.
5
Fig. 1-3: Subthreshold leakage power plotted against year [13].
1.1.3 Variability
As the device dimension scales into the submicron regime, the statistical variation of
channel dopant number become more significant due to the smaller dopant population
[15]. Increasing V
TH
shift was found to have detrimental effects in matching and device
optimization [16]. On top of that, as the complexity of device increases and dimension
decreases further, the variability in critical dimensions of the device will become
increasingly significant [17][18]. Process induced variability due to uncertainties in
lithography, etching and deposition will contribute to even greater dispersion of device
parameters [18] as seen in some experimental nanowire devices [19].
1.2 Next Generation MOSFET Devices
Addressing the three issues associated with scaling of the previous section without
degradation of the device performance is not at all straightforward because of the trade-
offs among three main indexes of MOSFWT performance: the on-current I
ON
, the power
consumption P
consum
and the SCEs. Schematic of such trade-off relationship is illustrated
in Fig. 1-4. For low-power device application specifically, lower V
DD
, higher threshold
6
voltage V
th
, higher substrate doping N
Sub
and higher electrical oxide thickness (EOT) is
needed to reduce leakage current and stand-by power. However, all these are known to
reduce I
ON
substantially and also hold inconsistency themselves. Increasing oxide
thickness T
OX
, which is needed for reducing leakage current, increases sub-threshold
swing (SS) for intrinsic gate capacitance C
g
. And increasing N
Sub
, which is necessary for
suppressing SCE in bulk MOSFETs causes increase in leakage current on the account of
junction tunneling current and GIDL. What‟s more, increasing N
Sub
also leads to
degradation in mobility, reducing the I
ON
even further.
I
on
SCE
P
consum
V
DD
V
th
T
ox
X
j
N
Sub
N
Sub
T
ox
I
on
SCE
P
consum
V
DD
V
th
T
ox
X
j
N
Sub
N
Sub
T
ox
Fig. 1-4: The trade-off relationships among the three main indexes of performance: current drive I
ON
, the
SCE, and the power consumption P
consum
. Listed along the arrows are the process/device parameters related
to the three indexes.
The industrial and academic communities are pursuing two avenues to meet these
challenges, namely, new materials and new transistor structures. New materials includes
high-κ and metal gate for gate stack, channel material for enhanced mobility such as Ge
and GaAs, as well as modified source/drain junction for improved resistance and carrier
injection velocity. On the other hand, new Ultra-Thin-Body (UTB) transistor structures
7
such as fully-depleted SOI FETs, nanowire (NW) FETs, carbon nanotube devices, and
FinFETs, seek to improve the electrostatics of the MOSFETs, while providing a platform
for integration of new materials for further performance enhancement at the same time.
They are therefore widely regarded as the forerunners for scaling MOSFET devices
towards the end of the roadmap.
Si Substrate
BOX
Source
Gate
Drain
Lg
Tox
Si Substrate
BOX
Source
Gate
Drain
Lg
Tox
Si Substrate
BOX
Source
Gate
Drain
Lg
Tox
Si Substrate
BOX
Source
Gate
Drain
Lg
Tox
(a)
(b)
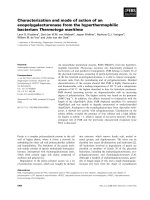
Fig. 1-5: Device structure illustrated for (a) – the tri-gate FinFET (b) – the nanowire FET
Two examples of the next generation device structures, the FinFET and the NW FET
are shown in the schematics of Fig. 1-5. They both consists of a thin body in the shape of
fin or wire with attached source and drain region for contact. The device was naturally
isolated due to the SOI structure. The gate runs over the body forming a conducting
channel. The gate width depends on the height and width of the fin in the case of FinFET;
and on the circumference of the wire in the case of nanowire.
The key device concept behind most UTB device structures is improved SEC due to
its fully-depleted nature and/or multiple gate structure. Better gate control results in
nearly ideal subthreshold swing and reduced off-state current which in turn relaxed the
requirement for N
sub
in scaling. Power consumption can also be better optimized due to
its much improved on and off current ratio. Therefore, technically the new UTB device
structures, especially those with multiple and surround gate, have more potential in