The effects of additional nonmagnetic layers on structure and magnetic properties of l10 fept thin films
Bạn đang xem bản rút gọn của tài liệu. Xem và tải ngay bản đầy đủ của tài liệu tại đây (2.98 MB, 159 trang )
THE EFFECTS OF ADDITIONAL NONMAGNETIC
LAYERS ON STRUCTURE AND MAGNETIC
PROPERTIES OF L1
0
FePt THIN FILMS
ZHAO ZELIANG
(B. Eng., HUNAN UNIVERSITY)
(MSc., INSTITUTE OF MATELS RESEARCH, CHINESE ACADEMY
OF SCIENCES)
A THESIS SUBMITTED
FOR THE DEGREE OF DOCTOR OF PHILOSOPHY
DEPARTMENT OF MATERIAS SCIENCE,
NATIONAL UNIVERSITY OF SINGAPORE
2007
Acknowledgements
I would like to express my heartfelt thanks to my supervisors, Prof. Jun Ding,
Prof. Jianping Wang, and Dr. Jingsheng Chen, for their guidance, inspiration, and
encouragement throughout the course of my research. I am grateful for both their
expertise and their commitment to their students.
My thanks also go to Dr Liu Bo, Mr Yi Jiabao, Mr Liu Binghai, Mr. Lim Boon
Chow, Dr Zhou Tiejun, Dr Zhang Jun, Dr Sun Chengjun, Mr Han Yufei, Mr Ren
Hanbiao, Mr Hu Jiangfeng, Mr Guan Tianpeng and other staff and students in Data
storage institute and National University of Singapore, all of whom were extremely
helpful with their assistance and friendship.
I also had invaluable help from Dr K. Inaba (Rigaku Co, Japan), Prof. Li Yi
(NUS), Prof. Dong Zhili (NTU), and Prof Liu Yinong (University of Western
Australia) for in-plane XRD, arc-melting, TEM, and SQUID experiments,
respectively.
I would like to thank National university of Singapore and Data storage
institute for the financial support and supplying me with an excellent research
environment.
Last, but not least, I am especially grateful to my wife Wang Xiaochong and
my family for their encouragement, care, and support.
I
Table of contents
ACKNOWLEDGEMENTS I
TABLE OF CONTENTS VII
SUMMARY VII
LIST OF PUBLICATIONS IX
LIST OF TABLES X
LIST OF FIGURES XI
LIST OF SYMBOLS XV
LIST OF ABBREVIATIONS XVII
CHAPTER 1 INTRODUCTION
1.1 History of magnetic recording 1
1.2 Limitation of LMR media 3
1.3 Media requirements for high areal density magnetic recording 4
1.3.1 Signal to noise ratio (SNR) 5
1.3.2 Thermal stability 6
1.4 Perpendicular recording media (PMR) 6
1.4.1 Advantages of PMR 8
1.4.2 Media for PMR 9
1.5 General properties of FePt alloys 10
1.5.1 Crystallographic Structure of the FePt phases 11
1.5.2 Magnetic properties of the ordered phase FePt 14
1.6 Disordered/ordered phase transformation 15
1.6.1 Bulk FePt Alloy 16
II
1.6.2 FePt nanoparticles 16
1.6.3 FePt Thin Films 17
1.6.3.1 Doping of additive elements 18
1.6.3.2 Strain induced phase transformation 20
1.6.3.3 Injecting energy by ion irradiation 22
CHAPTER 2 RESEARCH FOCUSES AND OBJECTIVES
2.1 Research focuses 23
2.2 Research objectives 24
2.2.1 Effects of thickness and temperature 24
2.2.2 Effects of top layer 25
2.2.3 Effects of intermediate layer 25
2.3 Organization of the thesis 26
CHAPTER 3 EXPERIMENTAL METHODOLOGY
3.1 Sputtering method 28
3.2 Microstructure and phase analysis 31
3.2.1 X-ray diffraction 31
3.2.2 X-ray photoelectron spectroscopy 33
3.2.3 Transmission electron microscopy 34
3.2.4 Atomic force microscope (AFM) 35
3.3 Magnetic properties 35
3.3.1 Vibrating sample magnetometer 35
3.3.2 Alternating gradient force magnetometer 37
3.3.3 SQUID magnetometer 38
3.4 Magnetization reversal mechanisms 38
3.5 Magnetization reversal mechanisms 39
III
3.4.1 Non-interaction Model: Stoner-Wohlfarth mode 40
3.4.2 Interaction model 42
3.4.3 Nucleation and domain wall pinning 46
CHAPTER 4 DEPENDENCE OF MAGNETIC PROPERTIES OF FEPT
FILMS ON FILM THICKNESS AND DEPOSITION TEMPERATURE
4.1 Experiment methodology 50
4.2 Results and discussion 51
4.3 Summary 57
CHAPTER 5 EFFECTS OF TOP LAYER ON FEPT THIN FILMS WITH
GLASS SUBSTRATES
5.1 Experiment methodology 58
5.2 Results and discussion 60
5.2.1 M-H curves 60
5.2.2 XRD analysis 62
5.2.3 X-ray reflectivity (XRR) 64
5.2.4 TEM microstructures 67
5.2.5 HRTEM microstructures 68
5.2.6 Interaction behaviors in FePt thin films 70
5.2.7 Effect of Ag top layer on FePt film with different thickness and different deposition
temperature
71
5.2.8 Effect of the deposition temperature of Ag top layer 74
5.2.9 Alloys by arc melting a study of solubility of Ag in FePt alloy 76
5.3 Summary 78
CHAPTER 6 COMPARISON OF UNDERLAYER, INTERMEDIATE, AND
TOP LAYERS
6.1 Experiment methodology 79
IV
6.2 Results and discussion 80
6.2.1 Crystallographic properties 80
6.2.2 Magnetic properties 82
6.2.3 Magnetic interactions 83
6.3 Summary 86
CHAPTER 7 EFFECTS OF INTERMEDIATE LAYERS ON FEPT FILMS
WITH PERPENDICULAR ORIENTATION
7.1 Experimental methodology 87
7.2 Results and discussion 88
7.2.1 CrRu as an orientation layer 88
7.2.2 Ag as intermediate layers 91
7.2.3 A study on pinning effects 93
7.2.4 Different elements as the intermediate layer 98
7.3 Summary 101
CHAPTER 8 EFFECTS OF INTERMEDIATE LAYERS ON FEPT FILMS
WITH MGO SUBSTRATES
8.1 Introduction 102
8.2 Experimental methodology 104
8.3 Results 106
8.3.1 XRD analysis 106
8.3.2 Plane view TEM microstructure 109
8.3.3 Magnetic properties 113
8.4 Magnetization reversal mechanism 116
8.5 Summary 124
CONCLUSIONS 125
V
FUTURE WORK 127
1. Problem statements and objectives 127
2. Proposed experiments and anticipated results 128
REFERENCES 130
VI
Summary
An increase in the recording areal density requires the reduction of the size of
the actual bits on the disk surface. However, the further reduction in the bit size may
be limited by the superparamagnetism. Magnetic thin films with high magnetic
anisotropy are necessary to overcome the superparamagnetic limit, when the magnetic
recording areal density further increases. The L1
0
ordered phase iron-platinum (FePt)
with a large magnetic anisotropy of 7.0×10
7
erg/cm
3
has received a great attention
because of its potential application as perpendicular recording media with an
ultra-high recording density.
However, the magnetic performance (coercivity and remanence) is often
limited by the presence of the soft magnetic phase, fcc-FePt, which is frequently
found in the as-deposited FePt films. The formation of the hard-magnetic L1
0
FePt
fct-phase usually requires a relatively high deposition or annealing temperature over
600 °C for pure FePt. Since high fabrication temperature over 400
o
C is not
compatible with industrial process, it is important to develop methods to fabricate L1
0
FePt film which can be formed at a relatively low deposition or annealing temperature.
The aim of this study was to reduce the phase transformation temperature of FePt thin
films from disordered fcc to ordered L1
0
phase. A systematic investigation on Ag top
layers, intermediate layers and underlayer on the phase transformation of the FePt thin
films was conducted. The relationships between the microstructure, the disordered/
ordered phase transformation, and magnetic properties of the FePt films were studied.
VII
With an Ag underlayer deposited at the bottom of the FePt layer, both the
in-plane and out-of-plane coercivities of FePt film slightly increased comparing to the
FePt film without underlayer. The main contribution of the underlayer was to improve
the crystallinity of the FePt films. As a result, the coercivities in both direction of the
FePt thin film were slightly increased.
Ag top and intermediate layers with different thicknesses were deposited on the
top and between of FePt layers. The coercivity of FePt films increased significantly to
about 6 kOe. The structural study suggested that Ag diffused into the FePt layer. The
diffusion of Ag
from the top of the films promoted the phase transformation of FePt. At
the same time the intergranular exchange coupling in the FePt films was reduced,
which resulted in the increase of the coercivity.
The formation temperature of the hard-magnetic L1
0
phase was significantly
reduced when FePt films were deposited on the MgO substrate. However, relatively
low coercivity of about 6 kOe was resulted without the insertion of additive layers.
With ultrathin Ag intermediate layers deposited between FePt layers, the topography
of the films changed from a continuous maze-like structure to an isolated island
structure. The formation of the island structure may realize the decoupling between
FePt particles and cause the change of magnetization reversal mechanism from
domain wall pinning to coherent rotation. As a result, the out-of-plane coercivity of
the FePt films increased to over 30 kOe.
VIII
List of publications
1. Z. L. Zhao, J. Ding, Y. Li, G. M. Chow, J. S. Chen, and J. P. Wang,
“Microstructure studies of L1
0
- FePt thin films with high coercivity fabricated
at low deposition temperatures”, Metallurgical and Materials Transactions A.
38A 811 (2007).
2. Z. L. Zhao, J. S. Chen, J. Ding, B. H. Liu, J. B. Yi and J. P. Wang.
“Fabrication and Microstructure of High Coercivity FePt Thin Films at 400
o
C”, Applied Physics Letters. 88 052503 (2006).
3. Z. L. Zhao, J. S. Chen, J. Ding, J. B. Yi, B. H. Liu and J. P. Wang.
“Microstructure of high coercivity FePt thin films fabricated at 400
o
C”, IEEE
Transaction on Magnetics. 41 3337 (2005).
4. Z. L. Zhao, J. Ding, J. B. Yi, J. S. Chen, and J. P. Wang, “Nanostructured FePt
Thin Films with High Coercivity”, Journal of Materials Science and
Technology. 21 43 (2005).
5. Z. L. Zhao, J. Ding, J. B. Yi, J. S. Chen, J. H. Zeng, and J. P. Wang, “The
mechanism of Ag top layer on the coercivity enhancement of FePt thin films”,
Journal of Applied Physics. 97 10H502 (2005).
6. Z. L. Zhao, K. Inaba, Y. Ito, J. Ding, J. S. Chen, and J. P. Wang.
“Crystallographic ordering studies of the L1
0
phase transformation of FePt thin
film with Ag top layer”, Journal of Applied Physics. 95 7154 (2004).
7. Z. L. Zhao, J. Ding, J. S. Chen, and J. P. Wang. “The effects of pinning layers
on the magnetic properties of FePt perpendicular media”, Journal Magnetism
and Magnetic Materials. 272 2186 (2004).
8. Z. L. Zhao, J. S. Chen, J. Ding, and J. P. Wang. “The effects of additive Ag
layers on the L1
0
FePt phase transformation”, Journal Magnetism and
Magnetic Materials. 282 105 (2004).
9. Z. L. Zhao, J. Ding, J. S. Chen and J. P. Wang. “Coercivity Enhancement of
FePt Thin Films with Nonmagnetic Ru Pinning Layer”, Journal of Applied
Physics. 93 7753 (2003).
10. Z. L. Zhao, J. Ding, K. Inaba, J. S. Chen, and J. P. Wang. “Promotion of L1
0
ordered phase transformation by the Ag top layer on FePt thin films”, Applied
Physics Letters. 83 2196 (2003).
11. Z. L. Zhao, J. P. Wang, J. S. Chen, and J. Ding. “Control of Magnetization
Reversal Process with Pinning Layer in FePt Thin Films”, Applied Physics
Letters. 81 3612 (2002).
IX
List of tables
Table 1-I The intrinsic magnetic properties of a number of potential alternative
media alloys.
Table 5-I Layer structure and magnetic properties of FePt films with different
thicknesses of Ag top layers and different deposition conditions.
Table 5-II Layer structure and magnetic properties of FePt films with different
thicknesses of Ag top layers and different deposition conditions.
Table 5-III The 2θ values for the three FePt ingots while the XRD is measured at the
core parts of the ingots.
Table 6-I Layer structure and magnetic properties of FePt films with different
thicknesses of Ag intermediate layers and different deposition
conditions.
Table 7-I FePt film structures and coercivity values for FePt thin films with
different intermediate layer structures.
Table 8-I Layer structure of FePt films and coercivity values for FePt thin films
grown on corning glass and MgO substrates with different structures.
X
List of figures
Figure 1-1 Growth curve of areal density of magnetic recording media from 1956
to 2007.
Figure 1-2 Schematic representation of (a) LMR media and (b) perpendicular
recording media.
Figure 1-3 Phase diagram for bulk FePt alloy.
Figure 1-4 Schematic representation of the structures of fcc FePt (a) and L1
0
FePt
(b).
Figure 1-5 Illustration schematic for the epitaxial growth of FePt on MgO
substrate.
Figure 3-1 Schematic drawing of DC sputtering system.
Figure 3-2 Schematic drawing of X-ray diffraction.
Figure 3-3 Schematic illustration of VSM
Figure 3-4 Hysteresis curves of Stoner-Wohlfarth particle with different applied
field angles
θ
; the film is with an in-plane magnetization.
Figure 3-5 Dependence of normalized coercivity of Stoner-Wohlfarth particle
with the external applied field direction angle
θ.
Figure 3-6 Schematic explanation to measure the magnetization remanence M
r
and demagnetization remanence M
d
.
Figure 3-7 Illustration of typical DCD and IRM curves (a) and delta-M curve for
thin film media (b).
Figure 3-8 Schematic representation of delta-M curves with different coupling
regimes.
Figure 3-9 Schematic representation of domain, reversal domain, and
inhomogeneities in a domain.
Figure 3-10 Schematic illustration of domain wall motion (a) and nucleation
mechanism (b) domain reverse process.
Figure 3-11 Domain wall pinning energy distribution in relation to the reverse
domain nucleating energy distribution.
Figure 4-1 In-plane and out-of-plane coercivities for FePt thin films deposited at
400 °C with different thicknesses.
Figure 4-2 In-plane and out-of-plane hysteresis loops for FePt thin films with
thickness of 15 nm.
Figure 4-3 XRD patterns for FePt thin films with different thicknesses.
Figure 4-4 XRD patterns for FePt thin films with a thickness of 120 nm. Almost
all the characteristic peaks of ordered FePt phase are present in the
XI
curve.
Figure 4-5 Temperature dependence of in-plane and out-of-plane coercivities for
15 nm FePt thin films with deposition temperature variation from 300
to 400 °C.
Figure 4-6 Temperature dependence of in-plane and out-of-plane coercivities for
40 nm FePt films with deposition temperature variation from 250 to
400 °C.
Figure 4-7 Thickness dependence of in-plane and out-of-plane coercivities for 80
nm FePt thin films with deposition temperature variation from 250 to
400 °C.
Figure 5-1 Schematic representation of FePt films with Structures Ag top layer of
0, 0.25, 1, and 4 nm.
Figure 5-2 Magnetic hysteresis curves for the FePt thin films (a) without Ag top
layer; with a thickness of (b) 0.25 nm, (c) 1 nm, and (d) 4 nm Ag top
layers under a maximum applied field of 15 kOe.
Figure 5-3 (a) In-plane crystallographic XRD patterns of FePt thin films with Ag
top layers of different thicknesses. (b) Enlarged view of the XRD
patterns with 2θ range from 36-50 degree in (a).
Figure 5-4 (a) Schematic illustration of X-ray reflectivity; (b) the profile of the
XRR; the parameters that can be derived from the spectra are noted in
the figure.
Figure 5-5 The X-Ray reflectivity patterns for FePt thin films without Ag top layer
and with 0.25 nm and 1 nm Ag top layers
Figure 5-6 TEM images and SAED patterns of the FePt films without Ag top layer
(a and c) and with 1 nm Ag top layer (b and d).
Figure 5-7 HRTEM images of the FePt film without Ag top layer (a) and with 1
nm Ag top layer (b). The lattice planes with a d-spacing of 2.1 Å is
FePt (111); 2.3 Å is Ag (111); and the 3.7 Å is the superlattice L1
0
FePt
(001).
Figure 5-8 Variation of
δ
M as a function of the thickness of Ag top layer with the
external field applied in the film plane direction.
Figure 5-9 (a) XRD patterns of FePt thin films of Sample E, F, G, H, and I. (b) the
enlarged view of in-plane XRD patterns of Sample G and Sample E at
the 2θ range of 20-36 degree.
Figure 5-10 The Pt-4f (a) and Ag-3d (b) X-ray photoelectron spectra of the samples
with Ag top layer deposited at high temperature (Sample G) and room
temperature (Sample I).
Figure 5-11 XRD patterns for FePt, FePt-Ag, and FePt-Cu ingots obtained from arc
melting. In the XRD scan of FePt-5Ag, diffraction peaks of Ag are
XII
presented; while for FePt-5Cu alloy, diffraction peaks of FePtCu solid
solution are presented in the scan.
Figure 6-1 Schematic representation of FePt films with Ag underlayer,
intermediate layers and top layer.
Figure 6-2 In-plane XRD patterns of FePt thin films with different types of Ag
layers.
Figure 6-3 Variation of
δ
M with different Ag additive layers with the external field
applied in the film plane direction.
Figure 7-1 Schematic illustration of the layer structures of the FePt films with
perpendicular orientation.
Figure 7-2 Schematic representation for the epitaxial growth of FePt on bcc-Cr
substrate.
Figure 7-3 XRD
θ
-2
θ
spectra for the films with 0, 0.25, 0.5, and 1 nm Ag
intermediate layer.
Figure 7-4 Out-of-plane hysteresis curves for FePt films with and without 0.25 nm
Ag intermediate layer.
Figure 7-5 Angular dependence of coercivity for the FePt films with Ag
intermediate layers of different thicknesses. Zero field refers to film
normal direction.
Figure 7-6 MFM images of FePt films: (a) Sample A film without Ag layer and (b)
Sample B film with 0.25 nm Ag intermediate layer. Both of the scalar
bars are 3µm×3µm.
Figure 7-7 Normalized magnetization vs. inverse field for FePt films with
different structures. The approach to saturation field ranges from 9 kOe
to 15 kOe.
Figure 7-8 Variation of out-of-plane coercivity for the FePt films with Ru, Pt, and
Ag intermediate layers of different thicknesses。
Figure 8-1 Schematic representation of FePt films with Structures I, II, III, and IV.
The total nominal thickness of the FePt layers for each sample was 15
nm.
Figure 8-2
θ
-2
θ
XRD patterns of the FePt films with and without Ag intermediate
layers on a) corning glass and b) MgO (100) single crystal substrates.
Figure 8-3 Rocking curves of the FePt fct (001) peak of FePt thin films with and
without Ag intermediate layers.
Figure 8-4 Plane view TEM images of FePt thin films with (a) Structure I and (b)
Structure III and (c) EDX profile
Figure 8-5 SAED pattern of FePt thin film with intermediate layers.
XIII
Figure 8-6 (a) HRTEM image of the FePt film with Structure III. (b) the
reconstruction image using the FFT filtering technique of the
corresponding image. The dislocations are marked with circles.
Figure 8-7 Magnetization curves for the two films measured by SQUID with
maximum applied field of 70 kOe. The red spots represent the
out-of-plane magnetization curves, and the blue spots represent the
in-plane magnetization curves. The solid line is drawn to guide the eye.
Figure 8-8 Variation of surface resistivity of FePt thin films on MgO single crystal
and glass substrate with different intermediate layers.
Figure 8-9 AFM images of FePt thin films; (a) FePt film of Structure I without Ag
intermediate layers; (b) FePt film of Structure III with Ag intermediate
layers.
Figure 8-10 AFM and MFM images of the FePt thin films with Ag intermediate
layers (a) and (b) and without Ag intermediate layers (c) and (d).
Figure 8-11 Initial magnetization curves for the FePt films with and without Ag
intermediate layers.
Figure A Representive schematic of the layer structure of future FePt PMR
media.
XIV
List of symbols
1. A - exchange energy density
2. AFC - antiferromagnetically coupled media
3. BV - bit volume
4. d - the interplanar spacing of the diffracting plane
5. D - average grain size
6. H - applied external field
7. H
c
-coercivity
8. H
k
- anisotropy field
9. J - the exchange integral
10. K
1
- the first order anisotropy
11. K
B
- the Boltzmann constant
12. K
u
- anisotropy constant
13. L1
0
- ordered phase with AuCu intermetallic structure
14. M
s
- saturation magnetization
15. T - temperature in degrees Celsius
16. T
c
- Curie temperature
17. V - magnetic switching volume
18.
σ
- grain size distribution
19.
µ
-the spin quantum number
20. λ- the wavelength
21.
δ
- domain wall thickness
XV
22. λ- the wavelength
23.
γ
- domain wall energy
24.
τ
- relaxation time
25. θ - the angle of the incidence and of the diffraction of the radiation relative to
the reflecting plane
XVI
List of abbreviations
1. AFM - atomic force microscopy
2. AGFM - alternating gradient force magnetometer
3. AXS - anomalous x-ray scattering
4. BF - bright field
5. DC - direct current
6. DCD - direct current demagnetization
7. DF - dark field
8. DSI - Data Storage Institute
9. FFT - fast Fourier transform
10. FWHM - full width at half maximum
11. HAMR - heat assisted magnetic recording
12. HRTEM - high resolution transmission electron microscopy
13. hcp - hexagonal close-packed
14. LMR - longitudinal magnetic recording
15. LRO - long-range order
16. MFM - magnetic force microscopy
17. fcc - face center cubic
18. fct - face center tetragonal
19. IRM – isothermal remanence
20. MBE – molecular beam epitaxy
21. PMR - perpendicular magnetic recording
XVII
22. RF - radio frequency
23. SAED - selected area electronic diffraction
26. SNR - signal-to-noise ratio
24. SRO - short range order
25. SQUID – superconducting quantum interference device
26. TEM - transmission electron microscopy
27. UHV - ultrahigh vacuum
28. VSM - vibrating sample magnetometer
29. XPS - X-ray photoelectron spectroscopy
30. XRD - X-ray diffraction
XVIII
Chapter 1 Introduction
A data storage device is to be used for recording (storing) information (data).
The storage device may hold information and process information. Today, one of
most important data storage devices is hard disc drive. In a hard disk drive, the
information is stored in magnetic bits (magnetic domains) of the ferromagnetic
granular film.
1
There are two different techniques of magnetic recording - namely
longitudinal magnetic recording (LMR) and perpendicular magnetic recording (PMR).
In a longitudinal magnetic recording medium, the magnetic domains (bits) are written
parallel to film plane and the magnetic film is usually required to possess a
longitudinal magnetic anisotropy. On the other hand, a perpendicular magnetic
anisotropy is necessary for a perpendicular magnetic medium, as their magnetic bits
are written in the perpendicular direction. The current trend in the hard disk industry
is to replace longitudinal magnetic recording by perpendicular magnetic recording, as
the perpendicular magnetic recording has a much higher potential in recording
density.
1.1 History of magnetic recording
The magnetic hard disk drive featuring a total storage capability of 5 Mbit at a
recording density of 2 Kbit/in
2
was invented at IBM in 1956.
1
Since then, the areal
density has frequently been quoted as a key measurement of the remarkable progress
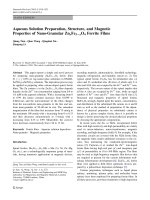
being made in magnetic recording technology. Figure 1-1 shows the growth trend of
the areal density from the invention of hard disk drive in 1956. Throughout the 1970s
1
1956 1966 1976 1986 1996 2006
1E-6
1E-5
1E-4
1E-3
0.01
0.1
1
10
100
1000
Perpendicular
Available Density (Gbit/in
2
)
Available Year
Demo: Longitudinal
Demo: Perpendicular
Mass Products
Longitudinal
Figure 1-1. Areal density growth curve of magnetic recording media from
1956. Solid circle – mass products trend; down-triangle – demonstration of
LMR; upper-triangle – demonstration of PMR; Growth in areal density has
accelerated in the past decade. Earlier, density doubled every three years or
so; with the introduction of magnetoresistive read heads (MR) in 1991 the
doubling time was reduced to two years; since the giant magnetoresistive head
(GMR) reached the market in 1997, density has been doubling each year.
Before 2001, all of the mass products and most of the lab demonstration is
LMR. From 2001, PMR is demonstated to achieve high areal density (Adapted
of B. Hayes, 2002, Ref. 1).
to 1980s, the bit density increased at a growth rate of about 25 percent per year, which
corresponds to a doubling time of roughly three years.
2
With the using of the
magnetoresistive (MR) head, the annual growth rate jumped to about 60 percent,
which is corresponding to a doubling time of 18 months Furthermore, the growth rate
increased to 100% with the utilization of giant magnetoresistive (GMR) head,
corresponding to a doubling time of one year after 1997.
3-5
However, the rate of growth has slowed significantly to around 50-60 % every
year after 2002. The key limiting factors in achieving high growth rate of areal density
2
are the superparamagnetic effect in the LMR media.
6-7
When the recording areal
density increases, the size of the recording bit decreases and the thermal stability of
the magnetic bits decreases. To keep the recording media readable, a minimal signal
to noise ratio, SNR, should be remained. Since the SNR is approximately proportional
to the number of grains per bit, the grains must be reduced to achieve considerable
SNR with increasing of the areal density.
8
1.2 Limitation of LMR media
From the invention of magnetic recording in 1956, longitudinal recording is
widely used to store data. In LMR media, the easy axis is randomly oriented in the
plane of the film. To achieve a higher areal density, small grains are required and the
minimum bit length is determined by the transition width, which in turn depends on
the grain size of the film. Usually the grains are weakly exchange coupled to each
other. For strongly exchange coupled grains, the magnetization in neighboring grains
aligns parallel, and effectively larger clusters are formed.
9
Thus, a stronger exchange
coupling leads to the increase of the effective magnetic cluster size. As a consequence,
transition width would be increased. In addition, thermal stability is diminished by the
strong demagnetizing field that opposes the magnetization. At low recording density,
when the bit length is much larger than the film thickness, the demagnetizing field is
small. However, at high areal density, where the bit length becomes smaller than the
film thickness, the magnetic charges inherent to LMR are pushed together, and high
demagnetizing fields occur. For this limitation, hard disk technology with LMR has
an estimated limit of around 100 Gbit/in
2
. A decrease of the demagnetization field in
3
LMR was achieved by antiferromagnetically coupled media (AFC) with extended
recording density to 170 Gbits/in
2
.
10
In contrast to traditional media, AFC media
consist of two ferromagnetic layers that are antiferromagnetically coupled. The
opposite direction of the two layers is achieved by an ultra-thin ruthenium (Ru) layer,
better known as “pixie dust.”
10
The opposite orientation of the magnetization
decreases the demagnetizing field. However, with further increase the areal density,
the superparamagnetism bottleneck will be reached again and new concepts are
required for future magnetic recording media.
1.3 Media requirements for high areal density
magnetic recording
Exponential growth in areal density cannot continue forever due to the
superparamagnetic limit. The underlying problem is that “permanent magnetism” is
not truly permanent; thermal fluctuations can swap the north and south poles. For a
macroscopic permanent magnet, such a spontaneous reversal is extremely improbable.
But when the bit gets small enough that the magnetic anisotropy energy is comparable
to the thermal energy of the bit, the stored information will be quickly lost, termed as
superparamagnetism. This is a technical challenge how to reduce the bit size and to
avoid superparamagnetism at the same time. The requirements for ultrahigh areal
density magnetic recording are reviewed in this section.
4
1.3.1 Signal to noise ratio (SNR)
To achieve magnetic recording with high areal density, it is necessary to use a
magnetic recording configuration to write the data and a signal processing system
capable to read the data. Therefore, the ratio of single-pulse peak over integrated
transition noise power,
11
defined as signal to noise ratio SNR, is an important
parameter in magnetic recording. The higher the SNR, the easier data detection
becomes. Magnetic recording media are required to provide a high SNR and remain
thermally stable over a long period of time.
The SNR is proportional to the read
track-width and the square of the bit length.
11
By grain-counting argument,
12
it is
approximately determined by the number of magnetic grains (or switching units) per
bit:
g
V
BV
SNR ∝
(1.1)
BV: the bit volume;
V
g
: the grain volume.
Equation (1.1) indicates that a large number of grains in a bit can result in a
high value of SNR. Therefore, small grain size is required in recording media with
high areal density.
In addition, the SNR depends not only on the average grain size D, but also on
the distribution of grain size. Increasing of the range of distribution decreases the SNR.
If grains are not uniform, the big magnetic clusters may cause big zigzag regions
between two recording bits and result in a large transition noise. As a result, uniform
grains could enhance SNR.
5
1.3.2 Thermal stability
Decreasing grain size could result in thermal instability of the recording media.
In order to prevent thermal instability, a minimum factor K
u
V/K
B
T> 60, is required for
a data storage time of 10 years,
13, 14
where K
u
and V are the anisotropy energy density
and grain volume, respectively. The magnetic relaxation time
τ
is an exponential
function of the grain volume:
15
⎟
⎟
⎠
⎞
⎜
⎜
⎝
⎛
=
−
Tk
VK
B
u
exp10
9
τ
(1.2)
τ
: relaxation time;
K
u
: anisotropy constant;
V: magnetic switching volume;
K
B
: the Boltzmann constant;
T: is the temperature in degrees Kelvin.
The volume V of a magnetic grain typically decreases with increasing areal
density; hence, materials with higher K
u
are needed to maintain the sufficient stability.
The grain size cannot be infinitely decreased because thermal instability due to the
critical grain size of superparamagnetism. As a result, the limitation of magnetic
recording is determined by the decay of SNR due to thermally induced magnetization
fluctuation. To meet the requirement of ultrahigh areal density recording media, some
new concepts of magnetic recording are proposed to maintain high SNR ration and
keep high thermal stability.
1.4 Perpendicular recording media (PMR)
Although antiferromagnetically coupled AFC magnetic recording has
significantly pushed forward the area density of LMR to around 170 Gb/in
2
, LMR
could not go further because of the inevitable superparamagnetism phenomena. In
6