Tài liệu A PRELIMINARY ANALYSIS OF THE EFFECTS OF HR 2454 ON U.S. AGRICULTURE doc
Bạn đang xem bản rút gọn của tài liệu. Xem và tải ngay bản đầy đủ của tài liệu tại đây (65.47 KB, 13 trang )
A PRELIMINARY ANALYSIS OF THE EFFECTS OF HR 2454 ON U.S. AGRICULTURE
Office of the Chief Economist
U.S. Department of Agriculture
July 22, 2009
Executive Summary
USDA performed a preliminary economic analysis of the impacts of House-passed climate
legislation, HR 2454, on U.S. agriculture. The analysis assumes no technological change, no
alteration of inputs in agriculture, and no increase in demand for bio-energy as a result of higher
energy prices. Therefore, it overestimates the impact of the climate legislation on agriculture
costs in the short (2012-18), medium (2027-2033), and long-term (2042 to 2048). In USDA’s
analysis, short-term costs remain low in part because of provisions in HR 2454 that reduce the
impacts of the bill on fertilizer costs. In fact, the impact on net farm income is less than a 1%
decrease. In the short run, agricultural offset markets may cover these costs. Over the medium-
term and long-term, costs to agriculture rise but remain modest (3.5% and 7.2% decreases in net
farm income, respectively). However, benefits to agriculture from an offsets market rise over
time and will likely overtake costs in the medium and long term. Other studies that account for
the impact of higher energy prices on input substitution and demand for bio-energy find that
HR2454 leads to higher agricultural incomes, even without offsets. In summary, USDA’s
analysis shows that the agricultural sector will have modest costs in the short-term and net
benefits – perhaps significant net benefits – over the long-term.
Overview
This analysis examines the potential effects on US agriculture of the cap-and-trade program that
would be implemented under HR 2454, the American Clean Energy and Security Act of 2009, as
reported by the House Committee on Energy and Commerce on May 21. The analysis is based
on the energy price effects estimated by EPA and published in their June 23 analysis of HR
2454. The effects of higher energy costs on agricultural supply, demand, prices and net farm
income are compared to the baseline values over 2012-18. We then examine the impacts of
energy price increases over the medium (2027-33) and long term (2042-48).
HR 2454 would also provide opportunities for farmers and ranchers to receive payments for
carbon offsets. While we include the gross revenues associated with offsets, this report does not
consider the potential effects of the offsets markets on commodity prices. The removal of
cropland and pastureland for afforestation would place upward pressure on crop prices,
benefitting producers of livestock feed but leading to higher livestock input costs and higher
producer prices for livestock and milk. We have not yet integrated these factors into our
estimates of changes in net farm income. In addition, our analysis does not assess the change in
farm income due to the Renewable Electricity Standard and other provisions in HR 2454 that
increase the demand for biomass and could provide additional sources of income for the
agricultural sector.
2
Agriculture and Energy Use
Agriculture is an energy intensive sector with row crop production particularly affected by
energy price increases.
1
Direct energy consumption in the agricultural sector includes use of
gasoline, diesel fuel, liquid petroleum, natural gas and electricity. Indirect energy use involves
agricultural inputs such as nitrogen and other fertilizers which have a significant energy
component associated with their production.
For 2009, USDA forecasts that direct fuel and electricity expenses for U.S. farms will be $15.3
billion and will account for 7.7 percent of total operating costs.
2
Expenses from indirect energy
use increase total energy expenditures to $39.3 billion, about 19.7 percent of operating costs.
Fertilizers embody the most energy among production inputs because natural gas is the primary
input (70-90 percent of cost of producing nitrogen fertilizer).
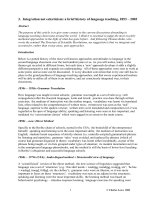
The potential impacts of higher energy costs on production costs are greatest for feed grains and
wheat producers where energy costs account for over 50 percent of total operating costs (figure
1).
3
Per-acre energy expenses for rice and cotton are generally higher than per acres expenses
for corn and wheat, but as a proportion of total operating costs, they are typically lower. Per acre
energy input costs are lowest for soybeans production, which account for 31 percent of total
operating costs over 2004-08.
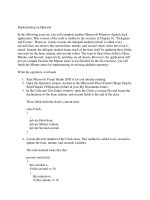
Energy costs vary regionally as well, In general, producers in regions more dependent on
irrigation tend to spend more on direct fuel expenditures such as natural gas or electricity (figure
2). Direct energy costs make up a small share of total operating costs on livestock operations,
comprising less than 10 percent of total operating costs for hogs, dairy and cow-calf operations.
However, these operations can experience higher energy costs indirectly through higher feed
production costs. Feed costs make up roughly 60 percent of total livestock production costs.
1
Shoemaker, Robbin, David McGranahan and William McBride. “Agriculture and Rural Communities are
Resilient to High Energy Costs”
Amber Waves. Volume 4, No. 2. USDA, Economic Research Service. Apr 2006.
Pp 18-21
2
USDA, Economic Research Service, Farm Income and Costs Briefing Room. Feb. 12, 2009. Available at
/>
3
Other operating costs include seed, chemicals, custom work, repairs. See
/>
3
Figure 1 Energy costs as a share of total
operating costs, 2005-08 average
0%
10%
20%
30%
40%
50%
60%
70%
Source: Economic Research Service
Figure 2 Wheat energy input costs by region,
2007-08
0% 20% 40% 60% 80%
United States
Northern Great Plains
Prarie Gateway
Basin and Range
Fruitful Rim
Northern Crescent
Heartland
Percent of Operating Costs
Fuel
Fertilizer
Source: Economic Research Service
4
Impacts of HR 2454 on Energy Prices
The EPA analysis of HR 2454, published on June 23, 2009, estimates that prices for petroleum,
electricity, and natural gas could rise above baseline levels by 4.0 percent, 12.7 percent, and 8.5
percent, respectively, by 2020 (table 1). As the limits on greenhouse gas (GHG) emissions
become more constraining over time, the impact on energy prices becomes more significant. By
2035, EPA estimates that prices for petroleum, electricity, and natural gas could rise above
baseline levels by 7.2 percent, 14.3 percent, and 16.9 percent, respectively. By 2050, EPA
estimates that petroleum prices could be almost 15 percent above baseline prices, while natural
gas and electricity prices could exceed baseline levels by over 30 percent.
Table 1—Estimated Impacts of HR 2454 on Energy Prices
2015 2020 2025 2030 2035 2040 2045 2050
$ per ton CO
2
e (2005 $)
Allowance price 12.64 16.31 20.78 26.54 33.92 43.37 55.27 70.40
Percent change from baseline
Electricity price 10.7 12.7 14.0 13.3 16.9 24.0 29.1 35.2
Natural gas price 7.4 8.5 8.6 10.4 14.3 18.9 24.1 30.9
Petroleum price 3.2 4.0 4.7 5.6 7.2 9.0 11.4 14.6
Source: EPA, June 23, 2009.
While most of the direct energy price increases would be felt immediately by the agricultural
sector, fertilizer costs would likely be unaffected until 2025 due to provisions in HR 2454 that
would distribute specific quantities of emissions allowances to “energy- intensive, trade exposed
entities” (EITE).
4
Nitrogenous fertilizer manufacturing is included on a list that EPA has
assembled of presumptively eligible EITE sectors. Additionally, EPA analysis indicates that the
allocation formula would provide enough allowances to cover the increased energy costs of all
presumptively eligible EITE industries. Based on these considerations, the USDA analysis
assumes HR 2454 imposes no uncompensated costs on nitrogen fertilizer manufacturers related
to increases in the price of natural gas through 2024. These allocations are terminated beginning
in 2025. This reflects an assumption that enough foreign countries have adopted similar GHG
controls to largely eliminate the cost advantage for foreign industries. These assumptions are
consistent with the treatment of EITE industries, including nitrogen fertilizer manufactures, in
the EPA analysis of HR 2454.
Assessing the Impacts of Higher Energy Prices on Agriculture
To estimate the impacts of rising energy prices on agriculture, this study uses the Food and
Agricultural Policy Simulator (FAPSIM). FAPSIM is an annual econometric model of the U.S.
4
Under Subtitle B of Title IV, “energy- intensive, trade exposed entities” (EITE) covers industrial sectors that have:
1) an energy or greenhouse gas intensity of at least 5% and a trade intensity of at least 15%; or 2) an energy or
greenhouse gas intensity of at least 20%. Without these allocations, firms in EITE industries would incur energy-
related costs that foreign competitors would avoid; hence, putting them at significant market disadvantage. The bill
sets a maximum amount of allowances that can be rebated to EITE industries at, 2% for 2012 and 2013, 15% in
2014, and then declining proportionate to the cap through 2025. Beginning in 2026, the amount of allowance rebates
will begin to be phased out and are expected to be eliminated by 2035. The phase-out may begin earlier or be
delayed based on Presidential determination.
5
crop and livestock sectors that includes cross-commodity linkages and dynamic effects over
time. Commodities included in FAPSIM are corn, sorghum, barley, oats, wheat, rice, upland
cotton, soybeans, cattle, hogs, broilers, turkeys, eggs and dairy. Each commodity submodel
contains equations to estimate equations to estimate production, prices and the different demand
components. The submodels are then linked together through common variables that are
important to the different commodities. The model solution computes the markets prices that
balance supply and demand in all commodity markets simultaneously.
FAPSIM is calibrated to the USDA February 2009 baseline which forecasts supply, demand and
price estimates to 2018. We then assess the role of higher energy prices over three time periods.
The short-term impacts assess the effects of energy price changes over 2012 to 2018, the
medium-term impacts assess the effects of energy price changes over 2027 to 2033, and the
longer-term impacts assess the effects of energy price changes over 2042 to 2048.
The estimated effects from the FAPSIM model do not take into account technological changes
that may occur because of higher energy prices or potential strategies producers may adapt to
reduce the use of energy inputs (beyond switching to crops with lower energy intensities) as the
prices for energy intensive inputs increase. In the short run, producers may take actions to
reduce energy use. For example, according to the 2006 Agricultural Resource Management
Survey (ARMS), 524,000 operators—representing about a quarter of all farmers—took some
action to reduce fuel or fertilizer expenses in 2006.
5
To reduce fuel expenses, the most common
practices were to regularly service engines and reduce the number of trips over a field. Cutting
back on the quantity of fertilizer applied was the most common practice employed to reduce
fertilizer expenses. Other actions included conducting soil tests (to determine an efficient mix of
fertilizer use) and negotiating price discounts.
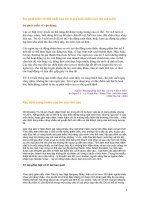
Over the long run, technological changes could help mitigate costs. For example, higher energy
costs in the 1970s prompted all sectors of the U.S. economy to increase energy efficiency.
Energy intensity—defined as energy consumption per unit of total output—has steadily declined
over time due to gains in energy efficiency in the agricultural sector (figure 3).
5
USDA, Economic Research Service. Agricultural Income and Finance Outlook. AIS-85. December 2007. pp
30-31.
6
Figure 3 Energy use per unit of total farm
output (1996 = 1)
0.0
0.2
0.4
0.6
0.8
1.0
1.2
1.4
1.6
1.8
2.0
1948
1951
1954
1957
1960
1963
1966
1969
1972
1975
1978
1981
1984
1987
1990
1993
1996
1999
2002
2005
Source: Economic Research Service
Short-Term Impacts on Agriculture
To assess the short-term impacts we use the EPA energy price impacts to determine the impacts
of HR 2454 on the prices paid indices (PPIs) for agricultural inputs over 2012-18. The PPI for
fuel increases by 2.6 percent above baseline levels on average over 2012-18. Because of the
EITE provisions of HR 2454, fertilizer prices are largely unaffected.
6
Production Costs
The increases in energy prices cause the variable cost of production (COP) per acre to increase
for all crops (table 2). The extent of the price increases above the baseline levels ranges from an
average of 0.3 percent for upland cotton to 0.9 percent for sorghum.
Because of the EITE provisions, most of the impacts are felt through increased fuel costs. Thus,
those crops where fuel costs are proportionately higher showed larger impacts (e.g., rice,
sorghum.) The largest impacts in absolute terms were for rice producers with an average
increase over 2012-18 of $3.09 per acre (an increase of 0.7 percent in total operating costs).
Soybeans showed the smallest absolute increase ($0.45 per acre).
6
In the absence of the EITE provisions, higher natural gas prices would likely cause the PPI for fertilizer to increase
by 4.0 percent above baseline levels on average over 2012-18.
7
Table 2—Effects of HR 2454 on Variable Costs of Production, 2012-18 annual average,
($/acre, 2005 $)
Crop
With allotments for
fertilizer industry
No allotments for
fertilizer industry
Value of
allotments to
producer
$/acre, 2005$ (percent) $/acre, 2005$
Corn 1.19 (0.4%) 6.01 (2.2%) 4.82
Sorghum 1.26 (0.9%) 2.81 (2.0%) 1.56
Barley 0.70 (0.6%) 2.52 (2.0%) 1.82
Oats 0.57 (0.6%) 2.09 (2.2%) 1.52
Wheat 0.66 (0.6%) 2.49 (2.2%) 1.83
Rice 3.09 (0.7%) 7.02 (1.6%) 3.93
Soybeans 0.45 (0.4%) 1.28 (1.1%) 0.83
Upland cotton 1.46 (0.3%) 4.03 (0.9%) 2.58
The table also shows the estimated impact on costs of production in the absence of the EITE
provisions. Not surprising, fertilizer costs would increase the costs of production by a far greater
amount for all commodities. Using the EPA energy price estimates, we estimate corn production
costs could increase by an average of $6.01 per acre in real 2005 dollars in the near term (2012-
18), an increase of about 2.2 percent. Less energy-intensive crops such as soybeans experience
proportionately smaller impacts.
7
Nonetheless, the EITE provisions would protect producer
from higher fertilizer prices that might otherwise be expected with the increase in natural gas
prices.
Total farm production expenses could rise by 0.3 percent, in the near term (table 3). Expenses
for fuel, oil, and electricity are estimated to increase by about 6.4 percent. Over the near-term,
total farm expenses could increase by $0.7 billion per year in real 2005 dollars, on average.
8
Table 3—Effects of HR 2454 on Total Farm Expenses and Selected Inputs, 2012-18
Item
Billion $
(2005 $)
Total expenses 0.7
Fertilizer and lime < 0.1
Fuel, oil and electricity 0.7*
*Totals may not add due to rounding.
Prices
7
These impacts are similar to those found by FAPRI in their recent report, “The Effect of Higher Energy Prices
from HR 2454 on Missouri Crop Production Costs.” Available online at:
/>8
In absence of the EITE provisions, higher fertilizer prices could lead to an average annual increase in crop
production expenses of $1.4 billion over 2012-18.
8
Increasing production costs reduce profitability causing a small decline in planted acreage and
some switching to less energy-intensive crops. This leads to higher crop prices which partially
offset the increase in production costs (table 4). Higher crop prices increase feed costs, however,
which leads to a small contraction in livestock and dairy production, and higher prices for those
products. Over 2012-18, because of the EITE provisions, the effects of higher energy prices are
quite small with almost negligible impacts on crop and livestock prices.
Table 4—Effects of HR 2454 on Commodity Prices, 2012-18
Crop Percent Change
Crops
Corn 0.1
Sorghum 0.2
Barley 0.1
Oats 0.1
Wheat 0.1
Rice 0.1
Soybeans 0.0
Upland cotton 0.1
Livestock
Choice steers 0.0
Hogs 0.0
Broilers 0.0
Turkeys 0.0
Eggs 0.0
Milk 0.0
Total Receipts and Net Farm Income
Net farm income declines marginally in the near term. Based on the EPA energy price impacts,
and including the EITE provisions, we estimate that net farm income would fall by an average
$600 million per year in real 2005 dollars over 2012-18, less than 1 percent decline from
baseline levels (table 5).
9
Table 5—Effects of HR 2454 on Receipts, Expenses, and Net Farm Income, 2012-18 annual
average, (billion 2005 $)
Item
billion 2005$ Percent change from
baseline
Total receipts 0.0 0.0%
Total expenses 0.7 0.3%
Net farm income -0.6 -0.9%
Totals may not add due to rounding.
9
In absence of the EITE provisions, net farm income is estimated to fall by an average $1.3 billion annually over
2012-18, a decline of 1.8 percent from baseline levels.
9
Longer-Term Impacts on Agriculture
The USDA baseline only extends through 2018, which makes it impractical to conduct analysis
over the full timeframe considered in the EPA analysis. In our medium-term and long-term
analysis we assume the structure of the agricultural economy in the United States remains stable.
That is, the role of energy in agriculture remains the same over time. The relation between
energy-related expenses, other farm expenses, and the value of agricultural production stays the
same.
10
To assess the impacts of HR 2454 beyond 2018, we assume the underlying structure of the
agricultural economy and the forces that shape the agricultural sector are similar to trends over
the 2012-18 baseline period. For the medium term, we assumed the energy price increases
estimated by EPA for 2027-33 and examined their effects over 2012-18. For the long term
analysis, we assumed the energy prices increases estimated by EPA for 2042-48 and examined
their effects over 2012-18.
An important difference between the medium and long term analyses and the short term analysis
is that the EITE provisions are phased out beginning in 2025; thus, the full impact of higher
natural gas prices are felt through higher fertilizer prices in the medium and long term analyses.
The effects are thus proportionately larger.
Table 6 presents the impacts of higher energy prices on average annual production costs in the
medium and long term and compares them to the impacts over the short term discussed above.
Since the EPA analysis indicates that HR 2454 would have more pronounced effects on energy
costs over time, the effects on agriculture are more pronounced in the medium and long term
analyses. In addition to higher energy costs, the emissions allowances to trade exposed entities
such as nitrogenous fertilizer manufacturers begins to expires in our medium and long term
assessment. As a result, the medium and long term impacts on production costs have a relatively
larger impact on fertilizer intensive crops such as corn compared to less fertilizer intensive crops
such as soybeans. In the long run, and assuming no change in production practices, corn
production costs could rise by $25.19 per acre, on average, in real 2005 dollars or 9.6 percent. In
comparison, soybean production costs rise by only about $5.19 per acre, on average, in real 2005
dollars or 4.6 percent. Wheat, sorghum, barley and oats would see increases similar to corn in
percentage terms. Rice would likely have the largest average per-acre increase ($28.08 in 2005
dollars), though its relative increase would be less than that for corn, wheat and the other feed
grains. Likewise, cotton and soybeans would be affected, though the percent increase in
operating costs is estimated less than 5 percent.
10
Over the past 60 years, the relation between energy-related expenses and total farm expenses has been relatively
stable. Our assumption may be a bit conservative with respect to the value of agricultural output, which has shown
the relation between energy-related expenses and the value of agricultural production to have grown slightly. While
history may not be a perfect guide to the future, it gives us no indication to believe our assumption of a constant
relation between energy-related expenses and other agricultural indicators will change significantly.
10
Table 6 Estimated Impacts of Input Price Changes Due to HR 2454 on Per Acre Variable Costs
of Production (in 2005 $, percent change from baseline in parentheses)
Crop Near term Medium term Long term
Corn 1.19
(0.4%)
12.02
(4.6%)
25.19
(9.6%)
Sorghum 1.26
(0.9%)
5.45
(3.9%)
11.30
(8.0%)
Barley 0.70
(0.6%)
5.00
(4.1%)
10.44
(8.5%)
Oats 0.57
(0.6%)
4.12
(4.4%)
8.66
(9.2%)
Wheat 0.66
(0.6%)
4.94
(4.5%)
10.34
(9.5%)
Rice 3.09
(0.7%)
13.48
(3.1%)
28.08
(6.5%)
Soybeans 0.45
(0.4%)
2.50
(2.2%)
5.19
(4.6%)
Upland cotton 1.46
(0.3%)
7.90
(1.8%)
16.44
(3.7%)
Impacts on Total Receipts, Costs, and Net Farm Income
Table 7 presents the projected near, medium and long term impacts on farm cash receipts,
production expenses and net farm income. Fuel, oil and electricity expenses are estimated to
rise, on average, 22 percent above baseline levels in the long term while fertilizer and lime
expenses are estimated to rise, on average, by almost 20 percent. While total receipts increase
marginally—due to higher crop and livestock prices—they are not sufficient to offset the
increase in farm expenses. As a result, net farm income is estimated to decline by as much as 7.2
percent from baseline levels.
Table 7 Estimated Impacts of Input Price Changes Due to HR 2454 on Net Farm Income (in
billion 2005 $, percent change from baseline in parentheses)
Item Near term Medium term Long term
Total receipts 0.0
(0.0%)
0.4
(0.1%)
0.9
(0.3%)
Total expenses 0.7
(0.3%)
2.7
(1.1%)
5.6
(2.2%)
Fuel, oil and
electricity
0.7
(6.4%)
1.3
(11.1%)
2.6
(22.2%)
Fertilizer and
lime
< 0.1
(0.3%)
2.0
(9.5%)
4.3
(19.9%)
Net farm income -0.6
(-0.9%)
-2.4
(-3.5%)
-4.9
(-7.2%)
11
Accounting for Producer Adjustments to Higher Energy Costs and Increased Biomass
Production Due to Higher Energy Prices
The medium to long term analyses are conservative given the observation that energy use per
unit of output has declined significantly over the past several decades. Because of this, the
estimates in table 7 are likely an upper bound estimate on the costs because they fail to account
for farmers’ ability to fully respond to changes in market conditions. In addition, our analysis is
also conservative because it does not account for revenues to farmers from biomass production
for bioenergy.
A number of studies have examined the effects of higher energy costs with models that allow for
changes in production management practices and switching to bioenergy crops.
11
Based on the
analysis of Schneider and McCarl, for example, allowing for changes in input mix and revenues
from biomass production - but without accounting for income from offsets -, it is estimated that
annual net farm income would increase in 2030 by about $0.6 billion or less than 1 percent. By
2045, annual net farm income is estimated to increase by more than $2 billion or 2.9%.
The Role of Offsets
HR 2454 would also provide opportunities for farmers and ranchers to receive payments for
carbon offsets. EPA’s analysis indicates that in 2020 agricultural lands would supply 70 million
tons of CO
2
e offsets through changes in tillage practices, reductions in methane and nitrous
oxide emissions, and tree planting (afforestation). Existing forests would supply an additional
105 million tons of CO
2
e reductions through enhanced forest management. By 2050,
agricultural lands could supply 465 million tons of CO
2
e reductions and existing forests supply
an additional 178 million tons of CO
2
e reductions. This could generate gross domestic
agricultural and forestry offset revenues of $2 billion per year in real 2005 dollars in the near
term, rising to about $28 billion per year in real 2005 dollars in the long term (table 8). Part of
that revenue would be offset by the cost associated with implementing the specific type of
practice used to reduce emissions or sequester carbon. USDA has not yet done this analysis, so
we are unable to make a direct comparison of the magnitude of the net revenue from the offsets
market and the estimated income loss due to higher input costs. EPA has conducted its own
analysis of returns from offsets that take into account the costs of implementing land
management practices. EPA’s analysis projects annual net returns to farmers of about $1-2
billion per year from 2012-18, rising to $20 billion per year in 2050. It’s important to note that
EPA’s analysis includes revenue generated from forest management offsets while USDA’s does
not. USDA’s analysis strongly suggests that revenue from agricultural offsets (afforestation, soil
carbon, methane reduction, nitrous oxide reductions) rise faster than costs to agriculture from cap
and trade legislation. It appears that in the medium to long term, net revenue from offsets will
likely overtake net costs from HR 2454, perhaps substantially.
11
For example, see Schneider, Uwe A. and Bruce A. McCarl. “Implications of a Carbon-Based Energy Tax for U.S.
Agriculture.” Agricultural and Resource Economics Review 34/2 (October 2005): 265-279.;
12
Table 8 Estimated Gross Revenues from Offsets Associated with HR 2454 (in billion 2005 $)
Item Near term Medium term Long term
Afforestation and Soil
Carbon
0.4 3.6 17.7
Methane and Nitrous
Oxide Reductions
0.1 0.5 2.5
Forest Management 1.6 3.4 8.2
Total Offset 2.1 7.6 28.4
Source: EPA
Regional Considerations
Using a regional model of the U.S. agricultural sector, Lewandrowski et al. examined the
potential for carbon sequestration at various carbon prices. At a carbon price of $34 per MT
CO2e , they estimate that up to 101 million tons of CO2e could be sequestered through tillage
practices and up to 488 million tons through afforestation (147 million tons from cropland and
342 million tons from grassland). Figure 4 shows the regional breakout of the potential carbon
dioxide equivalent sequestered through afforestation on cropland and pastureland and through
soil management at a carbon price of $34 per CO2e.
Figure 4—Carbon Sequestration Potential by Region
(based on carbon price of $34/MT CO2e)
0 50 100 150 200
North East
Lake States
Corn Belt
Great Plains
Appalachia
South East
Delta States
Mountain
Pacific
MMT CO2e
Afforestation from
cropland
Afforestation from pasture
Tillage changes
Source: Lewandrowski et al. 2004
Summary
The House climate bill will likely have small but significant effects on crop and livestock
producers. Over the short run, impacts are largely negligible due to the EITE provisions of the
13
bill which would shield producers from the effects of higher natural gas prices on fertilizer
prices. After 2025, however, fertilizer prices would likely increase. While energy-intensive
crops will be most affected, the legislation also provides significant opportunities to offset
increased costs through carbon sequestration activities. Our analysis does not assess the change
in farm income due to the Renewable Electricity Standard provisions in HR 2454. Greater
demand for renewable electricity will put upward pressure on the demand for biomass and
provide an added source of farm income.