Microgel iron oxide nanoparticles for tracking of stem cells through magnetic resonance imaging
Bạn đang xem bản rút gọn của tài liệu. Xem và tải ngay bản đầy đủ của tài liệu tại đây (7.11 MB, 275 trang )
Microgel Iron Oxide Nanoparticles for
Tracking of Stem Cells through
Magnetic Resonance Imaging
Eddy Shoo Ming LEE
A thesis submitted for the degree of
Doctor of Philosophy
National University of Singapore
Abstract
1
Abstract
Stem cell therapy is an emerging field of regenerative medicine that has the potential
to treat diseases by transplanting therapeutic cells to replace or support the repair of
damaged host cells. An important step of the therapeutic success is the homing of
transplanted cells to the desired site. Magnetic resonance imaging (MRI), coupled
with cellular markers, offers a non-invasive method of following the fate of cell
transplants during the therapeutic period. However, clinically and commercially-
available markers do not offer sufficient image contrast for the detection of small
groups of cells. The aim of this thesis is to investigate the development of particulate
cellular markers that will improve the tracking of stem cells in an animal model
through MRI.
Current markers for cellular labelling are composite, magnetic particles that measure
less than 100 nm or greater than 1 micron in diameter. As the intermediate range has
not been investigated, microgel iron oxide particles (MGIO) with the diameters of 89
to 765nm were synthesised and characterised in terms of their physical properties.
The magnetic resonance relaxation characteristics of MGIO were measured and
shown to largely agree with the values predicted by theoretical models.
The efficiency of MGIO was tested on human fetal mesenchymal stem cells (fMSC).
With simple incubation, MGIO provided equal or better uptake in fMSC compared to
a clinical particle, ferucarbotran, with MGIO-600nm achieving three-fold higher
uptake. Labelled fMSC was characterised in terms of proliferation rate, multilineage
differentiation capacity and global gene expression to show that labelling with MGIO
does not affect stem cell functions. To further verify the safety of MGIO, human
Abstract
2
endothelial progenitor cells were labelled and shown to retain phenotype and function
after labelling.
A rat stroke injury model was developed to observe cellular migration. Labelled-
fMSC was transplanted intracerebrally or intraveneously and shown via MRI to home
to the injury site. MGIO labelling provided superior detection of cells compared to
ferucarbotran labelling. Histological analysis showed that MRI reliably detected the
location of fMSC for up to 5 days post-transplantation after which fMSC were
rejected by the host due to the nature of the animal model used. This study shows that
MGIO is an efficient label that enables improved detection of transplanted cells
during in vivo imaging.
In all, this thesis describes the development of a high contrast MRI cellular label with
superior performance over commericially-available iron particles, with possible
applications for in vivo tracking of transplanted stem cells.
Acknowledgements
3
Acknowledgements
This thesis has been funded by the Singapore Bio-Imaging Consortium (SBIC) of the
Agency for Science, Technology and Research (A*STAR).
First of all, I would like thank Professor Wang Shih-chang and Professor Teoh Swee
Hin for their supervision and guidance throughout this study. I would like express
special gratitude to Dr Jerry Chan for his tireless inspiration, patience and hands-on
approach to the guidance of this thesis.
The overseas collaborators of this study, Professor André Briguet, Dr Olivier Beuf
and Dr Claire Billotey deserve special mention for the training in animal imaging I
received at their facilities in Lyon, France. I am grateful to A/Prof Mahesh Choolani
for sharing his wealth of experience in experimental design and analysis. I would also
like to thank Professor Michael Tam for his advice on chemical synthesis and Dr
Borys Shuter for the hours we spent discussing about imaging physics and A/Prof
Ding Jun his advice in material science.
I would like to thank my colleagues Lay Geok, Mark, Zhiyong, Yiping, Durrgah and
Brenda for their technical support and their company during the darkest hours of
experimentation. I am also indebted to Wai Leng, Serena, Ginny and Pascale for their
administrative support and Mathieu for the French translation of the abstract.
I would like to thank my family – my parents Lawerence and Florence Lee, and sister
Alicia Lee for their support of this endeavour. Most of all, I would like to thank my
wife, Debbie for her love, patience and presence, and God for this opportunity in life.
Table of Content
4
Table of Content
Abstract 1
Acknowledgements 3
Table of Content 4
List of Figures 8
List of Tables 14
Abbreviations 16
Chapter 1 Introduction 18
1.1 Stem Cell Therapy 19
1.2 Mesenchymal Stem Cells 23
1.2.1 Origin of MSC 23
1.2.2 MSC Sources 25
1.2.3 MSC Characteristics 26
1.2.4 Homing and Migration 31
1.2.5 Engraftment 33
1.2.6 Clinical trials of MSC Therapy 42
1.3 Monitoring of Cell Therapy 49
1.3.1 Histological Methods 49
1.3.2 In vivo Imaging Modalities 51
1.4 MR Contrast 54
1.4.1 T2
*
Relaxation 55
1.4.2 T2 Relaxation 56
1.4.3 Contrast agents 58
1.4.4 Theoretical Relaxation Induced by Homogenous Magnetised Spheres 60
1.5 Iron Oxide Particles 67
1.5.1 Iron Oxide Particle Synthesis 67
1.5.2 Encapsulation of Iron Oxide Particles 68
1.5.3 Particle Size Measurement by Light Scattering 70
1.6 Cellular MRI 74
1.6.1 MRI in Tissue Engineering 74
1.6.2 MRI in Cellular Transplantation 75
1.6.3 MRI in Homing and Migration Studies 75
1.6.4 Clinical Trial of Cellular MRI 76
1.6.5 Cellular Imaging with Iron Oxide Particles 77
1.6.6 Mechanisms of Cellular Uptake 82
Table of Content
5
1.6.7 Controlling Cellular Uptake of Particles 89
1.6.8 Transgenic Methods 97
1.6.9 Challenges of Cellular MRI 100
1.7 Summary 105
1.7.1 Hypothesis 106
Chapter 2 Methods 107
2.1 Synthesis of Particles 108
2.1.1 Synthesis of Precursor Migrogel 108
2.1.2 Synthesis of MGIO 111
2.2 MGIO Characterisation 114
2.2.1 Transmission Electron Microscopy 114
2.2.2 Thermogravimetric Analysis 114
2.2.3 Vibrating Sample Magnetometry 115
2.2.4 SQUID Magnetization 115
2.2.5 Dynamic Light Scattering 116
2.2.6 MR Relaxation Rate 117
2.3 Ethics and samples 119
2.4 fMSC isolation and differentiation 119
2.5 EPC Isolation 120
2.6 EPC Immunostaining 121
2.7 Cellular labelling protocol and iron quantification 122
2.8 Iron Quantification 123
2.9 Cellular TEM 124
2.10 Genome wide Microarray Expression Analysis 125
2.10.1 RNA Extraction 125
2.10.2 Characterisation of RNA Purity 125
2.10.3 Analysis of Microarray Data 129
2.11 In vivo imaging 131
2.11.1 Cellular Migration Stroke Model 131
2.11.2 Transplantation of fMSC 134
2.11.3 MRI 136
2.11.4 Histology 137
2.12 Statistics 138
Chapter 3 Results I: MGIO Synthesis and Characterisation 139
3.1 Synthesis of PMG 141
3.2 Synthesis of MGIO 142
3.3 Characterisation of MGIO 143
Table of Content
6
3.3.1 Transmission Electron Microscopy 143
3.3.2 Thermogravimetric Analysis 145
3.3.3 Vibrating Sample Magnetometry 153
3.3.4 SQUID 157
3.3.5 Dynamic Light Scattering 160
3.3.6 Relaxation 167
3.4 Discussion 174
Chapter 4 Results II: Labelling of Stem Cells 176
4.1 Isolation and Characerisation of fMSC 178
4.2 Uptake of MGIO by fMSC 179
4.3 Proliferation of Labelled fMSC 183
4.4 Multi-Lineage Differentiation of Labelled fMSC 185
4.5 Microarray Analysis of Labelled fMSC 187
4.5.1 Development and Analysis of Microarray Data 187
4.6 Uptake of MGIO by EPC 203
4.7 Function of Labelled EPC 204
4.8 Discussion 207
Chapter 5 Results III: MR Tracking of MGIO-fMSC 211
5.1 Cellular Migration Stroke Model 213
5.1.1 Internal and Middle Cerebral Artery Occlusion 213
5.1.2 Photochemical Cerebral Thrombosis 214
5.2 Tracking fMSC in Stroke Animals 215
5.3 Histology 220
5.4 Discussion 231
Chapter 6 General Discussion 233
6.1 Hypothesis 234
6.2 Summary of Findings 235
6.3 Limitations 236
6.4 Future Directions for Research 239
6.5 Conclusion 241
Chapter 7 Appendix 242
7.1 List of Overexpressed genes 243
7.1.1 M600-Labelling Up-Regulated Genes (Top 50) 243
7.1.2 M600-Labelling Down-regulated Genes (Top 50) 244
7.1.3 Ferucarbotran-Labelling Up-regulated Genes 245
7.1.4 Ferucarbotran-Labelling Down-regulated Genes 246
Table of Content
7
7.2 Record of Experimental Animals 247
7.3 Publications 249
References 251
List of Figures
8
List of Figures
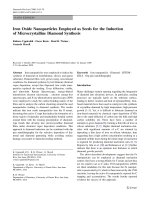
Figure 1: General differentiation potential of pluripotent embryonic stem cells and multipotent adult
stem cells. The pluripotent embryonic stem cells from the inner cell mass can differentiate into any cell
in the body. In comparison, the multipotent stem cells from various adult tissues are committed but can
still differentiate into multiple cell types. 22
Figure 2: Mesenchymal stem cells (MSCs) differentiation is multistep, involving committal
development of cells towards a particular lineage. They have the potential to differentiate into various
tissue including bone, cartilage, muscle, marrow stroma, tendon/ligament, fats, and other connective
tissues. (Caplan, 2005). 29
Figure 3: Various modalites of cellular imaging adapted from Arbab et al (Arbab, 2008). CEST:
Chemical exchange-dependent Saturation Transfer, CT: computer tomography, PET: positron emission
tomography, SPECT: single photon emission computed tomography, mAb: antibodies, IM: intravital
microscopy, FRI: fluorescence reflectance imaging, BLI: bioluminescence imaging, US: ultrasound.
Sensitivity: the minimum number of cells detectable. Reporter gene: whether transgenic cells can carry
a reporter gene that generates contrast. 53
Figure 4: A plot of the transverse magnetization decaying at a rate of 1/T2* rate. If a refocusing pulse
is applied at an interval of τ, the signal reaches another maxima at time 2τ = TE (Haacke, 1999). 56
Figure 5: Applying multiple, regularly spaced refocusing pulse at (2n-1)τ and acquiring signals at 2n
,
where n is 1, 2, 3, …. (Haacke, 1999) 57
Figure 6: Relaxation rate dependence on particle diameter, d. 61
Figure 7: Illustration of scattering of the incident beam and detection of the scattered beam 71
Figure 8: Possible pathways of cellular uptake of nanoparticles. Uptake of particles can occur through
phagocytosis (1), macropinocytosis (2), clathrin-mediated endocytosis (3), non-clathrin-, non-caveolae-
mediated endocytosis (4), caveolae-mediated endocytosis (5) or diffusion (6). (Unfried, 2007) 83
Figure 9: Pinocytosis. This process, as known as ‘cell-drinking’ or fluid-phase endocytosis, internalizes
particles in uncoated intracellular vesicles called pinosomes. The pinocytosis of larger particles may be
called macropinocytosis and the resulting vesicles are known as macropinosomes. 85
Figure 10. TEM of Formation of Clathrin Pits. The microgaphes shows the sequence of extracellular
debris internalization via clathrin-mediated endocytosis. The event is initiated by (a) induction of
membrance curvature, followed by (b) formation of coated pits and membrane invagination, (c)
constriction and fission and finally the containment of debris in clathrin-coated vesicle. Following
these events, the vesicle fuses with early endosome that can mature into late endosome and lysozome
(Perry, 1979). 87
Figure 11. TEM of Caveolae invaginations. Caveolae are flasked-shaped plasma invaginations. After
internalization, caveolae-drived vesicles travel to caveosomes, which are distinct from endosomes in
content and pH. Thereafter, caveosome content is sorted to the Golgi complex or the endoplasmic
reticulum (Rothberg, 1992). 87
Figure 12: Uptake of polystyrene (open symbols) and phenylated polyacrolein (closed symbols)
particles in absence of serum (greater uptake) and 10% serum (lesser uptake), showing maximal uptake
within a range of sizes (Tabata, 1988) 92
Figure 13 Schematic of PMG. The molar ratio of methacrylic acid (MAA) and ethyl acrylate (EA), and
the wt% of crosslinker di-allyl phthalate (DAP) are represented by x, y and z respectively. 110
List of Figures
9
Figure 14: Electrogram showing crisp 28S and 18S bands 127
Figure 15: Procedures of stroke induction by photochemical thrombosis. (a) Animal is mounted on a
stereotatic frame and skull was exposed. (b) Through a 3mm aperture, green-filtered white light was
applied to the skull while Rose Bengal was injected via a tail vein cannula. 133
Figure 16: Animals is mounted on a stereotaxic frame and (a) a 1mm burr hole was made to expose the
dura and (b) the Hamilton syringe was lowered and cells were injected slowly over a 10 min period.135
Figure 17: (a-e) Transmission micrographs of M600 air-dried on copper grid. (a-c) MGIO are spherical
particles that are 50-70nm when dried. The primary iron oxide (PIO) nanoparticles, being more
electron dense than the polymer matrix of PMG, appear as dark spots in each MGIO. (d-e) High
magnification images show that the PIO are 2-5nm each. (f) Selected area electron diffraction of a
single MGIO particle showing interplanar pattern typical of composite particle containing magnetite
144
Figure 18: Transmission micrographs of ferucarbotran air-dried on copper grid. (a) Dried ferucarbotran
are about 50nm in diameters, they appear spherical but aggregated when dried. (b) 3 individual
particles of ferucarbotran that have diameters 40-60nm and they contain PIO, just like MGIO. 145
Figure 19 Schematics of anhydrite formation during PMG degradation. (a) Between two MAA
neighbours, an ethanol molecule is removed. (a) Between a neighbouring MAA and EA, a water
molecule is removed. 146
Figure 20: Thermogram of M100. Weight % curve (green) shows that the sample weight was decreased
from 100% at room temperature to 97% after evaporation of absorbed water and further decreased to
74% at 850C. The first minimum of the derivative weight (blue) was taken as the temperature where
absorbed water had been removed removed. 148
Figure 21: Thermogram of M150. Weight % curve (green) shows that the sample weight was decreased
from 100% at room temperature to 97% after evaporation of absorbed water at the first minimum of the
derivative weight (blue) and further decreased to 80% at 850C. 148
Figure 22: Thermogram of M250. Weight % curve (green) shows that the sample weight was decreased
from 100% at room temperature to 97% after evaporation of absorbed water at the first minimum of the
derivative weight (blue) and further decreased to 45% at 850C. 149
Figure 23: Thermogram of M300. Weight % curve (green) shows that the sample weight was decreased
from 100% at room temperature to 97% after evaporation of absorbed water at the first minimum of the
derivative weight (blue) and further decreased to 65% at 850C. 149
Figure 24: Thermogram of M400. Weight % curve (green) shows that the sample weight was decreased
from 100% at room temperature to 97% after evaporation of absorbed water at the first minimum of the
derivative weight (blue) and further decreased to 64% at 850C. 150
Figure 25: Thermogram of M500. Weight % curve (green) shows that the sample weight was decreased
from 100% at room temperature to 97% after evaporation of absorbed water at the first minimum of the
derivative weight (blue) and further decreased to 62% at 850C. 150
Figure 26: Thermogram of M600. Weight % curve (green) shows that the sample weight was decreased
from 100% at room temperature to 94% after evaporation of absorbed water at the first minimum of the
derivative weight (blue) and further decreased to 36% at 850C. 151
Figure 27: Thermogram of M750. Weight % curve (green) shows that the sample weight was decreased
from 100% at room temperature to 96% after evaporation of absorbed water at the first minimum of the
derivative weight (blue) and further decreased to 33% at 850C. 151
List of Figures
10
Figure 28: Magnetization curves for M400 to M750 measured by VSM. (a-e) Magnetization was
measured while the samples were subjected to a static field that was varied stepwise from 10
3
to -10
3
G.
(f) Magnification of the orgin when curves of M400 to M750 are superimposed show a small amount
of hysteresis. 155
Figure 29: Average magnetization of M400 to M750. (a) By superimposing the magnetization curves,
the average magnetization (b) at each field strength can be obtained and plotted. 156
Figure 30: ZFC/FC of lyophilised M600 from 0 to 320K. The two curves did not intersect at
temperatutes below 300K, hence the blocking temperature is above 300K. The blocking temperature is
probably slightly above 320K as the curves were almost intersecting at 320K. 157
Figure 31: ZFC/FC of aqueous M600. The results were similar to those with lyophilized sample. The
curves were nearly intersecting at 320K, indicating that the blocking temperature was not much further.
158
Figure 32: DLS plots of ferucarbotran and M100 to M750. All particles had unimodal size distributions.
The peak of each distribution curve was taken as the mean hydrated diameter. 161
Figure 33: DLS distribution curves of Ferucarbutran from repeated measurements of one sample 163
Figure 34: DLS distribution curves of M100 from repeated measurements of one sample 163
Figure 35: DLS distribution curves of M150 from repeated measurements of one sample 164
Figure 36: DLS distribution curves of M250 from repeated measurements of one sample 164
Figure 37: DLS distribution curves of M300 from repeated measurements of one sample 165
Figure 38: DLS distribution curves of M400 from repeated measurements of one sample 165
Figure 39: DLS distribution curves of M600 from repeated measurements of one sample 166
Figure 40: DLS distribution curves of M750 from repeated measurements of one sample 166
Figure 41: Example of a plot of relaxation rates against concentration to determine relaxivity. The
gradient of CPMG relaxation rates and GRE relaxation rates corresponded to relaxivity r2 and r2*,
respectively. 167
Figure 42: Relaxation rates of particles at 0.1mM Fe. R2* increased with diameter and reaches a
plateau at M250. R2 is the same as R2* but as diameters increased beyond M250, R2 decreased. 168
Figure 43: Comparision of relaxation rates to distinct regimes theory of motional averaging (MAR),
static dephasing (SDR) and echo limited regime (ELR). Measurement fit the theoretical models in
general. 169
Figure 44: Comparison of Muller’s simulation, distinct regime and continuous theory. Muller’s
simulated relaxation rates fit both theories better than the measurements of MGIO. 171
Figure 45: Representative sketch of composite particles such as MGIO that consist of multiple primary
iron oxide nanoparticle cores (PIO) held together by a polymer matrix like microgel. Each composite
particle is equivalent to one with a single homogenous core with diameter d
mag
. (a) For large MGIO, the
diameter determined by dynamic light scattering (d
DLS
) approximates d
mag
. (b) For fercarbotran or small
MGIO, d
DLS
and d
mag
deviates. 172
Figure 46: (a) Light micrograph of M600-labelled fMSC with iron stained with Prussian Blue. (b) TEM
of labelled fMSC with insert showing MGIO in double-walled membrane organelle 179
List of Figures
11
Figure 47: Micrographs of (a) M600, (b) mock and (c) ferucarbotran-labelled fMSC on a
haemocytometer show that labeled cells are separated and their sizes in suspension remain 15-25 µm in
diameter, as indicated by the lines of the (d) Neubauer haemocytometer, regardless of labelling. 180
Figure 48: Intracellular iron mass when labelled with different particles showed a particle size-
dependent quantity of uptake. All MGIO sizes showed the same or higher uptake than ferucarbotran
with M600 providing the highest uptake. 181
Figure 49: Intracellular iron as a function of labelling concentration. As iron concentration in the
labeling medium was increased, the iron loading of the cells were increased and the difference in
loading between ferucarbotran and M600 became more significant 182
Figure 50: Retention of intracellular iron over 3 passages. Individual points indicate the quantity of iron
at each particular population doubling. Lines are one-phase decay fits to each particle to show that
intracellular iron was approximately halved each time a cell divided with R
2
showing goodness of fit.
183
Figure 51: Population doublings at each passage. The number of population doubling at each of the
three passages post-labelling were not affected by the particles used. 184
Figure 52: Cell viability at each passage. The effect of labelling on the cell viability, as assessed by
Trypan blue exclusion assay, was insignificant for three passages post-labelling. 184
Figure 53: Trilineage differentiation of fMSC post-labelling. Labelling with either ferucarbotran or
M600 did not affect the multipotent capacity of fMSC as shown by their differentiation into osteoblasts
(black extracellular crystals by von Kossa staining), adipocytes (oil red O staining) or chondrocytes
(micromass pellet cultures were stained red by Safranin O and blue by Alcian blue) 186
Figure 54: Scatter plot showing the 1504 M600-labelled probes that had significant difference in
expression compared to the mock-labelled counterparts. Out of these probes, 114 were more than 2-
fold upregulated and 102 were more than 2-fold downregulated. 189
Figure 55: Scatter plot showing the 895 ferucarbotran-labelled probes that had significant difference in
expression compared to the mock-labelled counterparts. Out of these probes, 32 were more than 2-fold
upregulated and 29 were more than 2-fold downregulated. 189
Figure 56: Heatmaps of 114 upregulated (left) and 102 downregulated (right) probes due to M600-
labelling. Ferucarbotran-labelling resulted in the upregulation and downregulation of the same genes,
except for the group circled blue and yellow. 190
Figure 57: Heatmaps of 32 upregulated (left) and 29 downregulated (right) probes due to ferucarbotran-
labelling. M600-labelling resulted in the upregulation of the same genes, except for the group circled
blue. M600-labelling resulted in the downregulation of the same genes (circled in yellow) except the
the uncircled group. 191
Figure 58: Staining of (a) intracellular iron by Prussian blue and (b-d) cellular function of mock, M600
and ferucarbotran –labelled EPC. Labelled EPC retained the capacity to (b) form tubes, (c) take up Dii-
acLDL and (d) be stained for vWF. 205
Figure 59: Staining of mock, M600 and ferucarbotran-labelled cells for endothelial phenotypic surface
markers. Labelled EPC retained the expression of (a) CD144 and (b) CD31. 206
Figure 60: Consecutive 2mm brain sections of rats with photo-thrombotic stroke were stained by TTC.
Mitochrondia activity is stained red while the infarct region remains colourless. 214
Figure 61: Comparison of (a) TTC stain and (b) T2-weighted MR image of the approximate section
shows that TTC can reliably verify infarct extent 214
List of Figures
12
Figure 62: In vivo imaging with turbo spin echo (TSE, Day -1) and gradient echo sequence (GRE, Day
-1 through Day 12). A focal cortical stroke (yellow arrows) was induced at Day -2 and cellular
transplantation took place on Day 0 by contralateral intracerebral (green arrows) or systemic injection
(IV) (a) An area of hypointensity appeared in the area of the stroke (red arrows) noticeable at Day 5,
and increased over time to Day 12 in M600-fMSC injected animals. (b) A similar observation was
made in Ferucarbotran-fMSC injected animals, albeit with a smaller area of hypointensity seen. (c)
Animals injected with M600-fMSC intravenously showed appearance of hypointensity in the stroke
region by Day 5, which increased over time to Day 12. (d) In comparison, there was no hypointensity
at the contralateral cerebral cortex where no stroke injury had been induced. 216
Figure 63: In vivo imaging with SSFP sequence. The images are of the same animals and were taken
immediately after those in Figure 62. A focal cortical stroke (yellow arrows) was induced at Day -2 and
cellular transplantation took place on Day 0 by contralateral intracerebral (green arrows) or systemic
injection (IV) (a) An area of hypointensity appeared in the area of the stroke (red arrows) noticeable at
Day 5, and increased over time to Day 12 in M600-fMSC injected animals. (b) A similar observation
was made in Ferucarbotran-fMSC injected animals, albeit with a smaller area of hypointensity seen. (c)
Animals injected with M600-fMSC intravenously showed appearance of hypointensity in the stroke
region by Day 5, which increased over time to Day 12. (d) In comparison, there was no hypointensity
at the contralateral cerebral cortex where no stroke injury had been induced. 219
Figure 64: Immunohistological analysis of animals transplanted with 2x10
4
M600-fMSC on Day 1. (a-c)
Prussian blue/haematoxylin-eosin staining demonstrated iron-laden cells at the injection site, but not
the stroke site. (d-f) Immunohistochemical staining of adjacent sections showed these to be mainly
human vimentin-positive fMSC (green), infiltrated by ED1-positive rat macrophages (red). (g-h)
Examination of the stroke area demonstrates presence of ED1-positive cells and no vimentin-positive
fMSC. Nuclei were stained with DAPI (blue). 221
Figure 65: Immunohistological analysis of animals transplanted with 2x10
4
M600-fMSC on Day 5. By
Day 5, (a-c) the presence of iron-laden cells can be seen at the stroke site through DAB enhancement of
Prussian blue staining (brown, b-c). (d-f) Immunohistological staining of adjacent sections showed the
presence of fMSC (green vimentin positive cells, f, z-stacked confocal) surrounded with ED1-positive
macrophages at the stroke site. 222
Figure 66: Immunohistological analysis of animals transplanted with 2x10
4
M600-fMSC on Day 12.
By Day 12, Prussian blue staining demonstrated increased iron-laden cells at the stroke site (a-c),
which were exclusively ED1-positive when stained for both ED1 and human vimentin on adjacent
sections (d-e). Both vimentin-positive and ED1-positive cells were found in the injection site (f). 223
Figure 67: Immunohistological analysis of animals transplanted with 2x10
4
ferucarbotran-fMSC on
Day 12. (a-c) Prussian blue/haematoxylin-eosin staining demonstrated a large number of iron-laden
cells at the stroke site. (d-e) Immunohistochemical staining of adjacent sections at the stroke site
revealed a large infilatrate of ED1 positive cells with no human-vimentin positive fMSC seen at the
stroke site. Nuclei were stained with DAPI (blue). 225
Figure 68: Immunohistological analysis of animals transplanted with 2x10
6
M600-fMSC by tail vein
injection on Day 19. (a-c) Prussian blue/haematoxylin-eosin staining demonstrated iron-laden cells at
the stroke site. (d-f) Immunohistochemical staining of adjacent sections revealed that these cells to be
ED1 positive macrophages. There were no human vimentin positive fMSC cells seen at the stroke area.
Nuclei were stained with DAPI (blue). 226
Figure 69: Immunohistological analysis of animals transplanted with 2x10
4
mock-labelled-fMSC at
Day 12. (a-c) Prussian blue/haematoxylin-eosin staining demonstrated absence of iron-laden cells at the
injection and stroke site. (d-e) Immunohistochemical staining of adjacent sections revealed infiltration
of ED1 positive cells with a few human vimentin-positive fMSC (green) at the (d) injection site but not
the (e) stroke site. Nuclei were stained with DAPI (blue). 227
Figure 70: Immunohistological analysis of animals without stroke but transplanted with 2x10
4
M600-
fMSC on Day 19. (a-b) Prussian blue/haematoxylin-eosin staining demonstrated iron-laden cells at the
injection site, but not the contralateral site. (c-e) Immunohistochemical staining of adjacent sections
List of Figures
13
showed infiltration of ED1-positive rat macrophages (red) and presence of human vimentin-positive
fMSC (green) at the injection area. (g-h) Magnified images shows many ED1-positive cells and only
few vimentin-positive fMSC. Nuclei were stained with DAPI (blue). 228
Figure 71: Histological sections on Day 12 of animal with stroke induced but no injection. (a-c) No
iron-laden cells were found at the Prussian blue/haematoxylin-eosin staining. (d-e)
Immunohistochemical staining of adjacent sections shows infiltration of ED1-positive rat macrophages
(red) but no human vimentin-positive fMSC (green) at the stroke area. (e) Magnification of the stroke
area shows many ED1-positive cells and and no vimentin-positive fMSC. Nuclei were stained with
DAPI (blue). 229
Figure 72: Immunohistochemical analysis of various animals with stroke induced and transplanted with
2 x 10
4
M600-fMSC and sacrificed at Day 1, 5 or 12. Sections, adjacent those shown in Figure 64 to
Figure 66, demonstrate progressive increase of CD8 (green) cytotoxic T cell in stroke site from Day 1
to 12 but only negligible change of CD8+ cells in the injection site, suggesting that an adapted immune
response was mounted against the stroke site only but not the injection site. 230
List of Tables
14
List of Tables
Table 1: Immunophenotype of human fetal MSC (O'Donoghue, 2006). + Positive, - Negative, ±
Weakly Positive or Low Expression. 28
Table 2: Molecules responsible for MSC migration. Adhesion molecules mediate MSC transendothelial
migration. Once in the perivascular space, chemokine receptors direct MSC migration along
chemokine gradients and metalloproteinases breakdown ECM while MSC migrates. 33
Table 3: Clinical trials for cardiac diseases adapted from Rosenzweig et al. Overall results of trials
show that bone marrow cell infusion may improve cardiac function but the effect may not be
permanent (Rosenzweig, 2006) 45
Table 4: Masses of reagents required to form six models of precursor microgel particles (PMG) of
different sizes by altering the micellar and MAA to EA ratios. 110
Table 5: Masses of reagents and the PMG models required to synthesize MGIO of approximately 100
to 750nm as denoted by models M100 to M750. 112
Table 6: Characteristics of total RNA obtained from labelled cells in triplicates. 126
Table 7: Iron oxide content of various MGIO models expressed in terms of weight % (IOwt%). 152
Table 8: Magnetization measurements determined by VSM. M10kOe is the magnetization when field
strength is 10
3
G; M
s
is the saturation magnetization when field → ∞; M
r
is the remnant magnetization
and H
c
is the coercivity. 156
Table 9: Hydrated diameter of particles expressed as mean SEM. 162
Table 10: Matching genes (column List 1) upregulated by M600 labelling to associated GO terms at
various hierachical levels and comparing the match with other genes in the genome (column Genome)
193
Table 11: Significant GO terms that are associated with the upregulation of 114 genes due to M600-
labelling 194
Table 12: Matching genes (column List 1) downregulated by M600 labelling to associated GO terms at
various hierachical levels and comparing the match with other genes in the genome (column Genome)
195
Table 13: Significant GO biological process terms that are associated with downregulation of 102
genes due to M600-labelling 197
Table 14: Significant GO biological process and molecular function terms that are associated with
downregulation of 102 genes by M600-labelling 198
Table 15: Matching genes (column List 1) upregulated by ferucarbotran labelling to associated GO
terms at various hierachical levels and comparing the match with other genes in the genome (column
Genome) 199
Table 16: Significant GO terms that are associated with upregulation of 32 genes due to ferucarbotran-
labelling 200
Table 17: Matching genes (column List 1) downregulated by ferucarbotran labelling to associated GO
terms at various hierachical levels and comparing the match with other genes in the genome (column
Genome) 200
List of Tables
15
Table 18: Significant GO terms are associated with downregulation of 29 genes due to ferucarbotran-
labelling 201
Table 19: Record of experimental animals used in our study classified by the experimental groups. . 248
Abbreviations
16
Abbreviations
AMNP Anionic magnetic nanoparticle (30nm)
APC Antigen presenting cells
BBB Blood brain barrier
BMC Bone marrow cells
BMT Bone marrow transplantation
cDNA Complementary deoxyribonucleic acid
CM10 Culture medium with 10% fetal bovine serum
CNS Central nervous system
CPMG Carr-Purcell-Meiboom-Gill sequence
CyA Cyclosporin A
DAP Di-allyl phthalate
DLS Dynamic light scattering
EA Ethyl acrylate
ED1 Cytoplasmic marker for rat macrophages/microgia
ELR Echo limited regime
EPC Endothelial progenitor cells
ESC Embryonic stem cells
FC Field cooled magnetization curve
FISH Fluorescent in situ hybridisation
GFP Green fluorescent protein
GRE Gradiant echo pulse sequence
fMSC Human fetal mesenchymal stem cells
HLA Human Leukocyte Antigen
HSC Haematopoietic stem cells
ICP Inductively coupled plasma
MAA Methacrylic acid
MAR Motional averagering regime
Abbreviations
17
MGIO Microgel iron oxide particles
MHC Major histocompatibility complex
MION Monocrystalline iron oxide nanoparticle
MNC Mononuclear cells
MMP Metalloproteinases
MRI Magnetic resonance imaging
MSC Mesenchymal stem cells
PB Prussian blue
PIO Primary iron oxide nanoparticle cores
PMG Precursor microgel particles
RME Receptor mediated endocytosis
RNA Ribonucleic acid
SDR Static dephasing regime
SPIO Superparamagnetic iron oxide nanoparticle
TEM Transmission electron microscopy
TGA Thermogravimetric analysis
TTC 2,3,5-triphenyltetrazolium
USPIO Ultrasmall SPIO
VIM Human vimentin
VSOP Very small iron oxide particle (8nm)
ZFC Zero field cooled magnetization curve
Introduction
18
Chapter 1 Introduction
Introduction
19
1.1 Stem Cell Therapy
Stem cell therapy is a rapidly emerging field of regenerative medicine where
transplanted stem cells either directly replace or ameliorate the repair of damaged host
tissue. Several clinical trials are already in progress for the treatment of various
diseases, such as ischemic stroke (Bang, 2005), skeletal dysplasia (Horwitz, 2001),
spinal cord injury (Callera, 2007) and myocardial infarction (Meyer, 2006). The
complexities and complete mechanisms by which cell-based therapies work need not
be fully understood to be used clinically. Instead, the key determinants for the use of
such therapies are safety and efficacy.
The first attempt of cellular transplantation in the literature was performed by W.G.
Thompson in the late nineteenth century. When allogeneic neocortex from a dog was
transplanted to another dog, the tissue showed “vitality to survive for seven weeks the
operation of transplantation without wholly losing its identity as brain substance”
(Thompson, 1890; Chen, 2008). Since that report, a myriad of transplantation
strategies have been performed in both humans and experimental animals, with little
understanding of the biology of the graft at times. Today, bone marrow
transplantation (BMT) has been used successfully for many years to treat leukaemia
and other haematological malignancies, and clinical trials using autologous and even
allogeneic stem cell transplantation therapies are being run concurrently with
laboratory efforts to better understand stem cell biology.
Stem cells are immature cells that possess the ability of self-renewal and
differentiation into various cell types. These cells can be broadly classified into three
categories based on their capacity for differentiation. Totipotent stem cells, such as
Introduction
20
the zygote or cells from early (1 to 3 days post fertilisation) embryos, have the ability
for each cell to develop into a complete individual. Pluripotent stem cell can form all
three germ layers of the body (endoderm, mesoderm and ectoderm), an example of
which is the embryonic stem cells (ESC) isolated from the inner cell mass of
blastocyst (5 to 14 days) (please refer to Figure 1). Multipotent stem cells are
committed cells that can still form a number of other tissues, but not all three germ
layers. An example of a multipotent stem cell is the haemopoietic stem cell (HSC)
which can derive both lymphoid and myeloid lineage blood cell types.
Recent developments in the understanding of multipotent stem cells from non-
embryonic sources have sparked new excitement in the field. Multipotent cells, such
as the mesenchymal stem cells (MSC), appear to possess greater plasticity than
dictated by established paradigms of embryonic development (Phinney, 2007). As
MSC can differentiate from primitive cells into mature cell types, they can be used for
cell replacement therapy, tissue engineering, regenerative medicine and vehicles for
gene therapy (Gafni, 2004). Unlike ESC which are reliably generated only with the
sacrifice of human embryos, multipotent cells from adult or terminated fetuses are
subjected to fewer ethical questions. These attributes of multipotent cells make them
promising candidates for future clinical use.
As stem cells are isolated from more adult tissue sources (often termed “niches”), the
definition of bona fide stem cells becomes important. The differences between stem
cells have prompted the need for detailed cell line classification methods such as
global gene expression profiling and clustering (Muller, 2008). Definitions aside, the
most important question is how we can use stem cell as therapeutic agents.
Introduction
21
Stem cells can be administered to a patient at the site of injury or less invasively
through an intravenous injection. When given intravenously, stem cells have the
ability to home and migrate to sites of tissue injury, where they may participate in
therapeutic activities. However, transplanted stem cells may also end up in other parts
of the body. Therefore, a method of tracking these transplanted cells is urgently
required. By combining nanoparticle technology and magnetic resonance imaging, we
can now visualise transplanted cells. Prior to their transplantation, stem cells can be
encouraged to engulf limited amounts of MR-visible particles which turn them MR-
visible, albeit only in large numbers grouped together. Better detection sensitivity is
required when tracking small groups of cells that migrate to remote locations or when
studying how cells accumulate at the boundary of an injury site. One method to
improve sensitivity is to encourage the cells to engulf more MR-visible particles. This
project aims to improve the stem cell uptake of particles with diameter between 100
and 900 nm, a size range which has not been studied.
Introduction
22
Figure 1: General differentiation potential of pluripotent embryonic stem cells and
multipotent adult stem cells. The pluripotent embryonic stem cells from the inner cell
mass can differentiate into any cell in the body. In comparison, the multipotent stem
cells from various adult tissues are committed but can still differentiate into multiple
cell types.
Embro
y
nic
Adult
www.isscr.org
Introduction
23
1.2 Mesenchymal Stem Cells
Mesenchymal stem cells (MSC) are multipotent cells that have received much
attention in recent years as a promising source of autologous or allogeneic cell type
for cellular therapy. They can be isolated from a number of adult (da Silva Meirelles,
2006) and fetal organs and tissues. It is believed that they reside in various niches for
the purposes of tissue maintenance and regeneration. Adult and fetal MSC share the
characteristics of self-renewal and differentiation down multiple mesenchymal
lineages, although human fetal MSC (fMSC) are more primitive and are capable of
greater proliferative and differentiation capabilities (Zhang, 2009).
1.2.1 Origin of MSC
The term, mesenchyme, is derived from Greek meaning “middle” (meso) “infusion”
and refers to the ability of mesenchymatous cells to spread and migrate in early
embryonic development between the ectodermal and endodermal layers. The middle
embryonic layer, the mesoderm, gives rise to all of the body’s skeletal elements
(Arnold, 1991).
During the period of haemopoietic stem cell discovery in the 1950s, Urist et al
observed that bone marrow could form new bone when transplanted to an ectopic site
(Urist, 1952). It was later identified that there exists a cell population in bone marrow
that could regenerate bone (Friedenstein, 1968). The isolation and culture of cells
from bone marrow that could form this ectopic bone was first demonstrated by
Friedenstein et al (Friedenstein, 1970). It was not until a decade later that a similar
adherent cell population from human bone marrow was isolated (Hann, 1983). Only
Introduction
24
more recently was the self-renewal and multipotency of fetal MSC demonstrated with
MSC cultured from first trimester fetal blood, liver and bone marrow (Campagnoli,
2000; Campagnoli, 2001).
After isolation, such cells can be separated from haemopoietic cells by their
adherence to plastic culture dishes and proliferation from an initially heterogeneous
population towards a more homogenous, spindle-shaped cell type with subculturing /
passaging. MSC exist in the adult bone marrow as rare cells, with a frequency of one
in 10
4
to 10
6
mononuclear marrow cells (Pittenger, 1999; Friedenstein, 1970; Castro-
Malaspina, 1980). They were originally called “colony forming unit – fibroblast”
(CFU-F), for their ability form colonies of fibroblast-like cells. The nomenclature
developed from CFU-F to multipotent stromal cells or mesenchymal stem cells, with
the latter popularized by Caplan in the 1990s (Caplan, 1991).
Due to the heterogeneous nature of these cells, critics have argued against the use of
the term “stem” to describe the whole isolated cell population (Horwitz, 2005).
Although not yet rigorously defined, “stemness” refers to the capacity for self-renewal,
differentiation and function. Demonstration of MSC surviving in vivo for long periods
with multi-lineage differentiation, self-renewal and tissue repopulation has been more
difficult than for haemopoietic stem cells (HSC) (Thomas, 2008; Horwitz, 2005).
Moreover, in vivo integration and differentiation have been proven by teratoma
formation with embryonic stem cells (ESC) (Thomson, 1998) and reconstitution in
irradiated host with multipotent adult progenitor cells (MAPC) (Reyes, 2001; Jiang,
2002), but not MSC. It was proposed that “mesenchymal stem cells” should be
reserved for only the subpopulation of cells that exhibit “stemness”. Some researchers
have preferred to call these cells bone marrow stromal stem cells, stromal precursor