Isolation and characterization of allergens from curvularia lunata 2
Bạn đang xem bản rút gọn của tài liệu. Xem và tải ngay bản đầy đủ của tài liệu tại đây (1.01 MB, 54 trang )
Chapter 2
43
CHAPTER 2:
IDENTIFICATION OF Curvularia lunata ALLERGENS
Chapter 2
44
2.1 INTRODUCTION
Amongst the various fungal aero allergens found in the Singapore environment, the
genus Curvularia (as explained earlier) was found to be a fungus of great importance.
Several studies carried out previously on Curvularia suggest it to be an important
allergenic fungus of medical importance (Gupta et al., 1999; Gupta et al., 2000; Chew
et al., 2000; Asero and Botazzi, 2001; Schroeder et al., 2002; Bisht et al., 2002; Green
et al., 2003; Calhoun, 2004). Although much literature has described Curvularia to be
an important fungus, very few reports (two studies) have actually tried to isolate and
characterize individually, the underlying allergenic components of Curvularia in
detail. The first study describes the amino terminal sequence
(GLTQKSAPWGLGADTIVAVELDSY) of a glycoprotein allergen (Cur l 1) showing
similarity in sequence and activity with serine proteases (Gupta et al., 2004). The latest
study on Curvularia lunata describes cloning, expression and characterization of a 48
kDa recombinant enolase allergen, named as Cur l 2 (Sharma et al., 2006).
The first and foremost step for generating a total recombinant allergen repertoire from
C.lunata, high throughput identification of allergens is required. Various genomics and
proteomics methods for rapid and high throughput identification of proteins can be
utilized for this purpose. On the genomics side, methods such as whole genome short-
gun sequencing (Venter et al., 1992), genome microarrays (Liu et al., 2006) and
Expressed Sequence Tagging (EST) (Adams et al., 1991) are commonly used. On the
proteomics side, protein microarrays (Petrik, 2006), high performance liquid
chromatography (HPLC), Surface-Enhanced Laser Desorption Ionization - Time Of
Flight (SELDI-TOF) (Elek and Lapis, 2006), Two Dimensional Sodium Do-decyl
Chapter 2
45
Sulfate Poly Acrylamide Gel Electrophoresis (2D SDS PAGE) followed by mass
spectrometry (Lee, 2001), Isotope-Coded Affinity Tags (ICAT) (Allison et al., 2006),
methods are being used. A combinatorial method exploiting more than one of the
above mentioned techniques can prove more useful for better allergen identification
and isolation.
2.1.1 Expressed Sequence Tagging for rapid allergen transcript identification
The sequence tagging approach is one of the most effective approaches towards large
scale expressed proteome profiling. In this technology, a library of directionally cloned
partial DNA sequences from randomly selected cDNA clones (termed as ESTs) is
generated. These clones are then sequenced and the generated sequences are aligned
with the available known nucleotide and protein databases for putative matches. Single
pass sequencing of these clones creates high throughput expressed proteome sequences
for a particular organism spanning various regions of the proteome (Adams et al.,
1991; 1993). This approach has been successfully used in discovering novel expressed
genes in many cell/tissue/organ types (Gong et al., 1994; Gross et al., 2001; Jia et al.,
2001; Escribano and Coca-Prados, 2002). It also provides the profile and abundance of
the expressed genes in the source cDNA library (Adams et al., 1995). The cDNA
library being representative of the expressed genes, ESTs provide a powerful
technique for indirect genome identification. The deduced amino acid sequences from
the cDNAs corresponding majority of the mRNAs help in elucidating the primary
structure of the expressed proteins (Yamamoto and Sasaki, 1997). Moreover,
identification of differentially expressed genes between two states (e.g. normal and
Chapter 2
46
diseased, early and late, juvenile or adult) is possible by using this technique (Schmitt
et al., 1999).
To date, there are over 250 reported publications which used ESTs in identification of
fungal genes. The majority of them concentrate on identification of differentially
expressed genes in pathogenic fungi in order to find out possible pathogenesis related
genes (Mammadov et al., 2005; Sexton et al., 2006); identification of novel enzymes
or other biochemicals for various biotechnological interests (Morrita et al., 2006;
Shibuya et al., 2006). Recently, ESTs were used for identification of fungal allergens
from Beauveria bassiana (Westwood et al., 2006). EST approach by itself does not
provide information about specific proteins and hence, other techniques in
combination with EST are required.
2.1.2 Identification of allergens by 1D and 2D SDS PAGE followed by tandem
mass spectrometry
Proteomic analysis has been one of the most powerful methods for identification of
novel proteins as well as in studying protein expression in organisms under different
environmental conditions (Elinbaum et al., 2002). Along with the transcriptome
analysis, it reveals post-translational regulation and modifications of extracellular
proteins (Oda et al., 2006). In this approach, a 1D or 2D SDS PAGE of the total
protein is used to generate a proteomic profile of the organism. These bands/spots as
generated by the protein gels are cut, trypsinized and sent for tandem mass
spectrometric identifications by Matrix Assisted Laser Desorption/Ionization – Time
Of Flight (MALDI-TOF) and Mass Spectrometry (MS-MS). Mass spectrometry
generates peptide mass fingerprints and peptide fragment ion data which are then used
Chapter 2
47
to search for protein candidates in the NCBI database as well as other locally available
or generated databases. Proteomic identification of the fungal proteins is been used
extensively for various purposes (Brosson et al., 2006; Carberry et al., 2006; Kalari et
al, 2006; Oda et al., 2006). Proteomics method of 2D SDS PAGE followed by mass
spectrometry was used for identification of fungal allergens by a group of researchers
from Taipei Veterans General Hospital, Taiwan. Not so long ago, a serine protease
allergen (Rho m 2) from Rhodotorula mucilaginosa (Chou et al., 2005), enolase from
Penicillium citrinum and Aspergillus fumigatus (Lai et al., 2002) and a 33kDa heat-
labile alkaline serine protease-like allergen from P. citrinum (Shen et al., 1997) were
identified using this method.
2.1.3 Identification of allergens by western blotting
Although, the two methods mentioned earlier are robust and are well known for high
throughput identification of proteins, they identify the underlying genes or proteins by
homology alignments (BLASTX in case of ESTs and BLASTP in case of Proteomics).
Homology alignment may give a clue about the identity of the protein but cannot be
used as confirmative to prove a protein to be an allergen. Hence, immunochemistry is
commonly combined with 1D or 2D SDS PAGE. As the allergens are IgE binding
proteins, they are detected by using patients` sera (containing IgEs) which specifically
bind to the respective allergenic proteins separated on a 1D of 2D protein gel. The
bands/spots are then cut, digested with trypsin to generate random peptides and are
sent for mass spectrometric identification. Western blotting has been commonly used
for identification of molecular weights of the allergenic proteins. Recently, Barbieri et
al. (2005) used this technique to identify the allergenic components from the fungus
Chapter 2
48
Metarhizium anisopliae. Although this technique can identify the putatively allergenic
components in total protein extract, protein identification is not possible.
Hence, in the present study, we combined all the three techniques: Western blotting,
Proteomics and ESTs were combined to obtain the confirmed identity of the allergenic
components. Firstly, putative allergens were obtained by generating ESTs. Total
protein extracts from Curvularia were run on a 1D SDS PAGE and the components
were separated by their molecular weights. These were then transferred to a
nitrocellulose membrane and western blotting (using allergic patients` sera) was
carried out in order to identify the allergenic components. Simultaneously, 2D SDS
PAGE was run to separate these proteins by molecular weights as well as isoelectric
point (PI). Then, these bands/spots (from the corresponding 1D and 2D gels) were cut
and sent for mass spectrometric identification. The generated peptides were then
compared with the in-house generated ESTs as well as with the global protein
databases in order to establish the allergen protein identity as well as to know the
amino acid/nucleotide sequence.
2.2 MATERIALS AND METHODS
2.2.1 Expressed Sequence Tagging of C. lunata for allergen identification
2.2.1.1 Fungal culture and raw material
A pure culture of Curvularia lunata (obtained in-house previously) was cultured in
Erlenmeyer flasks (1L) containing 200 ml of 3% Sabouraud`s liquid medium (Oxoid)
at 28˚C for 12-15 days until sufficient sporulation occurred. This method was preferred
as it was known to yield a highly potent and allergenic extract (Gupta et al., 1999). At
Chapter 2
49
the end of the incubation period, the spore-mycelial mass (fungal mat) was collected in
a 50 ml (Falcon) tubes. The mat was then washed thoroughly with distilled water to
remove spent medium and was lyophilized overnight.
2.2.1.2 Bacterial strains
The following bacterial strains (E.coli) were used for the preparation of C.lunata
cDNA library and ESTs:
XL1-Blue [N1] ∆(mcrA) 183 ∆(mcrCB-hsdSMR-mrr)173 end A1 supE44 thi-1
recA1gyr 1A96 relA1 lac[F’proAB lacI
q
Z ∆M15Tn10(Tetr)]
SOLR
TM
me14-(McrA
-
) ∆(mcrCB-hsdSMR-mrr)171 sbcC recB recJ uvrC
umuC::Tn5(Kan
r
)lac gyrA96 relA1 thi-1 endA1 λ
R
[F’ proAB lacI
q
Z
∆m15)
c
Su
-
BL-21 (DE3) F-ompThsdS
B
(r
-
B
m
-
B
)galdcm(DE3)pLysS
ExAsist ® interference-resistant helper phage (~1.0 x 10
10
pfu/ml). Single-strand size
is 7.3kb [co-migrates with ~5kb of double-strand linear DNA on 1% (w/v) agar].
2.2.1.3 Curvularia lunata mRNA extraction
One gm of the dried fungal mat was powdered with liquid nitrogen. RNA extraction
was performed using RNeasy mini kit (QIAGEN) as per manufacturer’s protocol. The
eluted total RNA was used for further isolation of mRNA using Poly (A) Quick
mRNA isolation kit (Stratagene) as per manufacturer’s protocol.
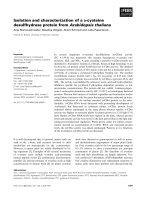
2.2.1.4 Curvularia lunata λZAPII cDNA library
The cDNA library of the extracted C.lunata mRNA (as mentioned above) was
prepared (with the help of Ms. Wong Fei Ling) using uni-ZAP (Stratagene) XR vector
system (Figure 2.1) as per manufacturer’s protocols. A primary library of 10
5
phage
Chapter 2
50
was amplified to generate a higher titer of 10
9
pfu. Inserts of lengths between 0.5 and
2.5 kb were found on preliminary survey.
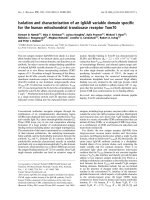
2.2.1.5 Curvularia lunata EST clones
Exassist helper phage was used for pBluescript phagemid excision (Figure 2.2) from
λZAP using the host E.coli, XL1-MRF strain. The single-stranded phagemid was
converted to the double-stranded one using SOLR E.coli strain. Isolated individual
colonies with the phagemid with (cloned cDNA) insert were subcultured onto plates
containing 2% Luria Bertani (LB)-agar (DIFCO) and allowed to grow. A total of 3,000
colonies were picked from the plates and kept as glycerol stock (15% glycerol) at
-80˚C till further use.
These colonies were then inoculated in 5ml of 2% LB liquid medium and cultured for
16-20 hours at 37˚C. Plasmid extraction was performed using QIAprep kit (QIAGEN).
These plasmids were then stored at -20˚C till use. The inserts from the extracted
plasmids were then sequenced from the 5` end.
2.2.1.6 Sequencing of the inserts
Sequencing of the inserts was carried out using ABI Prism
TM
dye terminator cycle
sequencing ready reaction kit (Applied Biosystems). Each 20µl PCR reaction involved
a mixture containing 4µl of BigDye
TM
, 2.5X sequencing buffer (Applied Biosystems),
250-500ng template DNA, 3.2pmol T3 primer and sterile double distilled water to
make up the volume. Thermal cycling steps (30 cycles) were as follows: denaturation
– 96˚C for 30s, annealing - 50˚C for 15s and extension – 60˚C for 4 min. Sequencing
was carried out using PTC-100
TM
thermal Controller (MJ Research).
Chapter 2
51
Figure 2.1: Map of Uni-ZAP XR insertion vector
Figure 2.2: Map of pBluescript SK (+/-) phagemid
Chapter 2
52
Precipitation of the PCR product after sequencing was carried out using 2µl of 3M
sodium acetate, pH 4.6, 50µl of 95% ethanol, 2µl of 125mM EDTA and 10µl of sterile
distilled water. The mixture was centrifuged at 13,000g for 20min after incubation at -
20˚C for 30 min. The pellet was washed with 500µl of 70% ethanol and air dried
before loading it on a sequencer.
Purified products were subjected to ABI Prism (ABI 3100) automated DNA sequencer
(Applied Biosystems). The sequencing services were provided by DNA Sequencing
Laboratory (DSL), Department of Biological Sciences, National University of
Singapore.
2.2.1.7 Sequence analyses of the inserts using various softwares
The electrophoreograms (.ABI files) for various sequenced ESTs were analyzed using
the Phred-Phrap-Cross_Match software package program (Version 10.0) by
CodonCode Corporation (USA). This software package helps in analyzing the EST
electrophoreogram sequences for base calling, sequence assembly and comparisons by
classifying the sequences into various contigs. Firstly, the sequences were subjected to
Phred (Ewing and Green, 1998; Ewing et al., 1998; Green and Ewing © 1993-1996)
for reading the DNA sequencing trace files, base calling and assigning sequence
quality value to each called base. The quality value is an error probability (log-
transformed) given by the formula; Q= -10 log
10
(P
e
), where Q is the quality value and
P
e
is the error probability of a particular called base. PHD2FASTA software then
extracted information from the Phred (.phd) files and created input files for next
program. Briefly, this software transformed all the sequences from .ABI files to
.FASTA format. Further, these transformed sequences were analyzed using
Chapter 2
53
Phrap/Cross_Match (Green, © 1994-1996) software. Briefly, the Cross_Match
software compares a set of reads to a set of vector sequence and produces vector-
masked versions of the reads screens and trims it. The edited sequences are then
analyzed by Phrap to generate contig sequence (mosaic of the highest quality read
segments) rather than generating consensus sequences providing extensive assembly
information which then aids in trouble-shooting assembly problems and ability to
handle large datasets. The sequences were assembled and grouped into different
contigs as explained above. Sequences that were not in any contigs were considered as
singletons.
2.2.1.8 Redundancy analysis of the analyzed EST sequences
Redundancy reflects the nature of the generated ESTs. The % Redundancy Vs No. of
ESTs plot reflects the trend of ESTs being classified into contigs. When this plot
reaches a plateau, it suggests that the ESTs are getting more and more redundant. This
means that the chance of getting novel sequences is getting lesser and lesser. Hence,
when the plot saturates, it is advisable to stop further sequencing as it will just yield
redundant sequences.
The assembled sequences were analyzed for contigs and reads with sets of 100
sequences with subsequence increments of 100 sequences in following sets in order to
find the redundant sequences. Percentage redundancy Vs number of analyzed ESTs
was plotted in order to obtain the % redundancy for the analyzed ESTs, where
%Redundancy = (The total ESTs represented by all contigs – No. of contigs) / Total
no. of analyzed ESTs.
Chapter 2
54
2.2.1.9 Sequence homology search for the ESTs and cataloguing into various
biochemical groups
Sequence similarity may aid in identification of the putative function of the generated
ESTs; as sequence identity may also infer functional identity. Hence, the edited
sequences (after vector sequence trimming) were analyzed against a non-redundant
protein database in the GenBank using BLASTX (translated query vs. protein
database) sequence alignments for putative functions. Identification was generally
based on high sequence identity over a long length of sequence. So, results with E-
values <0.001, Bit score <100 and 6-8 contiguous amino acid similarity were
considered as significant identities. The sequence alignments were done with the help
of National Center for Biotechnology Information (NCBI) site
(www.ncbi.nlm.nih.gov/BLAST). The sequences with significant identities (after
BLASTX) were catalogued according to their putative biological functions. Various
biochemical categories used in this catalogue were based on Adams et al., (1993)
classification system with some modifications (a category with sequences showing
similarity to allergens was also included).
2.2.2 Identification of allergens by Proteomics and Western Blots
2.2.2.1 Total protein extraction of the cultured fungus
Total protein extraction was carried out using trichloroacetic acid (TCA) / acetone
method. 1g of dried fungal mat was powdered with liquid nitrogen. 10 ml of TCA
extraction solution (10% TCA, 0.007% DTT) was added to the powder and incubated
at -20˚C for 1-2 hours. The pellet, after centrifuging (35, 000g for 20 min at 4˚C) was
Chapter 2
55
washed three times with sample washing solution (0.007% DTT in acetone) with an
hourly interval of incubation in -20˚C between washes. The pellet was then lyophilized
and incubated at -20˚C until use.
2.2.2.2 One-dimensional sodium dodecyl sulfate – polyacrylamide gel
electrophoresis (1D SDS-PAGE)
SDS-PAGE (17cm) was performed as per Laemilli`s method (Laemilli, 1970) under
reducing conditions. The resolving gel contained 14% (w/v) acrylamide, 0.04% (w/v)
bis-acrylamide, 375mM Tris-HCl pH 8.8 and 0.1% (w/v) SDS. Ammonium persulfate
(1mg/ml) and 0.04% (v/v) TEMED was used for polymerization. The stacking gel
consisted of 4.5% (w/v) acrylamide, 0.12% (w/v) bis-acrylamide, 125mM Tris-HCl
pH 6.7 and 0.1% (w/v) SDS and was polymerized as mentioned above for the
resolving gel. Extracted protein samples (from the fungal extracts) were dissolved in
protein sample buffer (10mM Tris-HCl pH 6.8, 1% SDS, 1% β-mercaptoethanol, 1%
glycerol and 0.01% bromophenol blue) for 8-10 min. The denatured extracts were then
loaded onto the gel and electrophoresis was carried out in SDS-PAGE electrophoresis
buffer (25mM tris-base, 0.19M glycine pH 8.3, 0.1% (w/v) SDS) at 80V for 15min,
100V till the gel was completely run. After electrophoresis, protein gels were stained
with Coomassie Brilliant Blue R250 [0.25% (w/v) Coomassie brilliant blue in
methanol: glacial acetic acid: water ::: 10:10:80]. For half an hour followed by de-
staining overnight in 10% acetic acid (v/v) and 10% methanol (v/v). The separated
proteins were compared with broad range protein marker mix (Bio-Rad Laboratories).
Chapter 2
56
2.2.2.3 Two-dimensional sodium dodecyl sulfate – polyacrylamide gel
electrophoresis (2D SDS-PAGE) and staining
For the first dimension, isoelectric focusing (IEF) was carried out. Total protein
extraction was carried out using TCA, as mentioned earlier. Around 600µg protein
sample was then dissolved in sample buffer [9M urea, 4% (w/v) CHAPS, 100mM
Dithiothreitol, 0.2% (v/v) Bio-Lytes ampholytes pH 3-10 (Bio-Rad Laboratories), 35
mM tris base]. After centrifugation at 10, 000 g for 10 min, the supernatant was
dissolved in rehydration buffer [8M Urea, 10mM dithiothreitol, 0.5% (w/v) CHAPS
and 0.2% (v/v) Bio-lytes ampholytes pH 3-10 (Bio-Rad Laboratories)] and applied to
IEF with an immobilized pH gradient gel (IPG) strip [17 cm long ReadyStrip IPG
strips, pH 3-10 NL (Bio-Rad Laboratories)]. IEF was carried out using PROTEAN
®
IEF Cell (Bio-Rad Laboratories) according to the manufacturer’s protocol. The IEF
steps were as follows: active rehydration for 12-16 hours at 50V, 250V for 15 min,
8,000V for 4 hours followed by linear voltage ramping to reach 80, 000Vh. Reduction
and alkylation of the proteins on the strips was achieved by incubating with 130mM
Dithiothreitol and 135mM Iodoacetamide respectively in equilibration buffer [6M
urea, 0.375M tris-HCl, pH 8.8, 2% (w/v) SDS, 20% (v/v) glycerol] at room
temperature for 15 min each. After IEF, the strip was loaded onto second dimension
separation of proteins which was performed by running SDS-PAGE as described
earlier. The separated proteins were compared with broad range protein marker mix
(Bio-Rad Laboratories). After running the gel, it was incubated overnight in Fixative
solution [50% (v/v) methanol and 10% (v/v) acetic acid]. Instead of staining the gels
with Coomassie Brilliant Blue, silver staining was carried out. The gels were removed
Chapter 2
57
from the fixative solution and washed three times with distilled water for 15 min each
with gentle shaking. The gels were then washed with 0.02% (w/v) Sodium thiosulfate
reagent followed by two washes with distilled water for 1 min each. After washing, the
gels were stained with Silver nitrate reagent [0.2 % (w/v) silver nitrate, 0.02 % (v/v)
formaldehyde], followed by two washes with distilled water for 1 min each.
Development of the color was achieved by using development solution [3% (w/v)
sodium carbonate, 0.05% (v/v) formaldehyde]. After staining the gels, 1.6% (w/v)
EDTA was used to stop the color development. Gels were incubated in this solution
for 10 min with gentle shaking followed by three washes with distilled water for 10
min each. The gels were then incubated in distilled water till further use.
Western Blotting to identify the IgE binding proteins in the fungal extract
The proteins separated in SDS-PAGE were electro-blotted (Towbin et al., 1976) using
transfer buffer (25mM tris-base, 192mM glycine, 20% (v/v) methanol, pH 8.3) on
PolyVinylidine DiFluoride (PVDF) membrane (Hybond-PVDF, Amersham
Biosciences) overnight on 30V at 4˚C). The membrane was then blocked with 5%
(w/v) skimmed milk (Anlene) in PBS [0.8% (w/v) NaCl, 0.02% (w/v) KCl, 0.144 %
(w/v) Na
2
HPO
4
and 0.024% (w/v) KH
2
PO
4
, pH 7.4] for 1 h. Following the blocking
step, the membranes were washed three times (15 min, 10 min and 7 min respectively)
with PBST [PBS with 0.05% (v/v) Tween 20] at room temperature. The membranes
were then incubated with atopic patients` sera as well as controls overnight at 4˚C.
After washing three times with PBST as mentioned earlier, the membrane was
incubated with 1:1000 diluted horse radish peroxidase (HRP) conjugated anti-human
IgE secondary antibody (Sigma A9667) for 1 h at room temperature. IgE binding
Chapter 2
58
protein bands were visualized using ECL
TM
Western blotting detection reagents
(Amersham) as per manufacturer’s protocol.
2.2.2.4 Tandem Mass Spectrometric analyses
The bands corresponding to the IgE binding bands as obtained from the 1D western
blots (as described above) were cut from the simultaneously run and Coomassie
stained 1D SDS PAGE. Also, various spots were cut from the 2D SDS PAGE. The
excised protein bands/spots were then digested with 0.1µg/µl of modified, sequencing
grade Trypsin (Promega). The details of trypsin digestion protocol can be obtained
from MALDI-TOF-TOF mass
spectrometric analysis of the generated tryptic peptides was carried out at The Proteins
and Proteomics Centre (PPC), Department of Biological Sciences, National University
of Singapore, Singapore ( Analysis
was performed using an intranet version of MASCOT 1.7 (MATRIX SCIENCE), with
the peptide masses assumed to be monoisotopic and protonated ions, allowing some
peptide modifications viz. cysteine carbamidomethylation, protein N-acetylation and
methionine oxidation. Scores greater than 78 were considered as significant (p<0.05).
The maximum number of missed cleavages and the peptide mass tolerance was set to 1
and ±110 ppm respectively. Fragment mass tolerance was set to ±0.2 Da. Some of the
randomly selected peptides were further sent for MS/MS analysis in order to obtain a
peptide summary report which would give a better picture of the results. The processed
data was then searched against NCBI database as well as the in-house generated
C.lunata EST sequences via a Mascot search engine in order to find the identity as
Chapter 2
59
well as the exact cDNA sequence of the obtained peptides and hence the excised
bands/spots on 1D as well as 2D SDS PAGE.
2.3 RESULTS AND DISCUSSION
2.3.1 Expressed Sequence Tagging of C. lunata for allergen identification
2.3.1.1 Curvularia lunata cDNA library
A cDNA library represents information of the encoded mRNA giving a brief picture of
the pattern of expression for the organism/state/condition under study. The cDNA
library of C.lunata was made with a mixture of mycelial fragments as well as spores.
This was done to ensure that none of the allergenic proteins expressed specifically in a
particular stage would be missed and hence a full repertoire of C.lunata expressed
allergens would be obtained. A non-normalized library was used in order to know the
expression levels of various transcripts as well as possible variants present in the
fungal genome.
2.3.1.2 Sequencing of C.lunata ESTs
Single pass sequencing of each EST (5` to 3`) was carried out. Sequencing from 5`-3`
end would help in identifying transcription/translation start sequence for individual
Open Reading Frames (ORFs) and avoiding 3` untranslated regions (3` UTRs) as well
as the polyadenylation signals providing with a possibility of getting a full-length
sequence for a particular ORF. Moreover, 5` ESTs are considered as gene family
specific ESTs as the genes belonging to the same family tend to have a conserved
functional motif and hence might be conserved at their respective 5` ends (Hillier et
Chapter 2
60
al., 1996). Out of the sequenced ESTs, a total of 1683 ESTs passed the criteria of
Phred and Phrap/Cross_Match analysis.
2.3.1.3 Assembly of the ESTs into contigs/singletons and redundancy analysis
For the 1600 ESTs analyzed, 891 (55.7%) ESTs were represented in 201 contigs.
Remaining 709 (44.3%) ESTs were classified as Unigenes. Unigenes contained
contigs with one EST (125) or singletons (584). Phrap may consider a contig with one
EST when the EST is homologous with other contig, but the homologous score is
lower than the allowed score to assemble it into that contig. Hence, the contigs which
remained with single EST were then considered as unigenes. The largest contig
contained 98 ESTs whilst the smallest contig had 2 ESTs.
EST redundancy percentage was calculated with the following formula, %Redundancy
= [(Total no. of ESTs represented by all contigs – No. of contigs)/Total no. of ESTs
analyzed] x 100. The details of the % redundancy calculations for consecutive 100
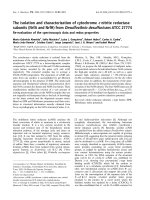
ESTs analyzed are as shown in Table 2.1 and Figure 2.3. As seen from the Table, %
redundancy for C.lunata was found to be around 43%. This means that there was a
43% probability that a new EST from C.lunata obtained after this would already be
represented in the current data set. Hence, no more sequencing of ESTs was carried
out and the available 1683 ESTs were used for further cataloguing and analysis.
C.lunata redundancy was similar to that of the dust mite Dermatophagoides farinae
ESTs (~43%) generated in-house. The redundancy rate of other in-house ESTs from
the dust mites Blomia tropacalis and Tyrophagus putrescentiae was comparatively
lower (~30%). This could be due to the difference in the quality of cDNA libraries
constructed or due to the normalization of the libraries carried out by pre-hybridization
Chapter 2
61
Table 2.1: % Redundancy rate for C.lunata ESTs
*No. of Unigenes = No. of contigs with single EST + No. of singletons
Sequences
analyzed
Total
No.
No. of
Unigenes*
No. of
contigs
ESTs represented
by all contigs
%
Redundancy
First0100
0100
079 009 021 12.00
First0200
0200
142 020 058 19.00
First0300
0300
181 033 119 28.66
First0400
0400
229 041 171 32.50
First0500
0500
281 050 219 33.80
First0600
0600
319 066 281 35.83
First0700
0700
350 081 350 38.42
First0800
0800
408 086 392 38.25
First0900
0900
451 100 449 38.77
First1000
1000
494 114 506 39.20
First1100
1100
508 135 592 41.50
First1200
1200
545 150 655 42.00
First1300
1300
603 159 697 41.38
First1400
1400
644 170 756 41.85
First1500
1500
679 184 821 42.47
First1600
1600
709 201 891 43.13
Figure 2.3: Percentage Redundancy rate for C.lunata ESTs
0
10
20
30
40
50
100 300 500 700 900 1100 1300 1500
Number of ESTs
Redundancy (%)
Chapter 2
62
of the cDNA library with highly redundant clones. Although pre-hybridization would
allow the occurrence of the poorly expressed genes, a non-normalized library (in case
of C.lunata) can be explored for the presence of gene polymorphisms, alternative
transcripts and for differential levels of gene expression (Lee et al., 1995; Burke et al.,
1998; Buetow et al., 1999).
2.3.1.4 BLASTX homology alignments of ESTs to search for putative function
All the trimmed ESTs after the Phrap/Phred analysis were subjected to BLASTX
search alignments at NCBI website (www.ncbi.nlm.nih.gov/BLAST). BLASTX
compares 6 frames of a translated query nucleotide sequence (ESTs) against GenBank
non-redundant protein sequence database. Identification of the homologs was based on
high sequence similarity over a contiguous stretch of amino acids. The significance of
the given alignment with score (S) is represented by the expect value (E-value). E-
being the expected number of chance alignments with a score S or better is inversely
proportional to S. An E-value of 10
-3
was used as an optimal cut-off. This cut-off was
previously standardized in-house by comparing the percentage of non-significant
identity with various E-values as possible cut-offs for a set of 1000 ESTs.
2.3.1.5 Putative biological function assignments to the respective ESTs
The putative allergens were classified into 11 biochemical groups based on BLASTX
match with a known protein. The 11 groups are as follows: 1) Allergens, 2) Defense
and homeostasis related proteins, 3) Gene expression and protein synthesis, 4)
Hypothetical proteins, 5) Metabolism related proteins, 6) Nucleotide biosynthesis
related proteins, 7) Proteases and inhibitors, 8) Structure, cell surface and motility
related proteins, 9) Cell signaling and communication related proteins, 10)
Chapter 2
63
Unclassified proteins and 11) Proteins with unknown homology (Unknown proteins).
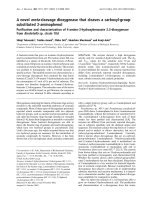
Figure 2.4 as well as Table 2.2 demonstrates the frequencies of ESTs falling into 11
different biochemical groups. As per Adams et al., (1995), a useful library had at least
50% new genes, a broad variety of the transcripts and not more than 20% of
uninformative sequences. C.lunata EST library satisfies these criteria where there were
around 800 (47.5 %) of the ESTs which had unknown homology. The rest of 52.7%
sequences had significant matches (E-value < 10
-3
). Moreover, the matched ESTs
could be classified into various biochemical groups which suggested a broad variety of
the generated transcripts. The majority of genes which matched a known protein fall
into the category of general house-keeping proteins like metabolism (21.5%), gene
expression/protein synthesis (7.5%) and nucleotide biosynthesis (3.2%) related
proteins, suggesting their high redundancy to be a reflection of high level of
expression of these house-keeping genes rather than an artifact of the library. A total of
77 (4.6%) ESTs belonged to structural proteins and 22 (1.3%) ESTs belonged to the
group of proteins involved in cell signaling and communication. Being a known plant
pathogen, C.lunata was thought to have abundance of proteases and proteins related
defense related proteins inhibitors. This is so because the proteases aid in the entry of
the pathogen by dissolving the host membranes and other matrix proteins. On the
contrary, only 9 (0.6%) as well as 13 (0.8%) ESTs belonged to proteases/inhibitors and
defense related proteins respectively; which was surprising. About 87 (5.2%) ESTs
showed similarity to hypothetical ORFs as well as proteins from other organisms. Due
to the increasing number of fungal as well as non-fungal genomes being sequenced,
many putative ORFs generated are attributed as ‘hypothetical proteins’.
Chapter 2
64
Figure 2.4: Classification of C.lunata ESTs (1683) into biochemical groups
(Adapted from Adams et al., 1993)
32
22
77
13
126
87
364
54
9
99
800
0 100 200 300 400 500 600 700 800 900
Allergens
Cell signaling & Communication
Structure/Cell surface/Motility
Defense and Homeostasis
Gene expression/Protein Synthesis
Hypothetical proteins
Metabolism
Nucleotide biosynthesis
Proteases and Inhibitors
Unclassified proteins
Unknown proteins
No. of ESTs
Table 2.2: Classification of C.lunata ESTs (1683) into biochemical groups
(Adapted from Adams et al., 1993)
Biochemical Group Number (%)
Unknown proteins (No BLASTX match) 800 (47.5)
Unclassified proteins 99 (5.9%)
Structure/Cell surface/Motility 77 (4.6%)
Proteases and Inhibitors 9 (0.6%)
Nucleotide biosynthesis 54 (3.2%)
Metabolism 364 (21.5%)
Hypothetical proteins 87 (5.2%)
Gene expression and Protein synthesis 126 (7.5%)
Defense and Homeostasis 13 (0.8%)
Cell signaling and Communication 22 (1.3%)
Allergens 32 (1.9%)
TOTAL 1683
Chapter 2
65
This is the reason why some of the C.lunata ESTs showed matches with the
hypothetical proteins. Similarly around 6% of the ESTs were labeled as ‘Unclassified
proteins’. These ESTs had significant match with a protein in the NCBI database but
the protein did not have a function (cysteine rich proteins) and hence were kept under
one group as unclassified proteins. Although such proteins are currently classified as
‘hypothetical’ or ‘unclassified’, with time and detailed studies of such proteins, it
would be possible to annotate functional attributes to such proteins. A high number of
unknown proteins (47.5%) suggest that there are still many genes of interest present in
C.lunata which could be further studied in detail. Hence, the high number of unknown
proteins suggests that the EST strategy serves as a very good tool for identifying novel
expressed genes from an organism. A total of 32 (around 2%) ESTs were classified as
‘Allergens’ as they showed significant sequence similarity with known allergens.
2.3.1.6 Putative allergenic proteins obtained from C.lunata EST database
Due to the availability of EST catalogues for C.lunata, many putative allergen
homologs could be identified. Out of the 32 different allergen hits obtained, 14
different types of putative allergens were identified. The identified allergen types
could be classified into fungal as well as non-fungal allergen hit types (Table 2.3). As
expected, 12 different types of fungal allergen homologs were obtained. This is due to
the conserved phylogeny amongst different fungi which might be responsible in
generating similar fungal allergenic proteins. Two non-fungal (pollen) allergen hits
were obtained.
Chapter 2
66
Table 2.3: ESTs of C.lunata showing similarities to the known allergens
P
: Partial EST sequence.
*
: ESTs showing sequence similarity with more than one
known allergens.
U
: EST hits with allergens with unknown biochemical functions
No.
Identity to known allergens
No. of
ESTs
Variants
Fungal Homologs
1
Asp f 2
U
[Aspergillus fumigatus] 1
2
Asp f 6 (Manganese Superoxide Dismutase, MnSOD)
[Aspergillus fumigatus]
3
2
3
Asp f 7
PU
[Aspergillus fumigatus] 1
4
Asp f 15
U
precursor (Asp f 13) [Aspergillus fumigatus] 1
5
Pen n 18/Asp f 1
P*
(Vacuolar Serine Protease)
[Penicillium notatum, Aspergillus fumigatus]
2
-
6
Pen c 19/Cla h 4
P*
(Heat Shock Protein 70)
[Penicillium citrinum, Cladosporium herbarum]
1
7
Alt a 10/Cla h 3
P*
(Aldehyde Dehydrogenase)
[Alternaria alternata, Cladosporium herbarum]
2
2
8
Can a 1
P
(Alcohol Dehydrogenase) [Candida albicans] 2
-
9
Cop c 2 (Thioredoxin) [Coprinus comatus] 10
-
10
Mal f 4
P
(Malate Dehydrogenase) [Malassezia furfur] 2
2
11
Asp f 11 / Bet v 7
*
(Cyclophilin) [Malassezia
sympodialis, Betula verrucosa]
3
-
12
Tri r 4
P
(Serine Protease) [Trichophyton rubrum] 1
Pollen Homologs
13
Jun o 2 (Ca
+2
binding protein) [Juniperus oxycedrus] 1
14
Par j 3/Hev b 8
*
(Profilin) [ Parietaria judaica, Hevea
brasiliensis]
2
-
Total 32
Chapter 2
67
Most of the allergen hits showing similarity with known fungal allergens showed
similarity to the allergens from Aspergillus fumigatus viz. Asp f 2, Asp f 6, Asp f 7,
Asp f 11 and Asp f 15. Nine out of the obtained 32 ESTs with similarity to putative
allergens belonged to A. fumigatus allergens. Moreover, the majority of the obtained
putative allergens showed similarity to allergens from Aspergillus, Cladosporium and
Alternaria species as they all (including C. lunata) are ascomycetous fungi. Some
allergen homologs of a basidiomycete fungus (Malassezia furfur) were also obtained.
Among the fungal allergen homologs obtained, the highest number of ESTs (10)
matched Cop c 2 (Thioredoxin) allergen suggesting higher expression levels of these
proteins. This might be due to the fact that thioredoxins play multiple roles in cellular
processes such as proliferation, apoptosis and gene expression (Cho et al., 2001).
The biochemical functions for the allergens Asp f 2, 7 and 15 have not been
characterized while the rest of the allergens have been characterized for their
biochemical functions as shown in Table 2.3. ESTs with sequence similarities to Asp f
7, Pen n 18, Pen c 19, Can a 1, Alt a 10, Mal f 4 as well as Tri r 4 were found to have
partial sequences (due to the truncations at the 3` ends). The rest of all the sequences
were found to be full-length protein sequences bearing start codon (ATG) as well as
the stop codons at the 5` and 3` ends respectively. The 2 non-fungal allergen hits
matched to those of pollen allergens (Jun o 2 as well as Par j 3/Hev b 8).
Enolase has been known be an important allergenic protein in various fungi e.g. Asp f
22w (Aspergillus fumigatus) 46, Pen c 22w (Penicillium citrinum), Alt a 6
45(Alternaria alternata), Cla h 6 (Cladosporium herbarum) [Achatz et al., (1995)].
Recently, enolase from C. lunata has also been isolated, cloned, expressed and purified