Isolation and characterization of allergens from curvularia lunata 3
Bạn đang xem bản rút gọn của tài liệu. Xem và tải ngay bản đầy đủ của tài liệu tại đây (769.79 KB, 33 trang )
Chapter 3
97
CHAPTER 3:
CLONING, EXPRESSION AND IMMUNOLOGICAL
CHARACTERIZATION OF THE RECOMBINANT
Curvularia lunata PUTATIVE ALLERGENS
Chapter 3
98
3.1 INTRODUCTION
In order to further understand and establish the allergenicity of the various putative
allergens of Curvularia lunata, immunological characterization of the putative
allergens was performed. The first and foremost step towards the characterization of
these allergens involved generating the recombinant proteins for these putative
allergens. As some of the ESTs already had a full-length putative allergen (as per
BLAST X alignment), the sequences were sub-cloned and expressed. For the ESTs
which possessed truncated allergen sequences (generally on the 5` end), the rapid
Amplification of cDNA Ends (RACE) strategy was used. These putative allergen
genes were cloned, expressed and a purified recombinant protein was obtained. These
proteins were then further used for characterization to confirm the allergenicity of
these recombinants.
3.2 MATERIALS AND METHODS
3.2.1 Cloning and Expression of the isolated putative C. lunata allergens
3.2.1.1 General analysis of the C. lunata putative allergens
Various putatively allergenic C. lunata sequences as isolated earlier were further
analyzed in order to ascertain whether the obtained sequences (from the ESTs) were
the full-length open reading frames or truncated. A total of 14 different types of
allergens were obtained. Out of these, 7 contained full-length open reading frames.
The full-length of the open reading frames was confirmed by comparing with known
allergens using BLASTX alignments and also by checking for the Start/Stop codons.
The initiation sites were predicted by checking for the Kozak consensus sequence
Chapter 3
99
(Kozak, 1984). For the rest of the sequences which were not full-length, RACE
strategy was utilized.
3.2.1.2 RACE amplification of the truncated putative allergen sequences
For the remaining 7 truncated sequences, SMART
TM
RACE cDNA amplification kit
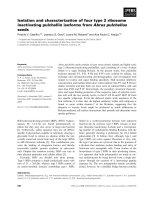
(BD Bioscience) was used as per the manufacturer’s protocol. An overview of the
RACE procedure is given in Figure 3.1. The figure is taken from the SMART RACE
cDNA amplification kit (K1811-1) user manual. Finally, all the DNA sequence of all
the sequences was confirmed three times in order to get the exact sequence.
3.2.1.3 Allergen submission to NCBI and nomenclature
The sequences which were supposed to be used for further characterization were
submitted to NCBI and were also given allergen names as per the International Union
of Immunological Societies (IUIS) – Allergen Nomenclature Subcommitee
nomenclature system. Since Cur l 1 and Cur l 2 are already published, the allergens
were named accordingly, i.e. Cur l 3 and so on.
3.2.1.4 Cloning of the putative allergens
Cloning/expression of the allergens was done using commercially available bacterial
expression kits due to their diverse, rapid and inexpensive nature as well as the ease of
having a broad selection of fusion proteins, affinity purification tags. Moreover,
protein yields for the bacterial expression systems are higher as compared to other
expression systems available. The pET expression system (Novagen) was chosen due
to its higher protein expression yields, specificity, inducibility, increased solubility and
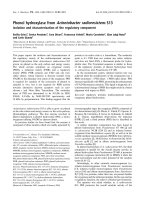
overall stability of the proteins. Moreover, there is a hexa-histidine tag which can be
used for Nickel based affinity chromatographic purification (Figure 3.2).
Chapter 3
100
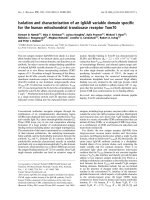
Figure 3.1: Overview of the SMART RACE procedure [Taken from SMART
RACE cDNA amplification kit (K1811-1) user manual]
Total RNA was used for the RACE amplification of the Curvularia lunata allergens
Chapter 3
101
Moreover, this vector involves ligation independent cloning (LIC) technology which
bypasses the traditional digestion/ligation steps. A simple annealing of the inserts
(with overhangs generated via PCR) to the vector is used. Furthermore, enterokinase
(Ek) can be used to remove the fusion protein. Hence the vector is called pET32
Ek/LIC vector.
Ligation independent cloning was carried out using the pET expression system
(Novagen) as per the manufacturer’s protocol. Briefly, total RNA was reversed
transcribed with the iScript cDNA Synthesis Kit (Bio-Rad Laboratories). Signal
peptide sequence if present was removed from the full-length allergen sequence,
Prediction of the signal peptide cleavage site was based on the (-3-1) rule (von Heijne,
1986) and was achieved using the Signal P software version 1.1 (Nielsen et al., 1997).
Primers for polymerase chain reaction (PCR) amplification were designed according to
the 3’ and 5’ ends of the respective open reading frames. Each primer pair however
had a 5’- GAC GAC GAC AAG ATX-3’ and 5’-GAG GAG AAG CCC GGT-3’
overhangs respectively at the sense and anti-sense ends, rendering them compatible for
pET32a vector annealing. The list of specific primers used is given in Table 3.1.
PCR amplification was performed using Expand Long Template PCR System (Roche
Diagnostics) possessing proofreading activity. A 50µl reaction consisted of 0.5µl of
each primer (100µM), 5µl of Expand Long Template Buffer 1, 2µl of dNTP (10µM),
3µl of cDNA and 1µl of Expand Long Template Enzyme mix containing the
thermostable DNA polymerases Taq and Tgo. Thermocycling conditions consisted of
an initial denaturation at 94ºC for 10 min, followed by 30-35 cycles starting with 94ºC
for 10s, 50-53ºC for 30s and 68°C for 1 min if the insert size is less than 1kb, and an
Chapter 3
102
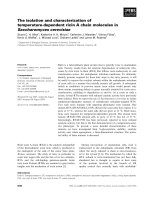
Figure 3.2: Schematic diagram of the pET32Ek/LIC vector showing locations of
various solubility as well as affinity tags (Taken from www.emdbiosciences.com)
Figure 3.3: Strategy used for directional cloning using pET32Ek/LIC vector
(Taken from www.emdbiosciences.com)
Chapter 3
103
Table 3.1: Sequences of the primers used for the cloning of C. lunata allergen
sequences into pET32Ek/LIC vector
The sequence of the forward primer (F) is shown first, followed by that of the reverse
primer (R).
Each forward primer has a 5’- GACGACGACAAGATX-3’ and each reverse primer
has 5’-GAGGAGAAGCCCGGT-3’ overhangs on the 5` as well as 3` ends
respectively for proper annealing with the pET32/EkLIC vector.
Allergen Primer Sequences for cloning into pET32Ek/LIC
F: 5’- GACGACGACAAGATGGAACTGCATCACAGC - 3`
Cur l 3
R: 5’- GAGGAGAAGCCCGGTTTAAATAGACGCTTT - 3`
F: 5’- GACGACGACAAGATGAGCGAAGAAACCAAG - 3`
Cur l 4
R: 5’- GAGGAGAAGCCCGGT TTACTCGTAGTTGGAC - 3`
F: 5’- GACGACGACAAGATGTCCAACCCCCGTGTT - 3`
Cur l 5
R: 5’- GAGGAGAAGCCCGGTTTATAGCTGGCCGGAC - 3`
F: 5`- GACGACGACAAGATGGATCTCTTCAAGAAGACACTCAAGCCC - 3`
Cur l 6
R: 5`- GAGGAGAAGCCCGGTCTACAACTCGTCGTGGTCCTGGG - 3`
F: 5`- GACGACGACAAGATCCACGAGGCTGAGAACGCCGT - 3`
Cur l 7
R: 5`- GAGGAGAAGCCCGGTCTACAACTCGTCGTGGTCCTGGG - 3`
F: 5’- GACGACGACAAGATGCGCTCGCTCGGCCAG - 3`
Cur l 8
R: 5’- GAGGAGAAGCCCGGTTTACTTCTGCATCAT - 3`
F: 5’- GACGACGACAAGATGCTCCAAAAGGGTCTT - 3`
Cur l 9
R: 5`- GAGGAGAAGCCCGGTTTAGCAAGGTTGATG - 3`
F: 5`- GACGACGACAAGATGAGCAACATTCCCCAAGAG - 3`
Cur l 10
R: 5`- GAGGAGAAGCCCGGT TTACTTGGATGTGTCGAG - 3`
F : 5`- GACGACGACAAGATCACTGTCAGCTACGACCCG - 3`
Cur l 11
R: 5`- GAGGAGAAGCCCGGT TTAAAGACCGCAGTTGCT - 3`
F: 5`- GACGACGACAAGATCATCACTGTCTACGACAACTCTGGCG - 3`
Cur l 12
R: 5`- GAGGAGAAGCCCGGTTTAGACGACGCTCCATGAGGCC - 3`
F: 5`- GACGACGACAAGATCCCCACCGACTTTGATCCTAGCAA - 3`
Cur l 13
R: 5`- GAGGAGAAGCCCGGTTCAGCCTGCACGACACGGAA - 3`
F: 5'- GACGACGACAAGATGTCCTGGCAAGCATAC - 3`
Cur l 14
R: 5’- GAGGAGAAGCCCGGTTTAACGTACAAAAGA - 3`
Chapter 3
104
additional 1min for every 1kb increase in insert size. The final extension was done at
68ºC for 4-7 min, depending on insert size. Agarose gel electrophoresis was further
carried out on 1% agarose in tris-acetate-EDTA (TAE) buffer (40mM Tris-acetate,
1mM EDTA, pH 8). The required product was recovered after gel electrophoresis with
QIAquick Gel Extraction Kit (QIAGEN), as per manufacturer’s instructions. The
GeneRuler™ 1kb DNA Ladder (MBI Fermentas) was loaded as a standard for
comparison. All DNA quantification was done using the SmartSpec™ Plus
Spectrophotometer (Bio-Rad Laboratories). To confirm the identity of the amplicon,
DNA sequencing was performed as explained earlier.
Single stranded overhangs complementary to the pET32 Ek/LIC vector were generated
on the extended specific insert by the 3´→ 5´ exonuclease activity of T4 DNA
polymerase (Novagen) in the presence of dATP (Promega). The exonuclease removes
nucleotides from the PCR product obtained from the previous section until it
encounters an adenosine residue, after which the exonuclease activity is counteracted
by the 3 5´ polymerase activity of the same enzyme (Figure 3.3). For the T4 DNA
polymerase treatment, the amount (µl) of the purified PCR product to be added was
calculated using the formulae: [{(Number of base pairs of the insert x 650)/5000} x
{1/2(concentration of the DNA in µg/ml)}]. This calculated amount of the product was
added to a sterile tube containing 10x T4 DNA Polymerase buffer, 0.5µl of dATP
(50mM), 0.2µl of T4 DNA Polymerase (2.5 units/ml) and topped up to 10µl with
nuclease-free water. The tube was then incubated at 22°C for 30min, followed by 75°C
for 20 min.
Chapter 3
105
The Ek/LIC vector containing the specific non-complementary single-stranded
overhangs (allowing directional cloning without restriction enzymes) was annealed to
the previously generated T4 polymerase treated product. Briefly, 0.5µl of the vector to
1µl of the product was incubated for 5 min at 22°C followed by the addition of 0.5µl
of 25mM EDTA. The annealing was allowed to occur at room temperature for 1-2h,
and the products were stored at 4°C until further use.
The annealed insert-vector plasmids (1 µl) were then transformed, using a heat shock
treatment (40 min on ice, 90s at 42°C, 2 min on ice) into 50µl of DH5α competent
cells. This mix was then incubated with 900µl of LB broth at 37°C for 45 min with
constant shaking at 200 rpm. After incubation, the broth was centrifuged at 13,000 rpm
for 15s and 900µl of LB broth was removed and the remaining broth was resuspended
and plated on LB agar containing ampicillin (100µg/ml) plates. Plates were then
incubated for 16 h at 37°C and the transformants were selected.
The transformant colonies were then picked and suspended in 6µl of sterile water, out
of which 1µl was used as the template in the PCR. A ten-reaction master mix consisted
of 10µl of 10X Buffer, 2µl of primers specific for the Ek/LIC Vector, 2µl of dNTP
(10µM), 6µl of 25mM MgCl
2
and 1µl of Taq Polymerase was topped up to 90µl with
autoclaved water. The cycling conditions were set at 95ºC for 5 min, followed by 35
cycles of denaturation (94ºC for 30s), annealing (50ºC for 30s) and extension (72ºC for
1min if the insert size was less than 1kb, and an additional 1 min for every 1kb
increase in size). Final extension was carried out at 72ºC for 4-7 min. After PCR,
agarose gel electrophoresis was performed to confirm the size of the insert in the
transformants.
Chapter 3
106
The transformant colonies showing proper sized insert was inoculated overnight in LB
broth containing 100µg/ml of ampicillin and were incubated at 37°C at 230 rpm
overnight. Plasmid extraction was then carried out using the QIAprep Spin Miniprep
Kit (QIAGEN) and sequenced to confirm the inserts.
Upon confirmation of the size and sequence of the allergen inserts, the extracted
plasmids were transformed into BL21 E.coli cells (same as that of DH5α).
Transformants were checked for size and glycerol stocks of the transformants with
correct insert were prepared and stored in -80°C for future use.
3.2.1.5 Protein expression of the putative allergens
Transformant colonies having correct allergen insert were inoculated into 5ml of LB
broth containing 100µg/ml of ampicillin and incubated at 37°C at 230 rpm overnight.
From the grown starter culture, 2ml was added to 200ml of LB broth containing
ampicillin (100µg/ml) and incubated at 230 rpm for 2.5 h at 37°C. Protein expression
was induced with 200µl of 0.5M isopropyl 1-thio-β-Dgalactoside (IPTG). The culture
was then incubated at 230 rpm for either 4 h at 37°C or overnight at 22°C. After
incubation, the supernatant was discarded after centrifugation at 3800 rpm at 4°C for
10 min and the cell pellet was resuspended with 20ml of binding buffer (40mM
imidazole, 4M NaCl, 160mM Tris-HCl, pH7.9) containing 6M of urea. The cells were
lysed by sonication and the debris was removed by centrifugation at 13,000rpm for 15
min. The expressed recombinant proteins using pET32-Ek/LIC possessed an N-
terminal fusion protein that contained three tags [thioredoxin tag (109 aa), His•Tag (6
aa) and S•Tag (15 aa)], adding approximately 17.3 kDa to the existing molecular mass
of the recombinant protein.
Chapter 3
107
3.2.1.6 Purification of the putative allergens
As the amount of the expressed protein was generally 10-fold higher in the pellet
compared to the supernatant, 6M urea was used to solubilize the proteins. The
supernatant after sonication was purified by affinity column chromatography, as
described in the pET System Manual (Novagen), using Ni-NTA His•Bind Resin
(Novagen) and Ni-NTA columns (Bio-Rad Laboratories, Inc). Briefly, the supernatant
was incubated overnight with Ni-NTA resin (precharged with 40 mM NiSO4). Protein
purification and elution of his-tagged proteins were achieved using an imidazole
gradient (40 mM- 4M). Quantification of the protein was done on the SmartSpec™
Plus Spectrophotometer (Bio-Rad Laboratories), with Bio-Rad Protein Assay (Bio-Rad
Laboratories), with bovine serum albumin (BSA) as a standard as explained earlier.
The quality of the expressed recombinant proteins was analyzed by denaturing SDS-
PAGE (12%). Apart from the deduced size of the protein (from the calculated deduced
molecular weight), about 17.4 kDa of the N-terminal fusion protein (due to the
thioredoxin, his and S tags with some linking sequences) as explained earlier was also
present. A few kDa differences between the calculated and the predicted molecular
weight of the recombinant proteins is commonly observed. These variations might be
caused due to unusually high or low amounts of charged amino acids which cause
anomalous migration on the SDS PAGE (Takano et al., 1988). Generally, negatively
charged proteins tend to migrate faster towards the positive end whilst the positively
charged proteins tend to move slower than the average speed. The proteins with the
correct sized distinct band were used for further experiments.
Chapter 3
108
3.2.2 Confirmation of allergenicity for the generated recombinants
3.2.2.1 Patient Sera
All the C. lunata recombinant proteins (as well as C. lunata total extract) were tested
on various populations in order to confer allergenicity to the putative allergens. The
populations were selected based on geographical location of the patients as well as
atopy to specific allergen types. All the experiments were performed as blind without
any prior information on the atopy of the populations. Detailed information regarding
patients was not disclosed by the collaborators because of the patients` consent.
First of all, the putative allergens were tested on the local population. For this study, a
total of 152 fungal atopic Singaporean patients` sera were tested. These patients were
prescreened by skin-prick testing (SPT) as well as intra-dermal testing (IDT) using
crude extracts of Aspergillus fumigatus, Alternaria alternata, Candida albicans and
Cladosporium herbarum for allergenicity. Total 76 patients (57 IDT positive, 10 SPT
positive and 9 SPT/IDT positive) and 76 controls (SPT/IDT negative) were used.
Further, to test whether C. lunata allergens showed reactions to the patients from other
populations of the world (as well as differential atopy to various allergen types) of the
world, IgE binding studies over various populations were initiated. The first study
involved screening of atopic (asthma or rhinitis positive) dust-mite reactive Italian
population. A total of 171 (90 females and 81males) patients` sera were tested. Out of
171 sera tested, eleven (6 female and 5 male) sera were control sera. Average age of
the patients tested was 22 years (26 years for females and 19 years for males).
In the second study, asthmatic as well as control sera from Colombian population were
used (Courtesy: Dr. Louis Carabolla, Cartagena, COLOMBIA). A total of 128 (118
Chapter 3
109
asthmatic as well as 10 control) sera were used for the following study.
A third study was conducted over a small group of atopic Indian patients (Courtesy:
Dr. A.B. Singh, Institute of Genomics & Integrative Biology, New Delhi) showing
positive reactions to fungi and house dust mite extracts (on SPT). A total of 17
patients` (3 dust mite/fungal positive, 6 dust mite positive and 8 fungal positive) sera
were used.
3.2.2.2 Total protein extraction of Curvularia lunata
As described earlier, Curvularia lunata was cultured, harvested and lyophilized. The
lyophilized fungus (100mg – 150mg) was grounded to powder with liquid nitrogen
and then resuspended in 2ml of 1x PBS (16g NaCl, 0.4g KCl, 2.88g Na
2
HPO
4
.2H
2
O,
and 8g KH
2
PO
4
). After 2h incubation at 4°C, the cell debris was removed by
centrifugation at 4,500rpm for 15min. The supernatant containing the protein was
collected and stored at -20°C. Quantification was done as indicated earlier. Working
stock of the protein extract was stored at 4°C in order to protect them from exposure to
moisture and degradation process. Although storage at -20°C may be a better
alternative, the repeated freeze-thawing would have encouraged protein degradation.
Hence, only stocks meant for long-term storage were kept at -20°C.
3.2.2.3 Standardization of the proteins for Dot-blot immunoassay
Based on the quantification done on the SmartSpec™ Plus Spectrophotometer (Bio-
Rad Laboratories, Inc), the proteins were diluted to 0.25mg/ml. Diluted proteins were
then filled in a 384-well plate. Around 125ng of each protein was then dotted on to a
nitrocellulose membrane (Bio-Rad Laboratories) using the VP 386 Replicator (VP-
Scientific) and allowed to dry overnight. The membrane was then stained with amido
Chapter 3
110
black (0.1% amido black, 40% methanol, 1% acetic acid) for 3min, washed twice with
water for 3min each, and destained with 25% 2-propanol and 10% acetic acid. The
membrane was analysed manually for uniformity of the colour intensity which
indicates similar protein quantity. BSA, diluted to 0.25mg/ml, was used as a control.
The protein concentrations were then adjusted accordingly so as to get all the dots of
same intensity.
3.2.2.4 Dot-blot Immunoassay
As discussed earlier, around 125ng of each protein was dotted onto a nitrocellulose
membrane. The membranes were then blocked with cold 0.1% PBS-T (0.1% (v/v)
Tween 20) for an hour followed by three washes of 15 min, 7 min and 7 min duration
each with cold 0.05% PBS-T (0.05% (v/v) Tween 20). Following blocking, individual
membranes were incubated separately with 150uL of sera (diluted 1:1 (v/v) in PBS)
overnight at 4°C. After removal of the sera, the membranes were washed as before and
incubated with 500uL of alkaline phosphatase-conjugated goat anti-human IgE
(Sigma) (diluted 1:1000 (v/v) in 0.05% PBS-T) at room temperature for 2.5h followed
by the three washes. Detection of the bond anti-human IgE was achieved by the
addition of 1.5ml of the color substrate [33µl of NBT (50 mg/ml nitroblue tetrazolium
salt in 70% (v/v) dimethylformamide) (Promega) and 16.5µl of BCIP (50 mg/ml 5-
bromo-4-chloro-3-indolyl-phosphate in 100% dimethylformamide) (Promega) in 5ml
of alkaline phosphatase buffer [100 mM Tris-HCl (pH 9.0), 150 mM NaCl, 1 mM
MgCl
2
]. The color development process was allowed to occur at room temperature for
about 1h following which the reaction was quenched by rinsing the membranes with
distilled water.
Chapter 3
111
Steps were taken to ensure that the amount of proteins transferred to the membranes
were consistent, which would then allow comparison in the later stages. Two
conditions were strictly monitored. Firstly, the replicator was used in such a way that
equal amounts of proteins were transferred each time, both within and between the
membranes and secondly, the proteins were maintained at equal concentrations. The
first factor was ensured by first dotting the membranes with 0.25mg/mL of BSA. The
membranes were then stained and analyzed with amido black, which indicates the
amount of protein transferred to the membrane. This step was repeated until the
standard deviation and covariance of the intensity of the stain within and between
membranes stayed consistently below 5%. The concentrations of the proteins were
confirmed by staining the test proteins on the membranes with amido black. The
concentrations of proteins which differed in color intensities were adjusted
accordingly, until all the proteins gave similar intensity.
The protein samples were transferred onto the membranes in duplicates. Each
membrane contained several controls. Negative controls like PBS (used as a control
for fungal extracts), elution buffer used in the purification of the recombinants as well
as the pET32 fusion protein (with all the three earlier mentioned tags) were used.
Serial dilutions of human IgE were used as a positive control (Dilutions from 150 IU
till 9.375 IU). The sera were screened in batches. Each batch was screened with at
least 2 blanks, in which the membranes were incubated with 0.1% PBS-T instead of
patient sera. Apart from C. lunata recombinant proteins and C. lunata total extract,
extracts of Aspergillus fumigatus as well as Penicillium citrinum were also used. As
Chapter 3
112
P.citrinum and A.fumigatus are known allergenic fungi, they were used in order to
compare the reaction intensities of C. lunata recombinants as well as crude extract.
3.2.2.5 Analyses of the Dot-blot Immunoassays
The developed membranes were blotted dry, scanned and the color intensity was
analyzed using MicroImage
TM
for Windows
TM
v4.0 (Olympus).
The readings obtained by the software were further processed in several steps. Firstly,
the difference between 255 (the maximum value of a digital color image pixel), and
the average of the duplicate readings was found. The allergen background was
calculated as the difference between the readings of the blank membrane’s test sample
and that of the tag (empty vector protein with the thioredoxin tag; as thioredoxin itself
is a known allergen) to remove reactions to the fusion protein (if any). The serum
background referred to the reading of the working membrane’s buffer in which the test
sample was diluted. The final reading was taken as the difference of the reading of the
test sample and the sum of both; the allergen and the serum background. Classification
of the positive and negative sera was done based on the standard deviation (SD)
values. Any readings below 2SD of the control were considered as negative reactions.
This roughly corresponds to the reaction intensity of 20.
3.3 RESULTS AND DISCUSSION
3.3.1 Cloning and Expression of the isolated putative C. lunata allergens
3.3.1.1 RACE amplification of the truncated putative allergen sequences
Out of the 14 different allergen types, 7 allergens were already found to be present as
full-length in the ESTs. For the remaining 7 truncated sequences, RACE amplification
Chapter 3
113
was tried in order to get full-length sequence. Various RACE primers were designed
from different regions of the available sequence (From ESTs). From the 7 different
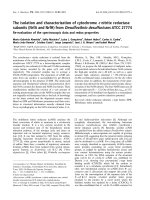
sequences tried for RACE, only one sequence (C. lunata alcohol dehydrogenase
allergen) was successfully amplified to its full-length (Figure 3.4).
3.3.1.2 Allergen submissions to NCBI and nomenclature
Out of the 14 putative allergen types, 7 were already present as full length sequences.
One sequence was further RACE amplified to obtain the full-length sequence as
explained earlier. The remaining 6 sequences were truncated and were not been
amplified to full-length by RACE. All these sequences (full-length as well as
truncated) were deposited in the NCBI sequence database, except for the two
sequences (C. lunata homologs of Alt a 10 and Mal f 4). The length of the sequences
was too small to be considered for cloning/expression and immunological
characterization.
As per the IUIS Allergen nomenclature subcommittee (www.allergen.org); allergens
are designated according to their source. The first three letters of the allergen comes
from the genus followed by space after which the first letter of the species followed by
space and ending with an Arabic number. Unique Arabic numbers are assigned to the
allergens in order of their identification. Hence, following this system, Curvularia
lunata allergens were named as Cur l n (where n is the unique Arabic number). Since,
Cur l 1 (Gupta et al., 2004) and Cur l 2 (Sharma et al., 2004) were already present, the
allergens were named from Cur l 3 onwards till Cur l 14 (Table 3.2).
Chapter 3
114
Figure 3.4: Successful full-length amplification for C. lunata alcohol
dehydrogenase by 5` RACE
As shown below, the shaded region is the sequence available from the EST.
First row represents the cDNA sequence while the second row shows the translated
amino acid sequence for the corresponding triplet codons.
The gene specific primer for 5` RACE is showed in yellow.
As seen in the figure, after 5`RACE, a full-length sequence for the alcohol
dehydrogenase allergen was obtained with the start (ATG) and the stop codon (TAA).
Chapter 3
115
Table 3.2: List of C. lunata putative allergens with the NCBI accession numbers as well as allergen name
The two allergens not present in the below list are C. lunata homologs of Alt a 10 and Mal f 4 which were not submitted
to NCBI and were not given any allergen name as the sequence lengths were too small for future immunological
characterizations.
Allergen nomenclature: First three letters are taken from genus (Cur from Curvularia) followed by the first letter of the species
(l from lunata) followed by a unique Arabic number.
Lengths of the allergen sequences are given in base pairs (bp).
Allergen Identity/Homology Allergen name NCBI Accession
Length
(bp)
Asp f 6 (Mn, Superoxide Dismutase) [Aspergillus fumigatus] Cur l 3 AY291574 588
Cop c 2 (Thioredoxin) [Coprinus comatus] Cur l 4 AY291577 339
Cyclophilin allergen [Malassezia sympodialis] Cur l 5 AY291576 516
Pen c 19 (Heat Shock Protein 70) [Penicillium citrinum] Cur l 6 DQ911620 627
Pen n 18 (Vacuolar Serine Protease) [Penicillium notatum] Cur l 7 DQ911621 627
Jun o 2 (Ca+2 binding protein) [Juniperus oxycedrus] Cur l 8 AY291578 342
Asp f 2 [Aspergillus fumigatus] Cur l 9 AY291573 468
Can a 1 (Alcohol Dehydrogenase) [Candida albicans] Cur l 10 DQ911619 1059
Asp f 15 precursor (Asp f 13) [Aspergillus fumigatus] Cur l 11 AY291575 417
Asp f 7 [Aspergillus fumigatus] Cur l 12 DQ911618 321
Tri r 4 (Serine Protease) [Trichophyton rubrum] Cur l 13 DQ911623 564
Par j 3 (Profilin) [Parietaria judaica] Cur l 14 AY291579 357
Chapter 3
116
3.3.1.3 Cloning and expression of the putative allergens
pET32/EkLIC vector (Novagen) was used for the cloning/expression of the putative
allergens. Using the specific forward and reverse primers for each allergen, the
amplicon was obtained. Figure 3.5 shows the agarose gels for all the C. lunata allergen
amplicons after PCR with pET32/EkLIC specific primers. As seen in the figure, each
amplicon was around 50bp longer than expected. This is due to the presence of LIC
overhangs present in the primer sequences (around 25 bases on each primer).
Furthermore, the successfully cloned sequences in the pET32/EkLIC vector were
expressed to generate recombinant proteins (with the fusion protein as mentioned
earlier). These expressed recombinant proteins (with 6 histidine tag) were then purified
by Nickel based affinity purification in buffer with 6M urea. Protein quantification of
the proteins was done to get the amount of expression. Protein expression yields for
the expressed recombinant putative allergens were around 1mg/ml. There was some
problem with the Cur l 14 expression as it was not giving the protein of right size.
Hence, Cur l 14 was not purified and was not included in further studies. A list
detailing the estimated molecular weights of the allergens using the Compute pI/Mw
tool ( is shown in Table 3.3. The quality and
purity of the expressed recombinants was checked by 12% SDS PAGE (Figure 3.6).
As seen in the figure, proteins with single, clear band of correct expected size were
obtained.
Chapter 3
117
Figure 3.5: 1% agarose gels for the amplicons of C. lunata putatively allergenic
sequences after PCR amplification with pET32/EkLIC specific primers
Length is shown in base pairs (bp).
GeneRuler™ 1kb DNA Ladder (MBI Fermentas) is loaded as standard for comparison
of the amplicon sizes.
Due to the presence of LIC overhangs present in the primer sequences (around 25
bases on each primer), the observed lengths of the amplicons are 50bp longer than
expected lengths.
Cur l 4
250bp
500bp
250bp
500bp
Cur l 3 Cur l 5
250bp
500bp
500bp
750bp
750bp
1000bp
Cur l 6 Cur l 7
500bp
750bp
250bp
500bp
Cur l 8
Cur l 9
250bp
500bp
250bp
1000bp
Cur l 10
250bp
500bp
Cur l 11 Cur l 12
250bp
500bp
Cur l 13
500bp
750bp
250bp
500bp
Cur l 14
Chapter 3
118
Table 3.3: Estimated molecular weights of the expressed C. lunata putative allergens
Estimated molecular mass of the allergens calculated using Compute pI/Mw tool (
Allergen
name
Allergen Identity/Homology
Length
(aa)
Estimated molecular
mass (kDa)
pI
Cur l 3 Asp f 6 (Mn, Superoxide Dismutase) [Aspergillus fumigatus] 195 21.8 7.59
Cur l 4 Cop c 2 (Thioredoxin) [Coprinus comatus] 112 12.3 4.84
Cur l 5 Cyclophilin allergen [Malassezia sympodialis] 171 18.3 8.75
Cur l 6 Pen c 19 (Heat Shock Protein 70) [Penicillium citrinum] 208 22.3 5.41
Cur l 7 Pen n 18 (Vacuolar Serine Protease) [Penicillium notatum] 208 22.3 5.27
Cur l 8 Jun o 2 (Ca+2 binding protein) [Juniperus oxycedrus] 113 13.0 3.95
Cur l 9 Asp f 2 [Aspergillus fumigatus] 155 17.3 6.22
Cur l 10 Can a 1 (Alcohol Dehydrogenase) [Candida albicans] 352 37.5 7.02
Cur l 11 Asp f 15 precursor (Asp f 13) [Aspergillus fumigatus] 138 14.3 5.47
Cur l 12 Asp f 7 [Aspergillus fumigatus] 106 11.2 4.43
Cur l 13 Tri r 4 (Serine Protease) [Trichophyton rubrum] 187 21.1 5.20
Chapter 3
119
Figure 3.6: Purified recombinant C. lunata putatively allergenic proteins after
expression
12% SDS PAGE was used.
Molecular size is shown in kilo daltons (kDa).
Due to the presence of the fusion protein (made up of the thioredoxin, his and S tags
with some linking sequences) of approximately 18kDa, the observed protein bands
were around 18kDa higher than that of the expected size.
Chapter 3
120
3.3.2 Confirmation of allergenicity for the generated recombinant allergens
Various Curvularia lunata recombinant proteins as well as C. lunata total extract were
tested on various populations in order to confer allergenicity to the putative allergens.
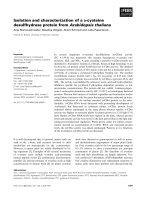
The putative allergens were tested on the local Singaporean fungal atopic population.
A total of 152 Singaporean (76 patients and 76 controls) sera were tested. All of the C.
lunata recombinants tested showed binding to the patients specific IgEs. Cur l 10
showed maximum IgE binding frequency (60%) as compared to any of the other
allergens tested. As per IUIS – allergen nomenclature subcommittee, an allergen
reacting with the IgE binding frequency equal to or greater than 50% is considered as a
major allergen. Hence as per this definition, Cur l 10 can be considered as a major
allergen of C. lunata. Cur l 8 showed least IgE binding frequency of 8%. IgE binding
frequencies of the C. lunata total extract was lower than Cur l 3,4,9,10,11 and 12. This
might be due to the fact that the individual allergen concentration might be getting
diluted when present together with other proteins in the total extract, hence reducing
allergenicity. IgE binding frequencies of A.fumigatus and P.citrinum were higher than
C. lunata total extract (Figure 3.7) with IgE binding frequencies of 55% and 40%
respectively while that of C. lunata being 32%. Amongst the control sera, only 4% of
the patients showed positive IgE binding to Cur l 10 whilst around 2.5% of the patients
showed positive reactions to Cur l 3 and Cur l 9 each. The rest all recombinants
showed no reactions. For the tested crude extracts, A.fumigatus and P.citrinum showed
IgE binding frequency to 10% and 8% of the tested sera while C. lunata extract
showed around 1%.
Hence, with the help of this experiment, it was established that the putative C. lunata
Chapter 3
121
Figure 3.7: IgE binding study of C. lunata recombinant allergens for fungal atopic
Singaporean population (N=160)
Reaction above the intensity of 20 units is considered as a positive reaction.
Cur: Curvularia lunata, Asp: Aspergillus fumigatus and Pen: Penicillium citrinum
total extracts