A method for 3d nano focusing of optical energy and its application to the surface enhanced raman spectroscopic study of protein 2
Bạn đang xem bản rút gọn của tài liệu. Xem và tải ngay bản đầy đủ của tài liệu tại đây (8.54 MB, 163 trang )
Chapter 4
Electromagnetic Theory of 3D Nanofocusing of Surface Plasmon Polariton
and its Application to Surface Enhanced
Raman Scattering (SERS)
In Chapter 2, confined and intense electric fields (the SERS hot-spots) on a spherical
metallic nano-particle were shown to be a result of the redistribution of optical energy by the
surface plasmon (SP). In this chapter, a coherent fluctuation of surface charges on a flat airmetal interface is discussed (147). Such a “planar” SP or propagating surface plasmon
polariton (SPP) has been demonstrated in the electron energy-loss experiments by Powell and
Swan (148), and shown to be localized or bound to the interface within the Thomas-Fermi
screening thickness of about 1 Å (149). One interesting consequence of an oscillating
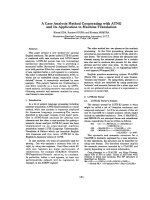
surface-charge is the resultant transversal and longitudinal electromagnetic field which
disappears at |z| →∞, and has its maximum on the surface z = 0 (see Figure 1). Just as the SP
fields on a metal particle are capable of Raman enhancement, the same is also true for the
SPP fields on a smooth metal surface as will be discussed below.
99
SPP
Dielectric
z
Au
x
Figure 1. Intensity distribution showing the field confinement of the propagating surface
plasmon polariton on a the smooth surface of a semi-infinite Au.
4.1 General Theory of Propagating Surface Plasmon Polariton on Smooth
Surfaces
Unlike nano-particle-bound SP fields, which are confined to the north and south poles of
the particle (see § 2.3.2 of Chapter 2), a SPP field is non-localized and spread out across the
entire metal-dielectric interface. The field distribution of a surface-bound SP field can be
v
v
easily found through the Maxwell equation (∇ 2 + κ 2 )E = 0 , which gives E the general form,
v
ˆ
ˆ
Ei = (Eix a x + Eiz a z )ei (k ix x + k iz z )
(1)
v
in which the projected direction of k on the dielectric-metal boundary is assumed to be
along the positive x-axis. The subscript, i, indicates whether the equation is applicable to the
dielectric (i = 1) or the metallic (i = 2) medium. One can also see from the Maxwell equation
that both kix and k iz are generally complex, satisfying,
100
2
2
kix + kiz = ω µ iε i
(2)
'
"
where ε 1 is real, and ε 2 , is complex, ε 2 = ε 2 + iε 2 .
v
v
Whether the E1 and E2 field is bound to the surface, i.e. decays away from the surface
|z| > 0, depends primarily on the values of kix and k iz . By imposing the boundary conditions,
E1 x = E2 x ,
H1x = H 2 x
(3)
v
v
v
v
and making use of the fact that, ∇ × H = i E and ì E = iàH , it follows that,
E1x = H1 y
k1z
ωε1 ,
E2 x = H 2 y
k2 z
ωε 2
(4)
thus,
k1z
ε1
−
k2 z
ε2
=0
(5)
Owing to the continuity of the tangential fields across the interface, one has
k1 x = k2 x = k x
(6)
Since all the k values (i.e. k ix and k iz ) are totally described by Eqn. 2, 5 and 6, these
v
v
equations thus collectively determine whether the E1 and E2 fields are bound to the
interface.
101
Now by re-writing Eqn. 2 as,
2
ω
2
k iz = ± ε i − k ix
c
(i = 1, 2)
(7)
and in combination with Eqn. 5, one can obtain a dispersion equation that relates k x to ω ,
kx =
ω ε1ε 2
c ε1 + ε 2
(8)
Note that in deriving Eqn. 8, the upper sign in Eqn. 7 has been chosen for i = 1, and the lower
v
v
sign for i = 2. This is to ensure that the E1 and E2 fields will not increase away from the
interface, and thereby result in an unrealistic field.
Since the current thesis concerns mainly with low-damping noble metals such as Au
'
"
'
'
and Ag with ε 2 < 0 , ε 2 > ε 2 and ε 2 > ε 1 - true for the metals commonly employed in the
majority of SERS studies, k x can thus be approximated as,
kx ≈
'
ω ε1ε 2
'
c ε1 + ε 2
(9)
Plotting ω versus k x produces the dispersion curve for SPP (see Figure 2), which describes
the allowable SPP modes that can be supported on a planar metal surface for a range of ω .
The shaded region bound by the light line
ε 1 ω / c and the
ω -axis in Figure 2 represents
v
points where both k 1 x ( = k x ) and k1z are real, i.e. where E1 is propagating away from the
102
surface. The fact that the SPP dispersion curve is not included in this particular region
indicates that the k 1 x (or k x ) for the SPP modes must be greater than
ε 1 ω / c , and thus the
corresponding k1z must be a pure positive imaginary according to Eqn. 2. Hence, as expected,
v
v
the E1 field of the SPP is decaying away (i.e. E1 field is surface bound) from the surface
rather than propagating away. Inside the metal (i = 2), on the other hand, k 2 z of the SPP will
v
possess a negative imaginary part (see Eqn. 6 and 7), which suggests that the E2 field should
reduce as z → -∞. Thus, the SPP dispersion curve represents “non-radiative” surface-bound
field with exponentially decreasing intensities above and below the dielectric-metal boundary
z > 0 (Figure 1). Note that the dispersion curve does not increase monotonically with k x ,
but levels at ω sp =
ωp
'
1+ ε 2
, where ωsp and ω p is respectively the SPP frequency and the
'
bulk plasma frequency of the metal. With increasing ε 2 , the value of ω sp reduced. One can
E
also conclude that, according to Eqn. 1, ∠ iz
E
ix
k
= ∠ ix
k
iz
π
≈
2 for a supported SPP field on
the interface, suggesting the longitudinal and transverse fields, i.e. Eix and Eiz , are always 90 º
out of phase.
103
Dispersion Curve for SPP on semi-infinite Au
9
8
Light-line
Freq. (1e15 rad/s)
7
ω sp
6
5
Dispersion
4
3
2
1
0
1
2
3
4
5
6
7
8
9
10
k (10e7)
Figure 2. Dispersion curve for a planar surface plasmon.
Finally, through the divergence theorem, expression for the SPP charges across the
interface can be obtained,
v
ρ (s ) = ε o (ε1E1+z − ε 2 E2+z )
k
= ε o ε1 − ε 2 z1 E1+z
kz2
k v
ˆ
= ε o ε1 − ε 2 z1 E2 ( x, y )a z
kz2
(10)
where the plus sign indicates the field is measured immediately above the metal surface, and
v
s is a surface vector ( x, y ) .
104
4.2 Excitation and Evidence of Propagating Surface Plasmon
v
An electron penetrating a solid can transfer its momentum hq and energy ∆Eo to the
v
v
electrons of the solid. The projection of q upon the surface kx determines the plasmon wave
vector and, together with the dispersion relation, the energy loss of the scattered electron
∆Eo = hω (see Figure 3) can be determined. Since the electrons scatter at different angles θ ,
v
different momenta hk x are transferred to the metal surface. Thus measurements of the energy
loss ∆Eo over a range of θ , allow the dispersion relation of the SPPs to be measured up to
v
large kx , beyond the Brillouin zone (149). The physics of SPPs has thus been studied
extensively with electrons, especially with fast electrons, and the fundamental properties of
SPP have been found in good agreement with theory (150).
v
kel Incident electron
v
Projection of hq onto
the metal surface
v
kx
Thin metal film
Scattered
v
electron k '
v
hq
el
-
+
Energy loss measurement
Figure 3. An energy loss measurement for determining the dispersion relation of SPP on a
v'
v
thin metal film. kel is the final momentum of the incident electron after collision, while hq is
the momentum transferred to an electron within the metal.
105
While fast electrons are good tools for the study of the dispersion relation at very
v
large kx (~0.3 Å-1) as has been performed previously in order to study the slow increase of
the dispersion relation in Al (150-153), it is however not convenient to reach the region of
v
small kx because of the difficulties in producing an extremely narrow incident electron beam
v
with a low kel required for such a measurement. This limits the experimental uncertainty in
v
the measurable kx value via electron loss to about 3 × 10⁻³ Å-1, which is comparable with the
extension of the whole linear region of the dispersion relation. Hence, either a fast- or a slow-
v
electrons beam is not suitable for exciting SPP in the low kx value range of interest to the
current study.
Visible light, on the other hand, possesses a low momentum in the 3 × 10⁻³ Å-1, range,
and can thus allow for the excitation of SPPs on a smooth metal surface. However, this is not
straightforward since it is not possible for a radiative beam to launch a SPP on a metal
v
surface via a direct incidence, simply because the projection of k of the light onto the surface
(i.e. k x =
ω
c
ε 1 sin θ o , where θ o is the incident angle, and ε 1 is the dielectric constant of the
medium above the metal surface) is always less than the SPP momentum
'
ω ε 1ε 2
(see
'
c ε1 + ε 2
'
'
Eqn. 9 and recalling that ε 2 < 0 and ε 2 > ε 1 ) for any incident angle between 0 º to 90 º; the
incident photon must at least gain an extra momentum
ω
c
'
ε 1ε 2
ε +ε '
1
2
∆k
in the order of
ω
−
ε 1 sin θ o in order to induce a SPP.
c
Conventionally, this is achieved through a three-layer configuration as shown in
Figure 4. First, the exciting beam is launched into the top medium (i.e. region 0), normally a
glass semi-cylindrical prism, which has a high refractive index (normally a glass) to up the k x
106
to
ω
c
ε 0 sin θ o (where ε o > 1 ) before impinging upon the 0/1 interface. Due to
electromagnetic theory and the theory of conservation of momentum, this momentum ( k x ) is
carried across region 1 and reaches the 1/2 interface. Depending on whether a KrestchmanRaether (1 = metal, 2 = dielectic) or an Otto configuration (1 = dielectric, 2 = metal) is used,
one of the regions 1 and 2 can be a metal, while the other a dielectric (149, 154). In any case,
it is possible to choose an appropriate ε 0 so that k x =
ω
c
ε 0 sin θ o =
ω ε 1ε 2
, which
c ε1 + ε 2
matches the SPP wave vector at the 1/2 interface. The incident angle at which this condition
is satisfied is thus simply,
ε 1ε 2 1
ε 1 + ε 2 ε o
θ o, sp = sin −1
(11)
Note that ε 0 must always be sufficiently large compared to, | ε1 | in the case of a
Krestchman-Raether setup, or | ε 2 | in the case of Otto setup, in order for θ o , sp to be a real
value, i.e. in order to have a realistic incident angle.
107
High refractive
index
θ
Incident
beam
kx
Reflected beam
ε0
0
0/1
ε1
1
kx
1/2
2
ε2
Figure 4. A three-layer configuration for exciting surface plasmons.
4.3 Exciting Propagating Surface Plasmon Optically
4.3.1 Exciting Surface Plasmons via Krestchman-Raether Configuration
Figure 5 shows a typical Krestchman-Raether configuration with the three layers
respectively being glass (or quartz) (0), metal (1), and a dielectric medium (2) exhibiting a
refractive index lower than that in 0. In this particular configuration, the incident field gains
its momentum while traversing through region 0 before reaching the metal film layer in
which the field decreases exponentially in amplitude prior to impinging on the 1/2 interface.
If the field is p-polarized and the incident angle θ o is such that the k x of the field matches
ksp (
R
2
ω ε 1' ε 2
c ε 1' + ε 2
) at the 1/2 interface, a SPP is excited in which case the reflected intensity
(see Figure 5) reduces to a minimum as a result of the incident energy being completely
converted to the excited SPP mode. Such a dependence of the reflected light with the incident
108
angle can be seen through the Fresnel’s equations for the three-layer stratified system. This
can be achieved by first formulating the Fresnel law in a matrix form as,
R P − cosθ 0'
'p
'
E1 = ε 0 sin θ 0
E1 p 0
p
E2 0
'
cosθ1'eik1 cos θ 1d
'
− ε1 sin θ1'eik1 cos θ 1d
− cosθ1'
ε1 sin θ1'
0
0
cosθ 2
ε 2 sin θ 2
cosθ1e ik1 cos θ 1d
'
ε1 sin θ1eik1 cos θ 1d
− cosθ1
− ε1 sin θ1
−1
cosθ 0
ε sin θ
0
0
0
0
(12a)
for a p-polarized incident field, and
R s − cos θ 0'
's
'
E1 = sin θ 0
s
E1 0
s
E2 0
' ik1 cos θ1'd
1
' ik1 cos θ1'd
1
'
1
'
1
ik1 cos θ1d
cos θ e
cos θ1e
sin θ e
sin θ1e ik1 cos θ1d
'
− cos θ
− cos θ1
sin θ
− sin θ1
0
0
cos θ 2
sin θ 2
−1
ε 0
cos θ 0
377
ε
0 377 sin θ 0
0
0
(12b)
for a s-polarized incident field, where R represents the electric field of the reflected beam,
and E s are fields in region 1 and 2 with a positive direction as defined in Figure 5.
109
z
(a)
Rp
θ0
'p
E1
d
ε0
0
kx
'
1 1
θθ
E1
p
E2
p
x 0/1
1
ε1
1/2
θ2
kx
2
ε2
0
ε0
z
(b)
θ0
Rs
kx
d
y
's
1
'
1 1
θθ
E
x
s
0/1
1
ε1
E1
1/2
kx
θ2
E2
s
2
ε2
Figure 5. Krestchman-Raether configuration for exciting surface plasmons. (a) p-polarisation;
(b) s-polarization.
110
By assuming region 1 to be Au with a dielectric constant as that obtained by Johnson
and Christy previously (73), and setting ε 0 and ε 2 as 2.25 and 1.77 respectively (i.e. 0 =
2
glass, 2 = water), a map of R versus d (thickness of the metal film 1) and the incident angle
θo can be constructed as shown in Figure 6 for a 633-nm vacuum wavelength and for both pand s-polarized incident light. Note that in the calculation, the amplitude of the incident field
is assumed to be unity. Additionally, a plot of the far-field intensity E 2
light is also shown (Figure 6b and d). A comparison of the R
2
2
of the transmitted
maps in Figure 6a and c
shows reflections at the 1/2 interface remain small for θ o < 61 º, i.e. less than the critical
angle for total internal reflection. However, for θ o > 61 º, s-polarized light becomes totally
reflected. P-polarized light on the other hand exhibits a secondary R
2
minimum at around
θ o = 70 º for d values ranging between 30 to 100 nm. Note also that, at this particular angle
and polarization, the transmitted far-field intensity E 2
2
is 0. Since the energy of reflection,
transmission and absorption must be conserved (i.e. R + T + A = 1), a loss of R
2
and E 2
2
intensity suggests that the incident energy has been completely absorbed by the metal film at
θ o = 70 º (i.e. A ≈ 1) to excite the SPP at the 1/2 interface. Furthermore, through a
comparison the maps in Figure 6a and b with those in Figure 6c and d, it is evident that only
p-polarized light can trigger a SPP resonance (155). The effect of ε 2 on the optimal θo, sp and
dsp value for SPP excitation is depicted in Figure 7. As can be seen, for an increasing ε 2 , θo, sp
increases while dsp remains almost constant.
111
R
2
E2
(a)
R
2
2
(b)
E2
(c)
2
2
(d)
2
Figure 6. A map of R and E 2 versus d (thickness of the metal film 1) and θ o . (a and b) spolarization. (c and d) p-polarization. ε 0 = 2.25 (glass). ε 2 = 1.76 (water). The dielectric
constants ε1 for the Au (Region 1) are obtained from Johnson and Christy’s previous
publication (73),
112
(a)
d sp = 48 nm
θ o, sp = 44 º
(b)
d sp = 51 nm
θ o, sp = 70 º
(c)
d sp = 43 nm
θ o, sp = 81.5 º
2
Figure 7. A map of R versus d (thickness of the metal film) and θ o with ε 2 = 1.0 (a). 1.76
(b) and 1.96 (c). ε 0 = 2.25 (glass). The dielectric constants ε1 for the Au (Region 1) are
obtained from Johnson and Christy’s previous publication (73),
113
4.3.2 Exciting Surface Plasmons via Otto Configuration
If now region 1 and 2 in the Krestchman-Raether configuration are interchanged, i.e.
1 = dielectric and 2 = metal (Au in the current study), an Otto configuration is realized (see
Figure 8). One can again derive R
2
maps using Eqn. 12, but with the d now being the
dielectric gap separation as shown in Figure 9, and those for the far-field transmitted intensity
2
E 2 in Figure 9b and c, based on the same ε 0 value used above but with ε1 = 1.77 (water).
The value of ε 2 , dielectric constant of the Au, is based on the value reported by Johnson and
Christy previously (73). An inspection of Figure 9 reveals SPP excitations at θ o, sp = 70 º with
p-polarized incidence and an optimal gap separation dsp of 390 nm. The effect of ε 1 on θsp
and dsp is depicted in Figure 10 which indicates an increase in θsp with increasing ε 2 , while
dsp reduces.
114
z
(a)
Rp
θ0
'p
E1
d
ε0
0
kx
'
1 1
θθ
E1
p
E2
p
x 0/1
1
ε1
1/2
θ2
kx
2
ε2
z
(b)
θ0
Rs
d
s
y
E1'
ε0
0
kx
θ1'θ1
x
s
0/1
1
ε1
E1
1/2
kx
θ2
E2
s
2
ε2
Figure 8. Otto configuration for exciting surface plasmons. (a) p-polarisation; (b) spolarization.
115
R
2
E2
2
(b)
(a)
R
2
E2
(c)
2
2
(d)
2
Figure 9. A map of R and E 2 versus d (thickness of the metal film 1) and θ o . (a and b) spolarization. (c and d) p-polarization. ε 0 = 2.25 (glass). ε1 = 1.76 (water). The dielectric
constants ε 2 for the Au (Region 2) are obtained from Johnson and Christy’s previous
publication (73),
116
(a)
d sp = 820 nm
θ o, sp = 44 º
(b
d sp = 400 nm
θ o, sp = 70 º
(c
d sp = 350 nm
θ o, sp = 85 º
2
Figure 10. A map of R versus d (thickness of the metal film 1) and θ o with ε1 = 1.0 (a).
1.76 (b) and 1.96 (c). ε 0 = 2.25 (glass). The dielectric constants ε 2 for the Au (Region 2) are
obtained from Johnson and Christy’s previous publication (73),
117
4.4 Surface Plasmon Polariton Assisted Surface Enhanced Raman Scattering
on Ultrasmooth Metal Surface
The theory for an enhanced field near a metal surface due to the SPP excitation by
light with modified phase velocity ( k x ) as discussed above is well established (156-158).
Particularly, due to the near-field nature of SPP, the effect is particular well suited for the
study of various physical phenomena at metal surfaces (157, 159-161) as well as for the
Raman scattering of adsorbed molecular monolayers on the surfaces (154, 158, 162, 163).
Enhancement factors (EFs) of the Raman signal achievable with SPP resonance have been
reported to be in the order of 102-103 for both Kretschmann and Otto setups (158, 164, 165).
An example is provided in the graph shown in Figure 11a, which illustrates the maximum
EFs (dark curves) attainable in the SPP-induced enhanced Raman scattering using the Ottoconfiguration at various excitation wavelengths. EF response curves for various metal nanoparticles are also shown (gray curves) for comparison. Note that Eqn. 12 has been used when
evaluating the EFs for the Otto-setup, while EFs for the metal colloids are calculated based
on the Mie-Theory discussed in § 2.3.2 of Chapter 2, and, in all cases, it was assumed that the
metal is Au and the incident field is unity. By inspection, it can be seen that the EFs
achievable with SPP is generally greater than those with metal colloids for excitation
wavelengths beyond 630 nm. While both methods can offer similar EFs, Raman enhancement
by SPP is however advantageous over conventional approaches in that the SPP fields decay
less rapidly away from the metal surface than do the plasmon fields on metal colloids, as
evidenced by the decay plot of EF against the distance d from the metal surface as shown in
Figure 11b. In the plot, all curves are normalized at d = 0, and the decay curves
corresponding to the SPP fields are displayed in dark, whereas those for the metal colloids are
in gray. Here, the metal is again assumed to be Au. From the plot, one can immediately see
that the EF for an Au colloid with the optimal particle size of 105 nm (i.e. size with which
118
maximum EF can be obtained from Au colloid) declines by more than 60% at d > 4 nm. On
the contrary, the EF does not drop by more than 10 % at d = 4 nm for the Otto configuration
at any visible wavelength between 400 nm and 800 nm (shaded region). Such a long-range
characteristic renders SPP appropriate for the enhanced Raman scattering of macro-molecular
layers. In fact, the SERS of thick inorganic layers (up to about 100 nm) deposited on
ultrasmooth metal surfaces have been previously reported by Futamata et. al. and Kurosawa
et. al. (164, 166). Unfortunately, the use of SPP for the Raman studies of protein monolayers
has not been reported. This can be ascribed to the inability of the previous SPP experimental
setups to provide a sufficiently high Raman EF for the Raman scattering from the protein to
be detectable.
In the following sections, a method with which the SPP fields on the smooth metal
surface can be focused to form partially confined and localized hot-spot fields, that permit the
SPP-induced EF to be increased by a few orders of magnitude is proposed and discussed.
More specifically, a 3D nano-focusing of SPPs by spheroidal dielectric nano-cavities
embedded just beneath the surface of a semi-infinite metal in an Otto-configuration setup is
detailed.
119
(a)
λvac = 633
80 nm
Semi-infinite
Au
120 nm
40 nm
20 nm
(b)
λvac = 700 nm
λvac = 633 nm
λvac = 400 nm
120 nm
80 nm
40 nm
20 nm
Figure 11. Raman enhancements of Au colloids and semi-infinite Au. (a) EFs for
various Au colloid sizes (blue curves) and semi-infinite Au (red curve). Note that the colloids
are assumed to be suspended in water, and the dielectric medium above the metal surface is
assumed to be also water. (b). Plot of Raman EF versus distance from the metal surface for
both the Au colloids and the semi-infinite Au. Note that the wavelengths indicated in the
absicca are expressed in terms of the vacuum wavelength, λvac , i.e. wavelength in the water
multiplied by the refractive index of water.
120
4.5 Electromagnetic Theory of Semi-infinite Metal Containing Dielectric
Nano-cavities
There has been a surge in interests in plasmonic devices recently, due in part to their
wide applications in bio-sensing (155, 167) and also their ability to “focus” light energy into
a very narrow volume (168). Such a focusing ability of a plasmonic device can be attributed
to the fact that the SPP field penetrates only just a few hundreds or even tens of a nano-meter
into the medium above the metal surface. On can thus make use of SPP to probe selectively
any molecular activity occurring on the surface with no or little interference from the bulk of
the medium. In addition, nano-protrusions or crevices on a metal surface provide sites for the
coupling between a radiative field and a localized SP (LSP) mode. Such a geometry is of
particular importance in Surface Enhanced Raman Scattering or SERS, in which the intense
LSP field is exploited to result in an amplified Raman signals of an analyte molecule (53).
With the advancement in nano-technology, it has become possible to manipulate SP at a
nano-scopic scale so that one can engineer the SP field to suit a particular application (169,
170). In light of this, a detailed understanding of the interactions between SP and the nanoscopic features on / in a metal surface is crucial.
In this section, the interactions between a propagating SPP on a smooth metal surface
with an oblate dielectric nano-cavity buried just beneath it are studied. Special attentions will
be placed on the field geometry of the localized plasmon fields near the nano-cavity. The
particular case where the cavity-surface distance is close enough to interact with the SPP
evanescent field is thus considered. More specifically, the Maxwell equation for the
considered cavity system was solved. The solution shows the effect of the aspect ratio of the
cavity on the field structure and spectral response of the system. Lastly, through a Poyntingvector analysis, it can be shown that an embedded dielectric oblate nano-cavity possesses the
ability to focus SPP energy into a localized hot-spot, resulting in a further enhancement of the
121
plasmon field. The results obtained in the current study are relevant to the SERS study of
macromolecules.
4.5.1 Maxwell Formulation
Since a spheroidal cavity system will be studied in this chapter, it is convenient to
consider a spheroidal coordinate system as that shown in Figure 12, and express the field
around and inside the cavity in terms of spheroidal vector wave functions. Derivation of the
Maxwell solutions for such a system is detailed in Appendix VII.
ˆ
az
Dielectric
Metal
η>0
h
b
d
ˆ
ax η = 0
η<0
Dielectric
cavity
a
Figure 12. A schematic sketch of the cavity system considered in this chapter. The distance of
the center of the cavity to the surface is h. The major and minor axis of the cavity are denoted
ˆ
as a and b respectively. a y -axis is pointing perpendicularly out of the image plane.
122
The electric field in the dielectric medium above the metal surface can be derived as,
∞
v
v
v
ˆ ~
ˆv
E c = E1i + ∑ ∫∫∫ e −ik + ⋅ha z Ts e ks+
m ,n
where
(s)
v
E ct
( (
(s)
v
~
ˆv
ˆ
E ct e ks+ + T p e kvp+
) (
(s)
v
ˆ
E ct e kvp+
))
(13)
is the “total” scattered wave from the spheroidal dielectric nano-cavity after
~
ˆv
multiple reflections at the metal surface, and Ts ( p ) being a tensor that relates the wave eks (+p )
v
directing from the cavity toward the surface to the transmitted wave E s ( p ) in the dielectric
v
v
~
ˆv
medium above the metal, i.e. E s ( p ) = Ts ( p ) eks (+p ) , where E s ( p ) has the form,
v s( p)
E
= (a − b )
v 2
2
k1 − k1 x
v
k1
k
k
−ik x
−ik z
ik z
1
1
ˆ
ˆ
ˆ
e 1 x a x + a v x e 1 z a z + b v x e 1 z a z
k
k
1
1
v
with a and b being some complex constants, and k1 being the wave vector in the dielectric at
the light frequency ( ω ) of interest.
4.5.2 Computational Results
Here, it is assumed that an Otto configuration as that shown in Figure 8 is employed
for the excitation of SPP on the metal surface of the cavity system. Under such an optical
setup, and assuming glass prism ( ε 0 = 2.25 ) and water ( ε1 = 1.77 ) in region 0 and 1,
respectively, a gap separation of 390 nm is utilized to allow for a maximal light-SPP coupling
as has established above in § 4.3.2. The dielectric constant of the embedded nano-cavities is
taken to be ε cavity = 2.31 (η = 1.52 ) and the embedding host medium is assumed to be Au
123