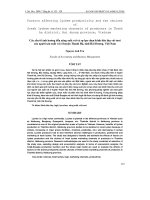
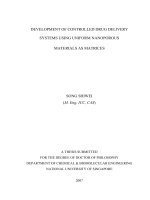
Investigation on factors affecting drug delivery using polymers and phospholipids 4
Bạn đang xem bản rút gọn của tài liệu. Xem và tải ngay bản đầy đủ của tài liệu tại đây (1.69 MB, 25 trang )
79
CHAPTER 5
Development of a Nutrient-Rich Facial Mask for the Topical
Delivery of L-Ascorbic Acid and Retinoic Acid
5.1 Introduction
Many marketing strategies include the incorporation of antioxidants and other skin
nutrients into cosmetic products. L-ascorbic acid, (AA) has been widely used in
cosmetic and dermatological products because of its photoprotective effect and the
ability to scavenge free radicals and destroy oxidizing agents. It can also induce
collagen synthesis and suppress the pigmentation of the skin while reducing signs of
photoaging. It is chemically unstable and it can easily be oxidized, therefore its stable
derivatives of AA such as ascorbyl palmitate, ascorbyl tetraisopalmitate and
magnesium ascorbyl phosphate are widely used in the pharmaceutical industry
(Segall and Moyano 2008; Campos et al., 2008; Gaspar and Campo 2007). These
derivatives can easily be converted to the active compound, AA, after ingestion.
However topical applications of these derivatives are not able to efficiently increase
the skin levels of this antioxidant (Pinnell and Madey 1998). A formulation strategy
to improve the stability of ascorbic acid is to incorporate in in emulsions. The oil
phase may partially protect AA from oxidative degradation caused in aqueous
solutions (Farahmand et al., 2006; Rozman and Gašperlin 2007; Kogan and Garti
2006).
80
Retinoic acid (RA) enhances the repair of UV-damaged skin and reduces wrinkles
caused by photoaging. It can also be used for the treatment of acne (Watson et al.,
2008; Cao et al., 2007; Kang and Voorhees, 1998; Fisher et al., 2002; Thielitz et al.,
2008). Due to its lipophilic structure it is practically insoluble in aqueous solution
which decreases its bioavailability (Lin et al., 2000; Montassier et al., 1997; Hu et al.,
2005).
Gold nanoparticles have been studied as potential vaccine carriers and in transdermal
delivery systems (Sonavane et al., 2008; Menon et al., 2007; Mulholland et al., 2006;
Dean et al., 2007). Gold facial masks have been used at beauty clinics and saloons.
They are deemed to improve blood circulation and skin elasticity and to rejuvenate
the skin and reduce the formation of wrinkles ( />care/facial-skin-care.html), however there is no published scientific evidence about
the use of gold facial masks.
To improve the bioavailability of cosmetic products, there is a need to address the
stability and solubility issues of these vitamins. The aim of the present work is to
develop nutrient-rich electrospun nanofiber facial mask sheets for cosmetic purposes.
AA, RA, gold and collagen-loaded electrospun facial masks of PVA and RM β-CD
were developed and characterized using FESEM and X-ray elemental analysis. In
vitro skin permeation studies of the vitamins were carried out across human
epidermis.
81
5.2 Materials and Methods
5.2.1 Materials
L-ascorbic acid, tetrachloroauric acid, poly vinyl alcohol, trisodium citrate, collagen
were obtained from Sigma, Singapore. 13-cis retinoic acid was obtained from
Toronto Research Chemicals. RM β-CD (degree of substitution of about 1.8) was a
gift from Wacker (Burghausen, Germany).
5.2.2 Electrospinning
Gold nanoparticles were prepared by trisodium citrate reduction of tetrachloroauric
acid in 10 % w/v poly vinyl alcohol (PVA) 30 % v/v ethanol solution (Bai et al.,
2007; Wang et al., 2007). Briefly, 2 ml of 2 % w/v trisodium citrate was added to the
PVA solution mixture and stirred at 95 - 100
o
C, and then 0.7 ml chloroauric acid
aqueous solution was added to this mixture where the colour of the solution changed
to blood red indicating the formation of the gold nanoparticles. The solution was
cooled to room temperature before the other components were added. RM β-CD was
added to the solution to make a 20 % w/v concentration. Characteristics of the
electrostatic spinning equipment and the conditions are mentioned in section 4.2.2.
Details of the formulation are shown in Table 5.1.
The control used is a commercially available cotton mask which was pre-moistened
with the same concentration of ascorbic acid/ and or retinoic acid.
82
Table 5.1 The composition of the face mask formulations.
IngredientFormulations
Ascorbic acid
(1 % w/v)
Cis-retinoic acid
(0.1 % w/v)
Collagen
(0.01 % w/v)
Gold
(0.1 % w/v)
A
√
B
√ √
C
√
D
√ √ √
E
√ √ √ √
AA and RA concentrations in the formulation were used based on the concentrations
of these vitamins in cosmetic products available in the market. Collagen was studied
in various concentrations however it was found that higher concentrations influenced
the morphological structure of the fibers of the face mask and resulted in semi
spherical defects on the mat. The amount of gold used was in accordance to previous
papers, PVA can help to stabilize gold nanoparticles (Khanna et al., 2005).
5.2.3 FESEM and Energy Dispersive X-Ray Spectroscopy (EDS) Analysis of the
Fiber Mat
The surface topography of the electrospun fibers was assessed using the FESEM
(described previously in section 4.2.3). The diameter distribution of the electrospun
fibers was derived from a random sample of at least 20 fibers.
EDS measurements were carried out by means of a FESEM equipped with an energy
dispersive X-ray source to identify the presence of gold in the fiber. After coating
with platinum, samples were analyzed at 15 kv voltage. The area to be analyzed was
selected before the electron beam scanned and identified the intensity of characteristic
X-ray energies of specific elements.
83
5.2.4 UV Spectroscopy
UV absorption measurements were carried out at room temperature on a UV-VIS
spectrophotometer (U-1800 spectrophotometer, Hitachi, Japan) at 261 and 349 nm for
AA and RA respectively. Standard solutions of AA and RA (0.05 to 2.00 μg/ml) were
prepared in water and water ethanol solutions respectively.
5.2.5 In vitro Skin Permeation Studies
Skin samples were prepared according to the method described in section 2.2.7.
Flow-through diffusion cell was used for the skin permeation experiments as
mentioned in section 2.2.8. The donor compartment was filled with 25 mg of vitamin-
loaded mat and was hydrated with 300 µl of water. The receptor compartment was
phosphate buffer saline with pH adjusted to 5.5. Control samples were cotton sheet
pre-moistened with vitamin solutions. Samples from the receptor compartment were
collected at predetermined time points over a 4-h period, and the amounts of AA or
RA permeated were analyzed by UV spectrometer.
5.2.6 Skin Histology
Skin samples used in diffusion studies were processed for light microscopy. Samples
were soaked overnight in 85 ml of 80% v/v ethanol, 10 ml formaldehyde and 5 ml
acetic acid (Gaspar and Campos 2007). After a series of dehydration, they were
embedded in paraffin and semi-thin sections were cut and stained with hematoxylin
and eosin prior being examined with a light microscope (Leica EC 3, USA).
84
5.2.7. Statistical Analysis
Statistical analysis was made using, Student t-test or one-way analysis of variance,
ANOVA mentioned in section 2.2.10.
5.3 Results
5.3.1 Fiber Morphology and EDS Analysis
Continuous fibers without beads or sputtering of the solution were obtained with
diameter ranging from ~ 100 nm to 2 µm (Fig. 5.1). There was a decrease in fiber
diameters from electrospun solutions containing gold.
85
AA AA- Au
RA AA-RA-collagen
AA-RA-collagen-Au Nanofiber mat
Fig. 5.1 FESEM morphology of the electrospun fiber mats and micrographic image of the
nanofiber mat.
86
001
001
30 µm30 µm
30 µm
30 µm
30 µm
0.00 1.00 2.00 3.00 4.00 5.00 6.00 7.00 8.00 9.00 10.00
keV
001
0
1000
2000
3000
4000
5000
6000
7000
8000
9000
C o un ts
C-K
O-K
Na-K
Au-M
Au-M
Au-M
Au-L Au-L
Fig. 5.2 X-ray energy spectra of nanofiber face masks, demonstrating the presence of the gold element signals using area analysis and
spot analysis. C and O represent the backbone of the nanofiber mat; presence of Na is due to the sodium citrate added for gold reduction.
00 5
00 5
10 µm10 µm
10 µm
10 µm
10 µm
0.00 1.00 2.00 3.00 4.00 5.00 6.00 7.00 8.00 9.00 10.00
keV
005
0
100
200
300
400
500
600
700
800
900
1000
C oun ts
C-K
O-K
Na-K
Au-M
Au-M
Au-M
Au-L Au-L
006
00 6
10 µm10 µm
10 µm
10 µm
10 µm
0.00 1.00 2.00 3.00 4.00 5.00 6.00 7.00 8.00 9.00 10.00
keV
006
0
100
200
300
400
500
600
700
800
900
1000
C oun ts
C-K
O-K
Na-K
Au-M
Au-M
Au-M
Au-L
Au-L
87
This may be due to the increase in the charge density of the solution due to the
presence of gold element (Bai et al., 2008). Fig. 5.2 illustrates the spectra of gold
present on the fibers. Spot analysis indicates that Au was only present on the
fiber.
5.3.3 In vitro Skin Permeation Studies
Results of skin permeation are shown in Fig. 5.3. It can be seen that nanofibers
loaded with vitamins increased the skin permeation of AA and for RA when
compared to the vitamin-loaded cotton face mask (p > 0.05). Presence of gold
increases the permeation of ascorbic acid (p > 0.05). Although there was no
significant increase in the skin permeation rate of the vitamis from the nanofiber
mask, however the permeation profiles were clearly different as compared to the
control samples and addition of a penetration enhacer to the facial mask may help
to further enhance the skin permeation rate. These facial masks have high surface
area-to-volume ratios when compared to cotton facial masks which can increase
the contact areas of the masks with the skin surface. The dry nature of the product
increases the stability of its constituents and minimizes the oxidation of the
antioxidants. The presence of RM β-CD can increase the solubility of RA and
accelerate the dissolution rate of the fiber mat. The concentration of RM β-CD
was able to provide a fiber mat with a disintegration time of less than one hour.
After placing the mask on the face and hydrating it with water, the mask will
gradually dissolve and release the entire active ingredient, ensuring maximal skin
penetration. These electrospun fiber mats can be formulated to accommodate
various skin nutrients and vitamins needed for a healthy skin. These properties of
the electrospun mats make them a promising alternative to facial cotton masks.
88
0
3
6
9
12
0 50 100 150 200 250
Time (mins)
Cumulative RA (μg/cm
2
)
Control
Electrospun mat-RA
0
10
20
30
40
50
0 50 100 150 200 250
Time (mins)
Cumulative AA (µg/cm
2
)
Electrospun mat-AA
Electrospun mat-Au-AA
Control
Fig. 5.3 Cumulative AA and RA permeation across human epidermis (n=3).
Microscopic appearance of the skin before and after treatment with gold
nanoparticle-loaded fiber mat is shown in Fig. 5.4. In the control, a clearly defined
SC could be seen, but after treatment, slight detachment of the SC layer occurred.
The SC layer was fragmented and enlargement of inter-keratinocyte spaces was
observed while the other epidermis layers became more compact.
89
Before After
Fig. 5.4 Morphology of human epidermis after skin permeation studies, (×400). The
nucleated cells of the epidermis have been stained blue, unsaturated lipids, including fatty
acids and esters have been stained red.
5.4 Conclusion
L-ascorbic acid has been widely used in cosmetic and dermatological products
because of its ability to scavenge free radicals and destroy oxidizing agents.
However, it is chemically unstable and can easily be oxidized. The current
cosmetic facial masks available in the market are pre-moistened which means that
the aqueous fluid content of the mask may oxidize some of the unstable active
ingredients. This work presents an anti-wrinkle nanofiber face mask containing
ascorbic acid, retinoic acid, gold nanoparticles and collagen. This novel face
mask will only be wetted when applied to the skin, thus enhancing product
stability. Once moistened, the content of the mask will gradually dissolve and
release the entire active ingredient and ensure maximum skin penetration. The
high surface area-to-volume ratio of the nanofiber mask will ensure maximum
contact with the skin surface and help to enhance the skin permeation to restore
skins healthy appearance.
90
CHAPTER 6
Development of a Thermoresponsive Nanofiber Mat for Sustained
Topical Delivery of Levothyrxine
6.1 Introduction
Poly (N-isopropylacrylamide) (PNIPAM) is a thermally reversible hydrogel with a
lower critical solution temperature (LCST) of around 32
o
C in water. The cross-
linked gel of this material swells and shrinks at temperatures below and above the
LCST respectively, therefore a PNIPAM delivery system can provide sustained
therapeutic levels of a drug by responding to the physiological signals of the body.
Poly (N-isopropylacrylamide) (PNIPAM) nanoparticles (Wei et al., 2007; Shin et
al., 2001), hydrogels (Zhang et al., 2004; Don et al., 2008) and liposomes coated
with PNIPAM have been extensively studied as controlled drug delivery systems
(Han et al., 2006; Wang et al., 2003; Kim and Kim 2002; Kono et al., 1999).
Levothyroxine (T4), a model drug, is a synthetic hormone administered orally for
the treatment of hypothyroidism and goiter (Patel et al., 2003; Volpato et al.,
2004). Topical administrations of T
4
have been used to reduce deposits of adipose
tissue on skin (Arduino and Eandi 1989; Sanntini et al., 2003). Presence of high
concentration of T
4
in cosmetic creams may cause systemic effect. Using
radioactive marker, radioactivity was found in the plasma after skin application of
T
4
(James and Wepierre 1974). However recent in vivo studies using liposomal
formulations were not able to detect any systemic effect (Santini et al., 2003).
91
Topical application of dimethyl-β-cyclodextrin (DM β-CD) was able to retain T
4
on the skin without significant transdermal permeation (Padula et al., 2008).
This is an investigation to determine if polymeric nanofibers can sustain the skin
penetration of levothyroxine (T
4
) and maintain the effective concentration in the
skin layers. Electrospun nanofiber mats of PVA, PNIPAM and PVA- PNIPAM
complex were developed as carriers for sustained release of T
4
across human skin.
6.2 Materials and Methods
6.2.1 Materials
Poly vinylalcohol (Mw 70000-100000), poly (N-isopropylacrylamide) (Mw 20000
25000), levothyroxine, fluorescein and 4’, 6-diamidino-2-phenylindole (DAPI)
were purchased from Sigma (Singapore). All other reagents were of analytical
grade.
6.2.2 HPLC Analysis
Concentration of T
4
was determined by HPLC from Agilent HP 1100 Series
(USA). The analysis was carried out using an X-bridge column (3.5 µm, 4.6 mm
× 100 mm; USA). Mobile phase (70:30 acetonitrile and 0.05 M phosphate buffer
adjusted to pH 3 using phosphoric acid) was delivered at a rate of 0.6 ml/min. UV
detection at wavelength 220 nm, injection volume 100 μL gave a retention time of
9 min. Standard solutions of T
4
(0.05 - 2 μg/ml) in 40% v/v ethanol were
prepared.
92
6.2.3 Electrospinning of PVA/PNIPAM Nanofibers
Polymeric solutions were obtained by dissolving the drug and polymer in water
(for PVA and PVA-PNIPAM) or in ethanol (for PNIPAM). Fluorescein-loaded
PNIPAM solutions were developed for confocal imaging and studying the depth
of the penetration of the drug from these fibers into the skin. Details of the
electrospinning process are mentioned in section 4.2.2. Polymeric solutions were
electrospun at a voltage of 15kV with a flow rate of 1ml/h. The non-woven
electrostatically spun fabric was removed from the collector and was dried under
vacuum for a week at room temperature to remove residual solvent prior to usage.
Details of each formulation are shown in Table 6.1.
Table 6.1 Nanofiber formulations.
Polymer Concentration (% w/v)Formulation
PVA PNIPAM
Solvent
A 10 - Water
B - 10 Ethanol
C - 10 water
D 10 5 Water
E 10 10 Water
* All formulations contain 2 mg/ml of T
4
.
6.2.4 FTIR Studies of Nanofibers
Interaction between polymers and their functional groups were studied using
FTIR. Spectra of the fibers were obtained using the method mentioned in section
4.2.4.
93
6.2.5 FESEM and Fluorescence Microscopy of the Nanofiber
The surface topography of the electrospun fibers was assessed using a FESEM
(details are mentioned in 4.2.3). The diameter distribution of the electrospun
fibers were derived from a random sample of at least 20 fibers. Fluorescein-loaded
PNIPAM fibers were viewed using a Nikon fluorescence microscope (Eclipse
TE2000-U, Japan).
6.2.6 In vitro Drug Release Studies
Total immersion method was used to study the cumulative release profiles of T
4
from drug-loaded fiber mats. A known amount of the fibers (5 mg) was
suspended in 10 ml of PBS and was placed in a shaking incubator at 37
o
C or 20
o
C.
Samples of 1 ml were taken from the medium periodically and the released drug
was determined using HPLC. The volume of the release medium was kept
constant by replacement with same volume of fresh medium. All drug release
data were averaged from three measurements.
6.2.7 In vitro Skin Permeation Studies
Skin samples were prepared according to the method in section 2.2.7. Permeation
studies of drug-loaded 10% PNIPAM and 10% PVA nanofibers were performed
(see section 2.2.8). The donor compartment was filled with 25 mg of fiber mat or
250 mg of control solution, all having an equal amount of drug. The amount of T
4
permeated was analyzed by HPLC. Experiments were carried out in triplicates.
94
6.2.9 Confocal Laser Scanning Microscopy (CLSM)
Skin penetration of fluorescein loaded PNIPAM nanofibers were viewed using a
CLSM described in section 2.2.9.
6.3 Results and Discussion
6.3.1 FTIR Measurements of the Drug-Loaded Nanofibers
The interactions between the polymers and T
4
were analyzed by FTIR (Fig. 6.1).
For pure PVA (Fig. 6.1a), a broad band around 3336 cm
-1
is attributed to the O–H
stretching vibration of the hydroxyl group. The vibrational bands at 2942 and
1438 cm
-1
represent the –CH stretching. The sharp peak band at 1095 cm
-1
corresponds to C–O–C symmetrical stretching present in the PVA backbone (Fig.
6.1a). There was a decline in the intensity of the –OH band when PVA was mixed
with T
4
(Fig. 6.1b). It is clear that hydrogen abstraction occurred from PVA
molecule in the presence of T
4
suggesting the formation of hydrogen bond
between PVA and T
4
molecules (Şanlı et al., 2007; Hong et al., 2007; Arndt et al.,
1999).
The bands at 2971, 2932 and 2875 cm
-1
are associated with the –CH stretching
vibration of PNIPAM fiber in 100% v/v ethanol (Fig. 6.1f). The positions of these
three peaks are sensitive to changes in the conformation of the hydrocarbon chain
and they shift towards lower frequencies when placed in aqueous solutions. This
could be related to the interaction of the alkyl chain with water causing a decrease
in the degree of freedom of the PNIPAM molecules (Liu et al., 2005; Maeda et al.,
2001a and b).
95
Fig. 6.1 FTIR spectra of nanofibers of (a) 10% w/v PVA - No drug, (b) 10% w/v PVA, (c)
10%w/v PVA - 5% w/v PNIPAM, (d) 10% w/v PVA - 10% w/v PNIPAM, (e) 10% w/v
PNIPAM and (f) 10% w/v PNIPAM - No drug. All formulations contain drug unless
otherwise mentioned.
FTIR spectra of the polymer blends show the presence of both PVA and PNIPAM
in the nanofibrous networks. The interactions between the two polymers could be
due to hydrogen bonding between the hydroxyl group in PVA and amide group in
PNIPAM.
6.3.2 FESEM and Florescence Imaging of Nanofibers
Morphological structures of electrospun PVA, PNIPAM and polymer mixtures are
shown in Fig. 6.2. In our study, the electrospinning parameters such as voltage,
flow rate and distance between the injector and collector were kept constant,
therefore any difference in the morphology or structure of the fibers is probably
related to the intrinsic properties of the polymeric solution. PVA fibers loaded
with 1 mg/ml of T
4
were obtained using drug/polymer solutions at a concentration
of 10% w/v polymer in water. Formulation A exhibits uniform fibers with
96
diameters ranging from ~ 100 to 200 nm (Fig. 6.2a). Continuous fibers of
formulation B without beads or sputtering of the solution were obtained with fiber
diameters ranging from ~ 30 to 300 nm. High viscosity and lower surface tension
of the ethanolic solution favor the formation of continuous nanofibers as observed
with formulation B (Fong et al., 1999; Xu et al., 2007; Verrecka et al., 2003).
Formulation C resulted in spindle-like defects therefore it was not used in the
other experiments (Fig. 6.2c). Nevertheless continuous nanofibers were obtained
from the electrospinning of formulations D and E, however some elongated and
semi-spherical defects were formed along these fibers (Fig. 6.2d, e). The mean
diameters of the fibers correlated with viscosities of the solutions. Fiber diameter
increases (about 100 to 1000 nm) when blends of PVA and PNIPAM were used.
This could be due to the hydrogel formed when PNIPAM was added into aqueous
solutions resulting in higher surface tension values. FESEM showed that
levothyroxine crystals were not formed on the surface of the fibers indicating that
levothyroxine has been completely embedded in the fibers. Fig. 6.2f shows that
fluorescein was homogenously distributed cross the PNIPAM fiber net.
97
(a) (b)
(c) (d)
(e) (f)
Fig. 6.2 FESEM images of T
4
-loaded nanofibers of (a) 10% w/v PVA, (b) 10% w/v
PNIPAM in ethanol, (c) 10% w/v PNIPAM in water, (d) 10% w/v PVA - 5% w/v
PNIPAM, (e) 10% w/v PVA - 10% w/v PNIPAM, (f) fluorescein -loaded 10% w/v
PNIPAM.
98
6.3.3 In vitro Drug Release Studies
The release of T
4
from formulations A, B, D and E was investigated in phosphate
buffer solution of pH 7.4 both at body temperature, 37
o
C, (Fig. 6.3) and room
temperature, 20
o
C (Fig. 6.4). The release of T
4
from the polymer mat is
speculated to be by drug diffusion, polymer erosion (degradation) or both
mechanisms.
At body temperature, 37
o
C, formulation B released approximately 97% of its drug
content whereas formulation A released only 65% of its total drug content. The
release of T
4
from the mixed polymer mat was found to be a function of PNIPAM
concentration used, therefore more drug was released from formulation E
compared to that of formulation D. This could be explained by the high water
solubility of PNIPAM which dissolved almost immediately leading to a rapid
release of T
4
.
0
20
40
60
80
100
0 15 30 45 60 75 90 105 120 135
Time (min)
Cumulative T
4
release (%)
PVA 10%
PNIPAM 10%
PVA 10%- PNIPAM 5%
PVA 10%- PNIPAM 10%
Fig. 6.3 In vitro release profile of T
4
from electrospun mat in phosphate buffer (pH 7.4) at
body temperature (37
o
C), n=3.
99
Drug release rates from formulations containing PVA were found to be lower than
PNIPAM due to the slow degradation of PVA. Therefore PNIPAM and PVA
blends prolonged drug release with lower risk of toxicity compared to that of
PNIPAM fibers.
The drug release at 20
o
C from formulation B was relatively lower than at 37
o
C
(>LCST). Considering that PNIPAM is a thermosensitive polymer, it can be used
for regulating drug release via response to temperature change. At temperatures
below LCST, the polymer is stable and the drug release is slow, however at higher
temperatures the polymer collapses thereby enhancing drug release (Kato et al.,
2000). Drug release from PVA fibers was not affectd by temperature.
0
20
40
60
80
100
0 15 30 45 60 75 90 105 120 135
Time (min)
Cumulative T
4
release (%)
PNIPAM 10 %
PVA 10%
PVA 10%-PNIPAM 10%
PVA 10%-PNIPAM 5%
Fig. 6.4 In vitro release profile of T
4
from electrospun mat in phosphate buffer (pH 7.4) at
room temperature (20
o
C), n=3.
100
6.3.4 In vitro Skin Permeation Studies
Fig. 6.5 represents cumulative T
4
for 10% w/v PVA, 10% w/v PNIPAM and
control as a function of time. It can be seen that T
4
permeation across the skin
was gradual (p > 0.05) and there is evidence of drug accumulation in the skin as
shown by the small amounts of drug permeated. The recommended therapeutic
dose of T
4
is 50-100 μg/day, therefore the cumulative T
4
skin penetration obtained
in this study would not be sufficient to produce a systemic effect in vivo. This
improves therapeutic efficiency and helps to accumulate drug on the skin to obtain
a prolonged delivery (Padula et al., 2008).
Fig. 6. 5 Cumulative T
4
permeation across human epidermis (n=3).
To support the above hypothesis, CLS microscopic studies were conducted.
FITC-labelled PNIPAM nanofibers were located primarily in the stratum corneum
101
(SC) layers of the skin (Fig 6.6). Fluorescein was detected in the lower layers of
the epidermis from aqueous solution that did not contain any polymer. Skin was
counterstained with DAPI to visualize cell nuclei. The binary images (Fig. 6.6b)
indicate the localization of green fluorescein on the outer layer of the skin for the
PNIPAM formulations as compared with the control.
Such delivery systems may have potential use in skin formulations containing
sunscreens and other active ingredients that are meant to be concentrated on the
skin surface. Due to the lower dosing frequency and simpler dosage regimes,
patient compliance may be improved.
102
a) PNIPAM nanofiber mat
Control
b) PNIPAM nanofiber mat Control
Fig. 6.6 (a) Image of the epidermis and localization of green fluorescence incorporated in
to the PNIPAM nanofibers as a function of depth into the skin. The image depths (from
left to right) are 0, 8, 16 and 24 µm. (b) Binary image of the skin after the flow through
diffusion studies. Staining of cell nuclei with DAPI is shown as blue signal.
6.4 Conclusion
A series of nanofibrous membranes were electrospun into blends of poly vinyl
alcohol (PVA) and poly-N-isopropylacrylamide (PNIPAM) to develop a sustained
topical delivery of T
4
. The polymeric nanofiber mats were characterized by field
emission scanning electron microscopy (FESEM) and fourier transform infrared
(FTIR) spectroscopy. In vitro permeation of the drug from the polymeric
nanofibers was studied using excised human skin and the permeation mechanism
103
investigated using confocal microscopy. It was observed that polymeric
nanofibers were able to sustain the penetration of T
4
to the skin and help maintain
the effective drug concentration in the skin layers for longer period of time. These
formulations may have potential uses in topical skin products and can help to
increase the accumulation of the active compound on the skin surface thus
minimize the adverse side effects which may be caused by systemic absorption.
This may result in great improvement in consumer compliance, avoid frequent
dosing and enhance the therapeutic effectiveness.