Coverage and connectivity management in wireless sensor networks
Bạn đang xem bản rút gọn của tài liệu. Xem và tải ngay bản đầy đủ của tài liệu tại đây (3.2 MB, 162 trang )
COVERAGE AND CONNECTIVITY MANAGEMENT
IN WIRELESS SENSOR NETWORKS
ZHANG MINGZE
B.Eng. (Hons.), NUS
A THESIS SUBMITTED
FOR THE DEGREE OF PH.D. IN COMPUTER SCIENCE
DEPARTMENT OF COMPUTER SCIENCE
NATIONAL UNIVERSITY OF SINGAPORE
2009
The most profound technologies are those that disappear. They weave themselves
into the fabric of everyday life until they are indistinguishable from it.
– Mark Weiser
i
Acknowledgement
I want to express my deeply-felt thanks to my Ph.D. supervisor, Dr. Mun Choon Chan,
for his inspiring ideas, valuable suggestions and constant encouragement during the whole
course of the work. Without him the work would not haven been possible. I am grateful
to my co-supervisor, A/P Akkihebbal L. Ananda, for his thoughtful and important advice
throughout this work.
I wish to express my special thanks to Dr. Vikram Srinivasan, Dr. Mehul Motani and
Dr. Chen Khong Tham, for the wonderful course in sensor networks and their guidance
on the course project.
I would also like to express my gratitude to all present and former members of Com-
munication and Internet Research Lab, as well as my friends and classmates who helped
me at different periods of my work. In particular, I would like to thank Mr. Binbin Chen
and Shuai Hao, for the countless hours spent in setting up the sensor testbeds, as well as
the interesting discussions on asymmetric links. I would like to thank Dr. Wei Wang and
Mr. Kok Kiong Yap, from whom I learned a lot on research methodology. I would like to
thank Mr. Xiuchao Wu for his patient helps in locating and using lab resources. I would
also express special thanks to Dr. Sridhar K.N. Rao, Mr. Tao Shao, Mr. Feng Xiao, and
Mr. Zhiguo Ge for their helps in many aspects of my work and my life.
My special thanks goes to my dear parents, who always support me and encourage
me in my entire life. I would also like to thank all my friends who supported me in
completion of my studies.
Lastly I would like to express my heartful thanks to my wife, Dr. Yuwen Pan. She
helped me concentrate on completing this dissertation and encouraged and supported me
during the whole course of this work.
ii
Contents
1 Introduction 1
1.1 Wireless Sensor Networks . . . . . . . . . . . . . . . . . . . . . . . . . 1
1.2 Coverage and Connectivity in WSNs . . . . . . . . . . . . . . . . . . . . 3
1.3 Coverage and Connectivity Management . . . . . . . . . . . . . . . . . . 6
1.4 Problem Formulation and Thesis Contribution . . . . . . . . . . . . . . . 8
1.5 Thesis Organization . . . . . . . . . . . . . . . . . . . . . . . . . . . . . 11
2 Related Work 12
2.1 Localization Techniques . . . . . . . . . . . . . . . . . . . . . . . . . . 12
2.1.1 A Brief Summary on Localization Techniques . . . . . . . . . . . 13
2.1.2 Connectivity-based Localization . . . . . . . . . . . . . . . . . . 14
2.1.3 Sequential Distance-based Localization . . . . . . . . . . . . . . 15
2.2 Related Work in Coverage and Connectivity . . . . . . . . . . . . . . . . 17
2.2.1 Coverage and Connectivity Preserving Node Scheduling . . . . . 17
2.2.2 Other Coverage and Topology Control Protocols . . . . . . . . . 20
2.2.3 Connectivity Monitoring . . . . . . . . . . . . . . . . . . . . . . 22
2.2.4 Macroscale Hole Recognition . . . . . . . . . . . . . . . . . . . 24
3 Coverage-Preserving Node Scheduling 27
3.1 Introduction . . . . . . . . . . . . . . . . . . . . . . . . . . . . . . . . . 27
3.2 System Model . . . . . . . . . . . . . . . . . . . . . . . . . . . . . . . . 28
3.3 Effects of Localization Errors on Coverage . . . . . . . . . . . . . . . . . 29
3.4 Overview of Configurable Coverage Protocol (CCP) . . . . . . . . . . . 30
3.4.1 Vacancy Inside Triangle . . . . . . . . . . . . . . . . . . . . . . 32
3.4.2 Exceptional Cases of Vacancy Calculation . . . . . . . . . . . . . 32
3.4.3 Node Selection Constraint . . . . . . . . . . . . . . . . . . . . . 35
3.5 CCP Details . . . . . . . . . . . . . . . . . . . . . . . . . . . . . . . . . 38
3.5.1 Selection of Starting Node . . . . . . . . . . . . . . . . . . . . . 38
3.5.2 First Edge and First Triangle Formation . . . . . . . . . . . . . . 38
3.5.3 Node Selection Process . . . . . . . . . . . . . . . . . . . . . . . 39
iii
3.5.4 Discussions . . . . . . . . . . . . . . . . . . . . . . . . . . . . . 40
3.6 Performance Evaluation . . . . . . . . . . . . . . . . . . . . . . . . . . . 41
3.6.1 Simulation Setup . . . . . . . . . . . . . . . . . . . . . . . . . . 41
3.6.2 Performance of CCP and OGDC . . . . . . . . . . . . . . . . . . 41
3.6.3 Performance of CCP with α < 1 . . . . . . . . . . . . . . . . . . 43
3.7 Neighbor Node Distance Estimation . . . . . . . . . . . . . . . . . . . . 44
3.7.1 Assumptions and Notations . . . . . . . . . . . . . . . . . . . . 44
3.7.2 Basic Idea and Problem Formulation . . . . . . . . . . . . . . . . 45
3.7.3 Maximum Likelihood Distance Estimation . . . . . . . . . . . . 46
3.7.4 Evaluation . . . . . . . . . . . . . . . . . . . . . . . . . . . . . 49
3.8 Summary . . . . . . . . . . . . . . . . . . . . . . . . . . . . . . . . . . 52
4 Microscale Connectivity Monitoring 53
4.1 Introduction . . . . . . . . . . . . . . . . . . . . . . . . . . . . . . . . . 53
4.2 System Model . . . . . . . . . . . . . . . . . . . . . . . . . . . . . . . . 55
4.3 Cost Analysis . . . . . . . . . . . . . . . . . . . . . . . . . . . . . . . . 56
4.3.1 Cost of Microscale Connectivity Monitoring . . . . . . . . . . . 56
4.3.2 Related Encoding Techniques . . . . . . . . . . . . . . . . . . . 58
4.4 Overview of H
2
CM . . . . . . . . . . . . . . . . . . . . . . . . . . . . . 59
4.5 Hop Vector Distance-based Neighborhood Constraints . . . . . . . . . . 61
4.6 Bloom Filter-based Connectivity Monitoring . . . . . . . . . . . . . . . . 64
4.6.1 Bloom Filter Preliminaries . . . . . . . . . . . . . . . . . . . . . 64
4.6.2 Basic Idea . . . . . . . . . . . . . . . . . . . . . . . . . . . . . . 66
4.6.3 Theoretical Analysis . . . . . . . . . . . . . . . . . . . . . . . . 69
4.7 Fingerprint Hashing . . . . . . . . . . . . . . . . . . . . . . . . . . . . . 76
4.8 Flow of H
2
CM . . . . . . . . . . . . . . . . . . . . . . . . . . . . . . . 77
4.8.1 Connectivity Initialization . . . . . . . . . . . . . . . . . . . . . 77
4.8.2 Connectivity Update . . . . . . . . . . . . . . . . . . . . . . . . 79
4.8.3 Further Extensions . . . . . . . . . . . . . . . . . . . . . . . . . 81
4.9 Evaluation . . . . . . . . . . . . . . . . . . . . . . . . . . . . . . . . . . 81
4.9.1 Large Network without Fingerprint Hashing . . . . . . . . . . . . 82
4.9.2 Performance in Large Network . . . . . . . . . . . . . . . . . . . 84
4.9.3 Performance in Mid-Size Network . . . . . . . . . . . . . . . . . 86
4.9.4 Connectivity Update . . . . . . . . . . . . . . . . . . . . . . . . 86
4.9.5 Testbed Evaluation . . . . . . . . . . . . . . . . . . . . . . . . . 87
4.10 A Simple Application – Node Failure Detection . . . . . . . . . . . . . . 88
4.10.1 Node Failure Detection . . . . . . . . . . . . . . . . . . . . . . . 88
4.10.2 Connectivity-based Node Failure Detection . . . . . . . . . . . . 89
4.10.3 Evaluation . . . . . . . . . . . . . . . . . . . . . . . . . . . . . 92
iv
4.11 Summary . . . . . . . . . . . . . . . . . . . . . . . . . . . . . . . . . . 94
5 Macroscale Topological Hole Detection and Monitoring 95
5.1 Introduction . . . . . . . . . . . . . . . . . . . . . . . . . . . . . . . . . 95
5.2 Simple Hole Detection . . . . . . . . . . . . . . . . . . . . . . . . . . . 97
5.2.1 Network Connectivity Model . . . . . . . . . . . . . . . . . . . . 97
5.2.2 Connectivity Based Hole Detection . . . . . . . . . . . . . . . . 97
5.3 Indicator Nodes and Their Properties . . . . . . . . . . . . . . . . . . . . 99
5.3.1 Definitions and Preliminaries . . . . . . . . . . . . . . . . . . . . 100
5.3.2 Properties of Indicator Points . . . . . . . . . . . . . . . . . . . . 101
5.4 Indicator Node Election and Hole Detection . . . . . . . . . . . . . . . . 106
5.4.1 Indicator Node Election . . . . . . . . . . . . . . . . . . . . . . 106
5.4.2 Hole Detection . . . . . . . . . . . . . . . . . . . . . . . . . . . 108
5.4.3 Delay and Communication Cost . . . . . . . . . . . . . . . . . . 108
5.5 Continuous Indicator Node Election and Its Application . . . . . . . . . . 111
5.5.1 Continuous Indicator Node Election . . . . . . . . . . . . . . . . 112
5.5.2 Hole Transformation Application . . . . . . . . . . . . . . . . . 113
5.5.3 Evaluation . . . . . . . . . . . . . . . . . . . . . . . . . . . . . 114
5.6 Hole Estimation Using Indicator Nodes . . . . . . . . . . . . . . . . . . 115
5.6.1 Estimation with Localization Information . . . . . . . . . . . . . 115
5.6.2 Evaluation . . . . . . . . . . . . . . . . . . . . . . . . . . . . . 117
5.6.3 Estimation Without Localization Information . . . . . . . . . . . 117
5.7 Discussions . . . . . . . . . . . . . . . . . . . . . . . . . . . . . . . . . 121
5.8 Summary . . . . . . . . . . . . . . . . . . . . . . . . . . . . . . . . . . 123
6 The Coverage and Connectivity Management System 124
6.1 Basics of WSN Management . . . . . . . . . . . . . . . . . . . . . . . . 124
6.2 A Unified Coverage and Connectivity Management System . . . . . . . . 126
6.2.1 System Model . . . . . . . . . . . . . . . . . . . . . . . . . . . 126
6.2.2 The Coverage and Connectivity Management System . . . . . . . 127
6.3 Management System Operation . . . . . . . . . . . . . . . . . . . . . . . 130
6.3.1 System Initialization . . . . . . . . . . . . . . . . . . . . . . . . 130
6.3.2 Normal System Operation . . . . . . . . . . . . . . . . . . . . . 131
7 Conclusion and Future Work 133
7.1 Research Summary . . . . . . . . . . . . . . . . . . . . . . . . . . . . . 134
7.2 Future Work . . . . . . . . . . . . . . . . . . . . . . . . . . . . . . . . . 136
v
Abstract
Both coverage and connectivity are the fundamental performance measures of the service
provided by wireless sensor networks. Coverage represents how well the sensing goal of
the network is accomplished, and connectivity represents how well the information can
be delivered among the sensor nodes or to the central controller. Managing network cov-
erage and connectivity is thus important in sensor networks. This thesis focuses on the
coverage and connectivity management problem in wireless sensor networks. The cov-
erage and connectivity management functions are classified into microscale management
and macroscale management according to the geographical scale within which the sensor
nodes collaborate.
This thesis first investigates several important coverage and connectivity management
problems according to this categorization. In particular, for the microscale coverage and
connectivity control problem, a Configurable Coverage Protocol (CCP) is proposed to
control the “on” and “off” of the sensor nodes and meanwhile maintaining network cov-
erage and connectivity. CCP is an efficient and lightweight protocol, in which each node
makes decision based only on the collaboration between its local neighbors. Unlike ex-
isting protocols, CCP targets coverage of only α portion of the network, where α can be
freely configured by the network administrators.
For the problem of microscale connectivity monitoring, a hashing based protocol
(H
2
CM) is proposed for efficient neighbor table collection. Collecting neighbor tables
from individual sensor nodes are generally hard due to the high communication cost. By
utilizing connectivity-based constraints and several hashing techniques, H
2
CM allows the
central controller to collect the neighbor tables from interested sensor nodes with very
high probability, but with much lower communication cost.
Lastly, for macroscale topological hole detection and monitoring, a simple but pow-
erful algorithm based on the connectivity changes of the sensor nodes is proposed. The
algorithm first distributively elects the set of indicator nodes, and only the indicator nodes
are required to send their information to the central controller. The location and size of the
hole can be fairly accurately estimated using the information from only a few indicator
nodes.
The thesis then integrates these individual management protocols and functions into
vi
a unified coverage and connectivity management system, which allows the network ad-
ministrators to monitor and control the network coverage and connectivity, from both
microscale and macroscale level. The dependencies of these individual components are
analyzed and system initialization and operation sequences are explained.
vii
List of Figures
1.1 Illustrations of coverage and connectivity. . . . . . . . . . . . . . . . . . 4
1.2 Relationship between coverage and connectivity. . . . . . . . . . . . . . 5
1.3 Coverage and connectivity management system. . . . . . . . . . . . . . . 8
2.1 Globally rigid structures. . . . . . . . . . . . . . . . . . . . . . . . . . . 16
2.2 Robust quadrilateral. . . . . . . . . . . . . . . . . . . . . . . . . . . . . 16
2.3 Illustrations of the optimal node positions for minimum overlap in coverage. 19
3.1 Average vacancy in percentage v.s. maximum localization error, with R
s
normalized to 1 . . . . . . . . . . . . . . . . . . . . . . . . . . . . . . . 29
3.2 Illustration of coverage and vacancy estimation. . . . . . . . . . . . . . . 31
3.3 Triangle vacancy calculation. (a) V = 0 (b) V = T −
1
2
πR
2
s
+
1
2
( f(d
1
) +
f(d
2
)+ f(d
3
)) (c) V = T −
1
2
πR
2
s
+
1
2
( f(d
1
)+ f(d
2
)) (d) V = T −
1
2
πR
2
s
+
1
2
f(d
1
) (e) V = T −
1
2
πR
2
s
. . . . . . . . . . . . . . . . . . . . . . . . . 33
3.4 Exceptional cases of triangle vacancy calculation. . . . . . . . . . . . . . 33
3.5 Illustration of inefficiency caused by exceptional cases a and b . . . . . . 35
3.6 Angle constraints. . . . . . . . . . . . . . . . . . . . . . . . . . . . . . . 37
3.7 Comparison between OGDC and CCP . . . . . . . . . . . . . . . . . . . 42
3.8 CCP with Coverage Objective α = 1,0.95,0.9,0.8 . . . . . . . . . . . . . 42
3.9 The number of common neighbors of two nodes can be used to estimate
the distance between the two nodes. . . . . . . . . . . . . . . . . . . . . 46
3.10 Distance estimation based on 2 transmission power levels . . . . . . . . . 48
3.11 Distance estimation error (98% percentile and mean) v.s. node density.
Single and dual power levels are indicated as (1) and (2) respectively. . . 50
3.12 Radio pattern examples with DOI=0.05 and 0.2 respectively. [46] . . . . 50
3.13 Mean distance estimation error v.s. DOI . . . . . . . . . . . . . . . . . . 51
4.1 An illustration of the ring model. . . . . . . . . . . . . . . . . . . . . . . 56
4.2 Effects of hop vector distance based technique. . . . . . . . . . . . . . . 63
4.3 Examples of Bloom filters. . . . . . . . . . . . . . . . . . . . . . . . . . 64
4.4 Bloom filter properties. . . . . . . . . . . . . . . . . . . . . . . . . . . . 68
viii
4.5 Comparison of consecutive Bloom filters (m = 30). . . . . . . . . . . . . 75
4.6 Packet format for connectivity monitoring. . . . . . . . . . . . . . . . . . 79
4.7 Performance hop vector and Bloom filter. . . . . . . . . . . . . . . . . . 83
4.8 Performance of H
2
CM in large and midsize networks. . . . . . . . . . . . 85
4.9 Distributed node failure detection. . . . . . . . . . . . . . . . . . . . . . 88
4.10 Illustration of a dominating set. . . . . . . . . . . . . . . . . . . . . . . . 90
4.11 Communication cost for node failure detection. . . . . . . . . . . . . . . 93
5.1 Hop count changes versus link fluctuations. . . . . . . . . . . . . . . . . 98
5.2 Illustrations in continuous domain. . . . . . . . . . . . . . . . . . . . . . 100
5.3 Proof of Theorem 5.1. . . . . . . . . . . . . . . . . . . . . . . . . . . . . 102
5.4 Holes and indicator nodes elected for different holes. . . . . . . . . . . . 109
5.5 Locations of indicator nodes. Blue line shows the bisector cut. . . . . . . 110
5.6 Delay and communication cost . . . . . . . . . . . . . . . . . . . . . . . 111
5.7 Transformation type identification . . . . . . . . . . . . . . . . . . . . . 114
5.8 Hole estimation . . . . . . . . . . . . . . . . . . . . . . . . . . . . . . . 116
5.9 Breadth and depth . . . . . . . . . . . . . . . . . . . . . . . . . . . . . . 119
5.10 Effect of existing holes . . . . . . . . . . . . . . . . . . . . . . . . . . . 122
6.1 A simple management architecture for wireless sensor networks . . . . . 125
6.2 The coverage and connectivity management system. . . . . . . . . . . . . 127
6.3 The flow diagram of the system initialization process. . . . . . . . . . . . 131
6.4 Illustration of normal system operation. . . . . . . . . . . . . . . . . . . 132
ix
List of Tables
4.1 Average values of u
i
and (m
i
−v
i
) after applying Bloom filter. . . . . . . 82
x
Chapter 1
Introduction
1.1 Wireless Sensor Networks
The technologies of semiconductors, wireless communications and computing have en-
joyed rapid development in the twentieth century. Microprocessors, wireless radio transceivers
and batteries have been greatly improved in terms of performance, size and price. This
progress, together with the marked advances in the area of microsensors, has allowed the
integration of automatic sensing, embedded computing and wireless networking, at low
cost, to quickly become a reality.
Low-power and tiny sensor nodes, each empowered with the ability of sensing, com-
putation and wireless communication, enable a broad range of applications. They are
normally deployed on large scale over the geographic region of interest, and cooperate
among themselves distributively for various sensing, tracking, and actuation tasks. The
potential applications of these networked sensors are enormous: e.g., habitat monitoring,
environmental monitoring, smart home and office, inventory tracking, precision agricul-
ture, transportation, military, health care, and many more.
Wireless sensor networks (WSNs), consisting of hundreds and thousands of such
smart sensor nodes, have received a lot of attention recently. During the past decade,
many testbeds and commercial products have been built - bird habitat observations [66],
1
ocean water monitoring [2], avalanche rescue [70], and army weapon tracking [6], just to
name a few. It is not hard to foresee that with further advances in technologies, networked
tiny sensors will soon be integrating into people’s everyday activities and transforming the
way people understand and manage the environment. In fact, wireless sensor networks
are considered to be one of the most important technologies that may revolutionize the
world [34, 33, 83, 22].
The advantages of wireless sensors over traditional wired ones lie in their ability to
perform wireless communication and distributed local processing. These sensor nodes
can be easily deployed in many hard-to-reach or hazard locations that are inaccessible to
wired sensors. The large-scale deployment of wireless sensor networks allows the sensor
nodes to be placed closer to the phenomena being monitored and thus resulting in larger
signal-to-noise ratio and higher possibility of line-of-sight sensing. On the other hand,
distributed local processing among low-cost and densely-deployed sensors is not only a
cheaper solution compared to expensive and sparsely-deployed wired sensors but also
provides more accuracy and robustness.
However, despite the many benefits of wireless sensor networks, most sensor network
applications encounter one or more of the following challenges.
• Sensor nodes are untethered and hence energy consumption is of critical impor-
tance. The limited bandwidth of wireless communications also creates additional
barriers.
• Sensor nodes are deployed in an ad hoc manner and most of the protocols and
algorithms used are distributed in nature.
• Sensor nodes often operate in a dynamic environment. They may fail at any time
and the wireless links are time-varying.
• Computation, storage and memory efficiencies need to be carefully considered in
many cases due to the size and cost requirements of sensor network applications.
2
• Different sensor network applications impose different requirements and constraints
on the system design and it is not possible to have one unified structure that works
for all.
On one hand, wireless sensor networks have a bright future; on the other hand, there
are a large number of technical challenges awaiting to be tackled. This has spurred
tremendous research interest in sensor networks since the mid-1990s: ranging from phys-
ical layer to application layer, and from low level signal processing to high level security
issues. This thesis focuses on two of the most important and fundamental research areas
in wireless sensor networks, namely coverage and connectivity.
1.2 Coverage and Connectivity in WSNs
Coverage is a measure of the quality of service provided by a sensor network. Due to
the attenuation of energy propagation, each sensor node has a sensing gradient, in which
the accuracy and probability of sensing and detection attenuate as the distance to the
node increases. The total coverage of the whole network can therefore be defined as the
union (including possible cooperative signal processing) of all nodes’ sensing gradients.
It represents how well each point in the sensing field is covered. A coverage hole refers
to a continuous area (or volume in 3-dimensional space) in the sensing field that is not
covered by any sensor node, i.e., the events that occurred within a coverage hole cannot
be sensed nor detected.
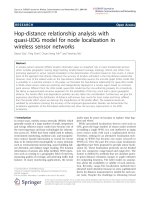
Figure 1.1(a) shows a coverage example where the sensing gradient of a sensor node
is modeled as a binary disk. Every point within the sensing radius R
s
of a sensor node is
considered to be covered by the node. The union of all the disks forms the total coverage
of the network. The region of interest is enclosed by a rectangle in the Figure. The
shadowed region is not covered by any sensor node and thus considered to be a coverage
hole.
Similarly, connectivity represents how well the sensor nodes in the network are “con-
3
R
s
A
B
C
D
E
(a) Coverage and coverage hole
R
c
A
B
C
D
E
(b) Connectivity graph
Figure 1.1: Illustrations of coverage and connectivity.
nected” to each other. It is a fundamental property of a wireless sensor network, for many
upper-layer protocols and applications, such as distributed signal processing, data gath-
ering and remote control, require the network to be connected. Since the sensor nodes
communicate via wireless medium, a node can only directly talk to those that are in close
proximity to itself (within its communication range). If a sensor network is modeled as
a graph with sensor nodes as vertices and direct communication links between any two
nodes as edges, by a connected network we mean the graph is connected.
Figure 1.1(b) shows the connectivity graph of the same set of nodes as in Figure
1.1(a). The communication model in this example is also a binary disk model where if
the distance between two nodes is greater than the communication range R
c
, they cannot
talk to each other directly. Every node in Figure 1.1(b) can communicate with every
other node, either directly or indirectly via some intermediate nodes. The network is thus
connected.
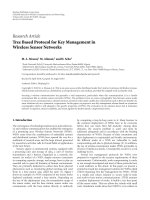
Although coverage and connectivity have many differences, they are not unrelated.
In fact, a covered network and a connected network are closely related due to their com-
mon requirement on the geographical placement of sensor nodes. A completely covered
network requires that each point in the sensing region to be covered by at least one sensor
node. This implies that the distance between a node and its closest neighbor cannot be
4
R
s
R
c
A
B
(a) Covered region and connected nodes
A
B
(b) Coverage hole and topological hole
Figure 1.2: Relationship between coverage and connectivity.
larger than some threshold to avoid coverage holes. A similar implication can be drawn
from a connected network.
Coverage is generally a stronger constraint on sensor node placement because it re-
quires every point in the region to be covered by at least one node. If a region is “well”
covered by a set of sensor nodes, these nodes are likely to be “well” connected if the
communication radius is large enough. It is proven [99, 107] that with the binary disk
sensing and communication models, if R
c
≥2R
s
, a completely covered network implies a
connected network. On the contrary, connectivity does not imply coverage regardless the
relationship between R
c
and R
s
. However, if the set of sensor nodes are “well” connected,
the region where these connected nodes are deployed is also likely to be “well” covered
by intuition.
The intuition behind this result can be explained using a simple example shown in
Figure 1.2(a). A point that is just outside the sensing range of node A has to be covered
by another node (node B in the example). This implies that the distance between A and B
must be less than 2R
s
. The two nodes are then connected to each other if R
c
≥ 2R
s
. On
the other hand, when node A and node B are connected, the region between A and B is
likely to be well covered if the sensing range R
s
is not too small.
5
The relationship between coverage and connectivity can also be understood in terms
of coverage and topological holes. As defined previously, a coverage hole is a geograph-
ical region where events cannot be detected by any sensor node. On the other hand, a
topological hole or a routing hole is a kind of connectivity anomaly which causes the
routing path between two nodes to be unnecessarily long relative to their physical loca-
tions. Because both types of holes are created due to the lack of sensor nodes in the hole
region
1
, a coverage hole generally implies a topological hole in the same region, and vice
versa (excluding boundary conditions). This is especially true when the size of hole is
much larger than both the sensing and communication ranges.
An example is shown in Figure 1.2(b), where a topological hole is created in the
area of interest. The messages from node A have to be routed along the boundary of the
topological hole to reach node B. If the sensing range R
s
is small compared to the size
of the hole, the topological hole naturally implies a coverage hole in the same region.
Similarly, a coverage hole implies a topological hole too.
1.3 Coverage and Connectivity Management
Due to the large variety of application requirements and physical parameters of sensor
nodes, the problems involving coverage and connectivity are highly diverse. Taking cov-
erage as an example, according to the different application objectives, coverage can be
classified into point coverage, barrier coverage, and area coverage [15, 45]. Each of
the classification can be further subclassified. Furthermore, each of the problem can be
tackled from different angles according to assumptions like whether a centralized or dis-
tributed algorithm is required, the sensing and communication model used, and the avail-
ability and accuracy of localization.
It is generally difficult, if not impossible, to construct a single framework that solves
all problems. This thesis focuses on the problem of area coverage and connectivity man-
1
With the exception that the topological holes or routing holes can also be created due to obstacles.
6
agement, which is defined as the activities, methods and procedures to monitor and control
the network sensing coverage (area coverage) and connectivity. It involves the functions
of coverage and connectivity planning, monitoring and maintenance according to user
needs.
Network management is by itself a broad topic. The network management functions
are traditionally categorized into the well-known FCAPS (fault, configuration, account-
ing, performance and security) in ISO Telecommunications Management Network model.
However, this categorization is defined for broad-sense network management and does not
directly apply when the focus is narrowed down to coverage and connectivity manage-
ment. In this work, the coverage and connectivity management functions are categorized
into microscale management and macroscale management according to the geographical
scale upon which the collaboration between sensor nodes takes place.
Microscale management controls network coverage and connectivity by monitoring
and controlling each node’s local coverage and connectivity. It only requires collaboration
among the sensor nodes in close proximity (e.g., the 1-hop neighbors). Management tasks
like local coverage and connectivity monitoring [27, 29], coverage control [107, 99], and
topology control [88, 14] belong to this category. As opposed to microscale management,
management in macroscale level involves collaboration of sensor nodes that are far away
geographically. Management tasks like topological hole boundary detection and coverage
hole boundary detection [100, 21] fall under this category.
The categorization of microscale and macroscale management is justified by the fact
that coverage and connectivity problems can be investigated at both microscale level,
where the focus is on the coverage and connectivity of individualcomponents, and macroscale
level, where the focus is on the coverage and connectivity over a large geographical scale.
For example, collecting each sensor node’s connectivity (neighbor table) information
at the central controller belongs to the problem of microscale connectivity monitoring.
While monitoring a large-scale topological hole belongs to the problem of macroscale
connectivity monitoring.
7
Locali
zation
Microscale
Macroscale
Monitor
Control
Neighbor
Management,
Topology Control,
Coverage
Scheduling
Connectivity/
Coverage
Monitoring
Sensor
Deployment,
Hole
Recovery
Coverage/
Topological Hole
Monitoring
Figure 1.3: Coverage and connectivity management system.
The microscale management and macroscale management can be more precisely de-
fined using the concept of OSI network model. Microscale coverage and connectivity
management resides in data link layer and provides coverage and connectivity support
for network layer protocols. On the other hand, macroscale coverage and connectivity
management resides in application layer and provides coverage and connectivity support
for other application layer protocols.
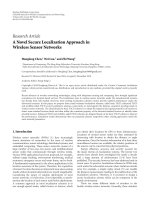
Figure 1.3 shows the general coverage and connectivity management architecture in
sensor networks. It categorizes the coverage and connectivity management functions into
four categories: microscale monitoring, microscale controlling, macroscale monitoring
and macroscale controlling. The thesis mainly works on the problems in the first three
categories, which are enclosed in bolded lines in the figure. Localization is an important
property for coverage and connectivity management, for most problems involving cov-
erage and connectivity require some form of localization support. This is also shown in
Figure 1.3.
1.4 Problem Formulation and Thesis Contribution
This thesis addresses the following questions related to the coverage and connectivity
monitoring and controlling at both microscale and macroscale levels.
8
1. How to control the sensor nodes’ behavior such that the coverage and connectivity
requirements are satisfied? Sensor nodes are normally over deployed in the sensing
region to enhance system reliability. To save energy, only a partial collection of
nodes need to be active at any particular time while maintaining the coverage and
connectivity requirements. This problem belongs to the category of microscale
coverage (area coverage) and connectivity control.
2. How to collect each sensor node’s local connectivity information at the central con-
troller? Collecting each sensor node’s local connectivity (neighbor table) gener-
ally encounters very high communication cost. This is because each node’s neigh-
borhood information is normally very large and it has to be routed to the central
controller via multiple hops periodically (for continuous connectivity monitoring).
Thus, microscale connectivity monitoring at low communication cost is not a trivial
problem and requires careful study.
3. How to detect and monitor the large-scale coverage or topological holes in sen-
sor network? Large-scale coverage and topological holes can be naturally derived
from microscale coverage and connectivity information collected at the central con-
troller. However, if only macroscale information is required, solving it at the mi-
croscale level is generally not efficient. More efficient algorithms on large-scale
hole detection and monitoring are needed. This problem belongs to the category of
macroscale coverage and connectivity monitoring.
Note that simply solving these problems is not difficult, the challenges lie in the fact
that the proposed solutions have to be efficient and scalable. Efficiency in sensor networks
requires low communication overhead and low energy cost. This is an important measure
due to the fact that the sensor nodes are untethered and powered by batteries. Scalability
is also an important measure because of possibility of very large-scale deployments. In
addition, distributed solutions are preferred in most scenarios rather than centralized ones
to ensure resiliency.
9
This thesis systematically investigates these coverage and connectivity management
problems. In particular, this thesis proposes:
1. A distributed node scheduling algorithm for microscale coverage and connectivity
control. The proposed protocol relies on the distance estimates of the neighboring
sensor nodes and does not require network localization. Unlike most existing re-
search that works on complete coverage, the protocol works on partial coverage and
the coverage objective can be configured by the network administrators.
2. An efficient way for partial or complete microscale connectivity collection. The
problem is tackled by three components (vector distance, Bloom filters and signa-
ture hashing). By smart combination of these components, the network connectivity
can be collected at different level of details with low communication cost. The pro-
posed protocol is supported by the theoretical analysis on Bloom filters.
3. An efficient algorithm for large-scale hole detection, monitoring and estimation by
observing the network connectivity changes. Based on the theoretical analysis on
the geometric properties of holes, the holes can be detected and estimated using
only a few indicator nodes, which requires very low communication cost.
All these proposed protocols are simple, lightweight and easy to implement, and they
achieve the coverage and connectivity management objectives with much lower commu-
nication cost compared to existing protocols.
The thesis then integrates these proposed solutions into a unified coverage and con-
nectivity management system, which allows the network administrators to monitor and
control the network coverage and connectivity, at both microscale and macroscale levels
2
. The dependencies of these individual components are analyzed and system initializa-
tion and operation sequences are explained.
2
This thesis only provides the conceptual design of the management architecture. The implementation
of the management system is left for future work.
10
1.5 Thesis Organization
Chapter 2 briefly introduces various localization techniques with the main focus on two
localization techniques: connectivity-based localization and sequentially distance-based
localization, for the proposed unified coverage and connectivity management framework
relies on these two techniques. The related work in coverage and connectivity monitoring
and controlling, both in microscale and macroscale, is also given.
Chapter 3 presents the design of Configurable Coverage Protocol (CCP) – a node
scheduling protocol for microscale coverage control. The goal of CCP is to schedule the
on and off of the sensor nodes for energy saving while maintaining the network coverage
and connectivity. CCP allows partial network coverage (with the configurable coverage
parameter α) thus using a smaller number of active nodes compare to protocols that pro-
vide full coverage.
Chapter 4 presents H
2
CM – a microscale connectivity monitoring protocol. H
2
CM
is an efficient way to encode the neighborhood information of each sensor nodes, such
that the communication cost of microscale connectivity collection can be much reduced.
H
2
CM utilizes several methods under different situations for the optimal information col-
lection.
Chapter 5 presents an efficient large-scale topological hole detection and monitoring
protocol. The protocol relies on the information of maximum connectivity change in the
network due to the formation of the hole to detect the hole and estimate its size. Note that
although the protocol is targeted at topological holes, the results obtained can be regarded
as coverage holes too if the hole sizes detected are large.
Chapter 6 presents a unified coverage and connectivity management framework, by
integrating the previously proposed solutions. Conclusions and possible future work are
shown in Chapter 7.
11
Chapter 2
Related Work
As mentioned in previous chapter, localization is an important property for coverage and
connectivity management. In this chapter, various localization techniques will be briefly
introduced first, with the main focus on two localization techniques: connectivity-based
localization and sequentially distance-based localization. The unified coverage and con-
nectivity management framework proposed in this thesis relies on these two localization
techniques. The related work in coverage and connectivity monitoring and controlling,
both at microscale and macroscale levels, will then be given.
2.1 Localization Techniques
Localization is the process of discovering the two-dimensional or three-dimensional po-
sitions of sensor nodes. It is an important property for coverage and connectivity man-
agement. Most problems involving coverage and connectivity, from microscale coverage
control, to macroscale hole monitoring (e.g., knowing the hole location and size), re-
quire some form of localization. This section introduces a general background on the
existing localization approaches, with the focus on two types of localization techniques:
connectivity-based and sequential distance-based localization.
12
2.1.1 A Brief Summary on Localization Techniques
Various localization schemes can be classified into two categories in literature: range-
based approaches and range-free approaches. Range-based approaches assume that the
range information among the sensor nodes (e.g., distance and relative directions) is avail-
able, while range-free approaches do not require any range information.
Several hardware technologies provide the capability to measure the distance and
relative directions between two sensor nodes. These technologies include Time of Ar-
rival (TOA), Time Difference of Arrival (TDOA), Received Signal Strength (RSS) and
Angle of Arrival (AOA). All these techniques estimate the distance or angle information
among the sensor nodes with some hardware support. Localization algorithms based on
TOA or TDOA, such as Global Positioning System [49] and the cricket system [80], nor-
mally have high accuracy. However, they all require expensive and energy-consuming
devices and their accuracy also rely on the line-of-sight signal propagation. On the other
hand, RSS and AOA [73] based techniques have relatively low accuracy, because they
normally suffer from signal fading and Doppler effect. Recently, researchers have found
that the techniques such as TOA, TDOA and AOA can achieve better accuracy in an
ultra-wideband system over a normal wireless system [44].
Range-based localization methods assume that the sensor nodes are equipped with
one or several of the ranging techniques introduced above. They can be mainly classi-
fied into two categories: the global localization algorithms and the sequential localization
algorithms. The global localization algorithms localize all the sensor nodes simultane-
ously, either by relating the ranging information to some anchor nodes
1
[49, 80], or by
some centralized computation using the collected ranging information among the sensor
nodes [8, 55, 89, 64]. On the other hand, the sequential localization algorithms localizes
the sensor nodes sequentially (and mostly distributively) using local ranging information
[32, 7, 72, 73]
Rage-free localization methods are generally more cost-effective and lightweight than
1
Anchor nodes are a small set of selected nodes whose locations are known.
13
range-based localization, due to the fact that they do not require any special hardware de-
vices. The Centroid method [11] requires that the anchors have very large transmission
ranges such that each node can hear from multiple anchors. The sensor nodes estimate
their locations by calculating the center of all the anchors it can hear. APIT [46] lets each
node estimate whether it resides inside or outside the triangles bounded by the anchors it
can hear, and locations can be estimated by overlapping the triangle regions that a sensor
node could possibly reside in. Embedding approaches [30, 52, 90] rely on various opti-
mization techniques to centrally project the nodes to their geographical locations using
only connectivity information. Connectivity-based methods [74, 62] utilize the hop count
information to several anchors for sensor node localization.
Each localization algorithm has its own advantages and defects. Throughout the rest
of this thesis, we only utilize the connectivity-based and distance-based localization meth-
ods.
2.1.2 Connectivity-based Localization
Connectivity-based localization algorithms only utilize connectivity information (e.g. hop
count). They are lightweight and do not require extra hardware devices. Although they
may have large localization errors, these errors do not cause significant impact on some
applications such as connectivity monitoring (Chapter 4) and macroscale hole detection
and monitoring (Chapter 5).
DV-hop [74] is probably the simplest connectivity-based localization method. The
system contains some anchor nodes whose locations are known. Each node measures
its hop counts to the anchors. DV-hop relies on the heuristic of proportionality between
the distance and hop count in isotropic networks. The system firstly estimates the average
distance-per-hop from anchor locations and the hop counts among the anchors. Each node
then estimates its own distance to the anchors using the hop count information. The final
location of each sensor node can be decided by trilateration [54]. The localization error
of DV-hop can be in the scale of the sensor communication range R
c
. However, such an
14