gene regulatory element prediction with bayesian networks
Bạn đang xem bản rút gọn của tài liệu. Xem và tải ngay bản đầy đủ của tài liệu tại đây (6.02 MB, 242 trang )
GENE REGULATORY ELEMENT
PREDICTION WITH BAYESIAN NETWORKS
VIPIN NARANG
NATIONAL UNIVERSITY OF SINGAPORE
2008
GENE REGULATORY ELEMENT
PREDICTION WITH BAYESIAN NETWORKS
VIPIN NARANG
(M.S. Research (Electrical Engineering) , I.I.T. Delhi)
(B. Tech. (Electrical Engineering), I.I.T. Delhi)
A THESIS SUBMITTED
FOR THE DEGREE OF DOCTOR OF PHILOSOPHY
DEPARTMENT OF COMPUTER SCIENCE
NATIONAL UNIVERSITY OF SINGAPORE
2008
iii
ACKNOWLEDGEMENTS
I wish to sincerely thank my advisors Dr. Wing Kin Sung and Dr. Ankush Mittal.
Dr. Sung‟s constant interest in this research and regular meetings and discussions with
him have been very valuable. Many of the ideas in this thesis were generated and refined
through these discussions. His concern in ensuring high quality of the work has led to
many improvements in both the work and the presentation. He has been very generous in
giving his time whenever I wanted and prompt in giving his reviews. He has always been
very supportive throughout my PhD and tolerant towards my shortcomings.
Dr. Ankush introduced and guided me in the subjects of Bayesian networks and
bioinformatics and helped me to to obtain the research direction early on. He extended
himself just as an elder brother to share with me his experience in conducting research
and in dealing with the research environment and helped me through many difficult times.
Several meetings and regular communications with him and his own example were
helpful in giving focus and direction to this work. Without his help none of the
publications from this work would have been possible.
I owe my deepest gratitude to Dr. Krishnan V. Pagalthivarthi, my most well
wishing teacher and guide, who took the entire responsibility and personal difficulties for
training me and guiding me throughout my research career. I had neither any clue nor
capacity to pursue graduate studies. Since my B. Tech. days, enormous amounts of his
time and effort have gone into cultivating me as a sincere student and taking me through
every single step. His personal concern prior to and throughout this thesis work has made
it materialize. His example as a very dedicated and caring teacher has left a deep
iv
impression on me. I am also indebted to him for giving me a meaningful purpose and
vision for using this doctoral study.
I am grateful to my friend Sujoy Roy for being a great support and well wisher
althroughout my stay at NUS. He is a very sincere student and I have benefitted in many
ways from his association. He always extended himself in times of need and also gave
valuable suggestions for the improvement of this thesis. I also wish to thank my friends
Akshay, Amit Kumar, Sumeet, Anjan, Pankaj, Girish, Ganesh, Kalyan and others who
have helped and supported me here.
Thought provoking discussions with my colleague Rajesh Chowdhary on
Bayesian networks and gene regulation were valuable in deepening my understanding of
these subjects.
I sincerely thank my parents, my elder brother Nitin, and my Masters thesis
advisor Prof. M. Gopal for their sacrifices to support me and encouraging my pursuit of
graduate studies.
Vipin Narang
v
TABLE OF CONTENTS
ACKNOWLEDGEMENTS III
TABLE OF CONTENTS V
SUMMARY VII
LIST OF TABLES IX
LIST OF FIGURES XI
LIST OF SYMBOLS XIX
LIST OF ACRONYMS XXI
PUBLICATIONS XXIII
CHAPTER - I 1
INTRODUCTION 1
I-1 BACKGROUND 1
I-2 MOTIVATION FOR PRESENT RESEARCH 9
I-3 NATURE OF THE PROBLEM 16
I-4 RESEARCH OBJECTIVES 21
I-5 ORGANIZATION OF THE THESIS 28
CHAPTER - II 29
LITERATURE REVIEW 29
II-1 DETECTION OF DNA MOTIFS 29
II-2 GENERAL PROMOTER MODELING AND TRANSCRIPTION START SITE PREDICTION 33
II-3 MODELING AND DETECTION OF CIS-REGULATORY MODULES 35
CHAPTER - III 39
PRELIMINARIES 39
III-1 STOCHASTIC MODEL OF THE GENOME 39
III-2 COMPUTATIONAL MODELING OF PROTEIN-DNA BINDING SITES (MOTIFS) 42
III-3 BAYESIAN NETWORKS 46
III-4 MEASURES OF ACCURACY 51
CHAPTER - IV 55
DETECTION OF LOCALIZED MOTIFS 55
IV-1 PROBLEM DEFINITION 56
IV-2 SCORING FUNCTION 57
IV-3 COMBINED SCORE 62
IV-4 ALGORITHM 63
IV-5 IMPLEMENTATION 67
vi
IV-6 RESULTS 68
IV-6.1 Analysis of the scoring function 68
IV-6.2 Performance on Simulated datasets 71
IV-6.3 Performance on Real datasets 75
IV-7 CONCLUSIONS 81
CHAPTER - V 83
GENERAL PROMOTER PREDICTION 83
V-1 INTRODUCTION 83
V-2 STRUCTURE OF HUMAN PROMOTERS 85
V-3 OLIGONUCLEOTIDE POSITIONAL DENSITY 88
V-4 BAYESIAN NETWORK MODEL FOR GENERAL PROMOTER PREDICTION 91
V-4.1 The Promoter Model 91
V-4.2 Naïve Bayes Classifier Representation 94
V-4.3 Modeling and Estimation of Positional Densities 95
V-5 INFERENCE OVER LONG GENOMIC SEQUENCES 98
V-6 IMPLEMENTATION 100
V-7 RESULTS 101
V-7.1 Prominent Features Correspond to Well-Known Transcription Factor Binding Motifs 101
V-7.2 Results of TSS Prediction 102
V-8 CONCLUSIONS 110
CHAPTER - VI 113
CIS-REGULATORY MODULE PREDICTION 113
VI-1 MODULEXPLORER CRM MODEL 114
VI-2 DATA 116
VI-3 METHODS 119
VI-4 TRAINING OF MODULEXPLORER 130
VI-5 PAIRWISE TF-TF INTERACTIONS LEARNT DE-NOVO BY THE MODULEXPLORER 132
VI-6 GENOME WIDE SCAN FOR NOVEL CRMS 137
VI-7 FEATURE BASED CLUSTERING OF CRMS 143
VI-8 IMPLICATIONS OF MODULEXPLORER 161
CHAPTER - VII 163
CONCLUSIONS AND FUTURE WORK 163
APPENDIX 179
SUPPLEMENTARY FIGURES 189
REFERENCES 207
vii
SUMMARY
While computational advances have enabled sequencing of genomes at a rapid
rate, annotation of functional elements in genomic sequences is lagging far behind. Of
particular importance is the identification of sequences that regulate gene expression.
This research contributes to the computational modeling and detection of three very
important regulatory elements in eukaryotic genomes, viz. transcription factor binding
motifs, gene promoters and cis-regulatory modules (enhancers or repressors). Position
specificity of transcription factor binding sites is the main insight used to enhance the
modeling and detection performance in all three applications.
The first application concerns in-silico discovery of transcription factor binding
motifs in a set of regulatory sequences which are bound by the same transcription factor.
The problem of motif discovery in higher eukaryotes is much more complex than in
lower organisms for several reasons, one of which is increasing length of the regulatory
region. In many cases it is not possible to narrow down the exact location of the motif, so
a region of length ~1kb or more needs to be analyzed. In such long sequences, the motif
appears “subtle” or weak in comparison with random patterns and thus becomes
inaccessible to any motif finding algorithm. Subdividing the sequences into shorter
fragments poses difficulties such as choice of fragment location and length, locally over-
represented spurious motifs, and problems associated with compilation and ranking of the
results. A novel tool, LocalMotif, is developed in this research to detect biological motifs
in long regulatory sequences aligned relative to an anchoring point such as the
transcription start site or the center of the ChIP sequences. A new scoring measure called
spatial confinement score is developed to accurately demarcate the interval of
localization of a motif. Existing scoring measures including over-representation score
and relative entropy score are reformulated within the framework of information theory
and combined with spatial confinement score to give an overall measure of the goodness
of a motif. A fast algorithm finds the best localized motifs using the scoring function.
The approach is found useful in detecting biologically relevant motifs in long regulatory
sequences. This is illustrated with various examples.
Computational prediction of eukaryotic promoters is another tough problem, with
the current best methods reporting less than 35% sensitivity and 60% ppv
1
. A novel
statistical modeling and detection framework is developed in this dissertation for
1
Transcription start site prediction accuracy on ENCODE regions of the human genome within ±250 bp
error [Bajic et al. (2006)].
viii
promoter sequences. A number of exisiting techniques analyze the occurrence
frequencies of oligonucleotides in promoter sequences as compared to other genomic
regions. In contrast, the present approach studies the positional densities of
oligonucleotides in promoter sequences. A statistical promoter model is developed based
on the oligonucleotide positional densities. When trained on a dataset of known promoter
sequences, the model automatically recognizes a number of transcription factor binding
sites simultaneously with their occurrence positions relative to the transcription start site
(TSS). The analysis does not require any non-promoter sequence dataset or modeling of
background oligonucleotide content of the genome. Based on this model, a continuous
naïve Bayes classifier is developed for the detection of human promoters and
transcription start sites in genomic sequences. Promoter sequence features learnt by the
model correlate well with known biological facts. Results of human TSS prediction
compare favorably with existing 2
nd
generation promoter prediction tools.
Computational prediction of cis-regulatory modules (CRM) in genomic sequences
has received considerable attention recently. CRMs are enhancers or repressors that
control the expression of genes in a particular tissue at a particular development stage.
CRMs are more difficult to study than promoters as they may be located anywhere up to
several kilo bases upstream or downstream of the gene‟s TSS and lack anchoring features
such as the TATA box. The current method of CRM prediction relies on discovering
clusters of binding sites for a set of cooperating transcription factors (TFs). The set of
cooperating TFs is called the regulatory code. So far very few (precisely three)
regulatory codes are known which have been determined based on tedious wet lab
experiments. This has restricted the scope of CRM prediction to the few known module
types. The present research develops the first computational approach to learn regulatory
codes de-novo from a repository of CRMs. A probabilistic graphical model is used to
derive the regulatory codes. The model is also used to predict novel CRMs. Using a
training data of 356 non-redundant CRMs, 813 novel CRMs have been recovered from
the Drosophila melanogaster genome regulating gene expression in different tissues at
various stages of development. Specific regulatory codes are derived conferring gene
expression in the drosophila embryonic mesoderm, the ventral nerve cord, the eye-
antennal disc and the larval wing imaginal disc. Furthermore, 31 novel genes are
implicated in the development of these tissues.
ix
LIST OF TABLES
Table IV-1. Results of using LocalMotif to analyze simulated sequences of
length 3000 bp containing a planted (7,1) motif ATGCATG –
five top scoring motifs and their predicted localization intervals
are reported. 69
Table IV-2. Ranges of parameters studied in simulated short sequence
datasets. 71
Table IV-3. Accuracy of motif detection in synthetic long sequence datasets 75
Table V-1. Results of cross-validation studies in the training of BayesProm.
The complete dataset of 1796 human promoter sequences was
randomly divided into 1436 training sequences (80%) and 360
validation sequences (20%). Five such uncorrelated cross-
validation sets were generated. A negative set of 5000 human
exon and 3‟ UTR sequences obtained from Genbank was used
simultaneously for testing. 101
Table VI-1. Overlap of novel CRMs predicted by Modulexplorer with
CRMs predicted in previous computational studies. 140
Table VI-2. Clusters of CRMs sharing a common regulatory code (motifs)
obtained using iterative frequent itemset mining. Five major
clusters are listed with their (i) predominant tissue and stage of
expression, (ii) number of known and predicted CRM target
genes, (iii) number of predicted CRM target genes with
validation, (iv) number of validated genes which are novel for
their role in development, and (v) false positive rate of the
regulatory code on other training CRMs and random
background sequences. 145
x
xi
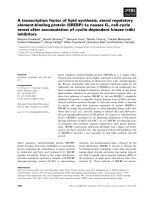
LIST OF FIGURES
Figure I-1. Annotated DNA sequence of the 5‟ region of the human PAX3
gene [Macina et al. (1995), Okladnova et al. (1999), Barber et al.
(1999)]. Notable features shown include (i) promoter region, (ii)
transcription start site, (iii) transcription factor binding sites
such as TATA box, CAAT box, AP-1, AP-2, SP1, (iv) repressor
element, (v) nucleotide repeats, (vi) 5‟ untranslated region
(UTR), (vii) coding sequence with its amino acid translations,
(viii) exon, (ix) intron, and (x) splice site. 3
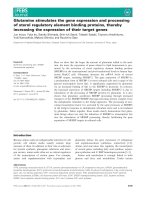
Figure I-2. The locations of gene coding and noncoding regions and the
promoter in a DNA strand. The promoter region is present
surrounding the start of (and mostly upstream of) the transcript
region. Other elements such as enhancer may be present far
distant from the transcription start site 4
Figure I-3. Formation of pre-initiation complex through the binding of
transcription factors to DNA nearby the transcription start site
[Pederson et al. (1999)]. 6
Figure I-4. Several genomic features are currently being computationally
annotated in the human genome in the ENCODE project. The
present research focuses on three features in the regulatory
sequence track: transcription start sites, transcription factor
binding sites (motifs) and enhancers (cis-regulatory modules). 10
Figure I-5. The “Genomes to Life” program of the U.S. Department of
Energy [Frazier et al. (2003)] plans for the next 10 years to use
DNA sequences from microbes and higher organisms, including
humans, as starting points for systematically tackling questions
about the essential processes of living systems. Advanced
technological and computational resources will help to identify
and understand the underlying mechanisms that enable
organisms to develop, survive, carry out their normal functions,
and reproduce under myriad environmental conditions 11
Figure I-6. Applications of the present research in current bioinformatics
context. 12
Figure I-7. Transcription factor binding motifs, promoters and CRMs are
all associated with a notion of position specificity. 15
Figure I-8. Discovering (6,1) motifs within a set of N sequences
12
, , ,
N
S S S
of length L. In (a) the random pattern TTTAAA is
seen to eclipse the real motif TTGACA when the complete
xii
sequence is analyzed, but in (b) the real motif TTGACA
becomes dominant when only the local interval (p
1
,p
2
) is
considered. 23
Figure I-9. Difference between the distribution of binding sites of (a) a
localized motif, and (b) a spurious motif. While both may
appear over-represented in a local sequence interval, localized
motifs have a prominent region of confinement within the entire
sequence length. 23
Figure I-10. An illustration of the difficulties in analyzing sub-intervals of
long regulatory sequences – for short intervals, motifs A and C
are missed, and for long intervals the motifs may become weak. 24
Figure II-1. Computational models for cis-regulatory modules: (a)
homotypic cluster of TFBS [Markstein et al. (2002)], (b)
heterotypic cluster of TFBS [Berman et al. (2002)], (c) hidden
Markov model [Frith et al. (2001)], (d) statistical model of
Gupta and Liu (2005), (e) discriminatory Bayesian network
model of Segal and Sharan (2005). 36
Figure III-1. Finite state machine visualization of a first order Markov model
for sequence background. 41
Figure III-2. A small sample of binding sites for the transcription factor NF-
Y. 43
Figure III-3. Single-letter IUPAC codes for representing degeneracy of
nucleotides. 43
Figure III-4. Positional weight matrix developed from the collection of NF-Y
TFBS in Figure III-2. 44
Figure III-5. A Bayesian network for modeling the causes of heart disease. 47
Figure III-6. Conditional probability table (CPT) for the node “obesity” in
the Bayesian network of Figure III-5. 48
Figure III-7. The Receiver Operating Characteristics (ROC) curve 53
Figure IV-1. Discovering (6,1) motifs within a set of N sequences
12
, , ,
N
S S S
each of length L. The random pattern TTTAAA is
seen to eclipse the real motif TTGACA. 57
Figure IV-2. Illustration of how spatial confinement score finds the shortest
interval encompassing the maximum proportion of TFBS –
though interval A has higher density of TFBS, its score is lower
since a large proportion of TFBS still lie outside it. 62
xiii
Figure IV-3. The LocalMotif algorithm 64
Figure IV-4. Contours showing (a) the total score, (b) over-representation
score, and (c) spatial confinement score of the motif
ATGCATG in different position intervals (p
1
,p
2
) of the planted
motif sequences. 70
Figure IV-5. Performance of MEME, Weeder and Localmotif in simulated
short sequence datasets with (a) varying sequence length,
L
, (b)
varying percentage,
k
, of sequences containing motif instances. 73
Figure IV-6. Accuracy of LocalMotif's interval predictions. 73
Figure IV-7. Motifs discovered by MEME and LocalMotif in Drosophila
promoters. 76
Figure IV-8. Variation of sensitivity and false positive rate of Localmotif‟s
predictions in long regulatory sequences upstream of the TSS as
the number of predicted motifs is increased. 79
Figure IV-9. Distribution of forkhead binding sites relative to ER binding
sites. 80
Figure IV-10. Motifs discovered by MEME, Weeder and LocalMotif in ERE
dataset. 80
Figure V-1. Positional densities of the TATA box and CAAT box binding
sites in a set of 1796 promoter sequences obtained from the
eukaryotic promoter database. 86
Figure V-2. An illustration of the positional density of the oligonucleotide
TATAAA, obtained using 1796 human promoter sequences in
EPD. The TSS is located at position 0. The curve indicates the
probability of observing the oligonucleotide TATAAA at
various positions upstream and downstream of the TSS. 90
Figure V-3. (a) Relationship between positional density definition and
training promoter sequences, (b) modeling a nucleotide
sequence, S, for promoter inference (Equation 5.4). 92
Figure V-4. The naïve Bayes classifier for promoter prediction. 95
Figure V-5. Using naïve Bayes classifier to detect promoter region and TSS
in long genomic sequences. 99
Figure V-6. Important consensus sequences recognized by the naïve Bayes
model 103
xiv
Figure V-7. ROC curve showing the TSS prediction performance of
BayesProm and Eponine on Genbank dataset. In case A, TSS
predictions within 200 bp of the annotated TSS were
considered correct, while in case B, this range was extended to
1000 bp. Eponine is seen to be highly specific, while
BayesProm has high sensitivity. 106
Figure V-8. Density of true predictions relative to the annotated TSS on
Genbank dataset. Both Eponine and BayesProm report a
histogram peak at zero distance, indicating the accuracy of these
softwares. Eponine is seen to be highly specific but less
sensitive, while BayesProm is moderately specific but highly
sensitive 106
Figure V-9. Predictions of regulatory regions in the human globin locus
on chromosome 11 (Genbank accession no. U01317) using (a)
Hidden Markov Model by Crowley et al. (1997), (b)
BayesProm, showing only predictions above threshold of –10,
and (c) Interpolated Markov Chain model by Ohler et al. (1999).
It is observed that the HMM in (a) can only predict the locus
control regions, while BayesProm accurately predicts five of the
six transcription start sites with very few false positives. 108
Figure V-10. ROC curve showing the evaluation of BayesProm and several
2nd generation promoter prediction tools on chromosome 22
dataset. The test criterion was same as that used by Scherf et al.
(2001). 109
Figure VI-1. The Modulexplorer pipeline to learn a CRM model from a
repository of uncharacterized CRMs and background sequences,
and to use the model for predicting novel CRMs is shown in (a).
Also shown are the validations that have been conducted in this
study to verify the model and the novel CRMs predicted by the
model 114
Figure VI-2. The Modulexplorer Bayesian network model. The model
describes a CRM as a cluster of multiple interacting TFBS with
distance and order constraints. The nodes
i
D
are the dyad
motifs representing the TFBSs. They have states 0 or 1
according to whether the motif is absent or present in the CRM.
The CRM is their common effect or hypothesis, represented as
the child node. Each dyad motif
i
D
has two monad
components
12
,
ii
MM
with a spacer of 0 to 15 bp. These
monads are represented by individual nodes
12
,
ii
MM
having
states 0 or 1, i.e. present or absent, and are related to the dyad
xv
node
i
D
by a noisy-AND relationship. The spacer length (or
distance), discretized as
low or high, is modeled by the node d
i
.
Furthermore each
i
D
is associated with an order either left or
right according to whether
1i
M
appears to the left or to the right
of
2i
M
in the CRM. 115
Figure VI-3. (a) From a total of 619 experimental CRM sequences obtained
from the REDfly database, 205 redundant CRMs were
discarded, 58 long CRMs (>3.5 kbp) were used as a testing set
and remaining 356 form the training set. The length distribution
of the 356 training CRMs is shown in (b). Most CRMs are
between 200 to 1200 bp long with 1040 bp as the median
length. The functional diversity among the training CRMs is
shown in (c) and (d). Out of the 356 training CRMs, 302 are
expressed in the embryo stage, 193 in the larva stage, and 86 in
the adult fly. Among the 302 CRMs expressed in the embryo,
87 are expressed in the blastoderm stage (stages 3-5) and 205 in
the post-blastoderm stages (stages 6 to 16). Categorization of
the 205 post-blastoderm CRMs in terms of the developing
organ system where they express is shown in (d). The
integumentary system (ectoderm), imaginal precursor (wing
disc, retinal disc etc.), nervous system, digestive system
(abdomen) and muscle system are over-represented classes
among the known CRMs 118
Figure VI-4. Drosophila CRMs have high redundancy of transcription factor
binding sites. The number of binding sites per transcription
factor in a CRM is shown in (a) for 19 CRMs having full
experimental TFBS annotation (average 5.4 binding sites per
TF) and 136 partially annotated CRMs (average 3.6 binding
sites per TF). The fluffy tail test (FTT) scores [Abnizova et al.
(2005)] for these sequences are shown in (b). The sequences
were repeatmasked before computing the FTT to eliminate
tandem repeats that may erroneously cause a high FTT value.
FTT scores of most CRMs are greater than 2.0, indicating
significant redundancy. The FTT scores of fully and partially
annotated CRMs are similar, indicating that partially annotated
CRMs may have greater redundancy than observed in the partial
annotation. The full annotation of 19 CRMs is shown in (c) 120
Figure VI-5. Over the next three pages, the figure illustrates the novel
procedure used in Modulexplorer for characterizing TFBSs de-
novo in a CRM. 122
xvi
Figure VI-6. Potentials
,1 ,2
Pr ,
i i i
D M M
factorized using the hidden nodes
i
B
. 127
Figure VI-7. The TFBSs in Drosophila CRMs appear as repeated or
redundant sites. Modulexplorer locates these redundant sites as
potential TFBSs. The receiver-operating characteristic of
predicting TFBSs using redundant sites in 19 fully annotated
CRMs is shown in (a). Here sensitivity (y-axis) refers to the %
of nucleotides in TFBSs that are overlapped by some redundant
site, while false positive rate (x-axis) refers to the % of
nucleotides in a redundant site that do not match any TFBS.
The maximum effectiveness of TFBS characterization in each
of the 19 CRMs is shown in (b), which is the point in the ROC
curve where Matthew‟s correlation coefficient is maximized.
At this maximum effectiveness, the visual overlap between the
TFBS sites (blue boxes) and the redundant sites (red boxes) in
each CRM is shown in (c). 131
Figure VI-8. Performance of the Modulexplorer in discriminating between
CRM and background sequences. Modulexplorer‟s
performance is compared with two other methods: a Markov
model (orders 2 to 6) and the HexDiff algorithm [Chan and
Kibler (2005)]. The original Hexdiff algorithmuses (6,0) motifs,
but it was extended in this comparison to try several different
(l,d) motifs. Discrimination achieved between training CRMs
and exon sequences in 10-fold cross-validation is shown in (a).
The ROC shows that all three methods could easily discriminate
CRMs from exons. Discrimination between CRMs and non-
coding sequences (intron+intergenic) is shown in (b). Here
Markov model shows no discrimination, HexDiff has marginal
discrimination, while Modulexplorer achieves maximum
discrimination. Modulexplorer was further evaluated on a
separate testing set of 58 CRMs. The number of CRMs of
different types in the test set according to their stage and tissue
of expression is shown in (c). The performance of
Modulexplorer on this test set, shown in (d), is similar to the
training performance. 133
Figure VI-9 Dyad motifs in Modulexplorer most closely resembling the
binding sites of known TFs. 134
Figure VI-10 Pairwise interactions between 61 different TFs learnt de-novo
by the Modulexplorer probability model. Based on the
interaction matrix, the TFs were hierarchically clustered. Six
functionally related groups of TFs were formed: (1) cofactors of
twist in mesoderm and nervous system development, (2) TFs
xvii
involved in imaginal disc development, (3) the antennapedia
complex, (4) TFs expressed in the blastoderm, (5) TFs for eye
development and (6) a miscellaneous set of TFs. Five distinct
clusters are seen in the interaction matrix. Three of the clusters
contain mixed set of TFs from groups 1-4, while two other
clusters correspond to the TF groups 5 and 6. 135
Figure VI-11. Summary of Modulexplorer‟s whole genome CRM predictions:
(a) A stringent score threshold was used for shortlisting
predicted CRM windows such that the false positive rate is
about 0.1%. (b) A total of 1298 windows were predicted above
the chosen threshold, out of which 813 are novel predictions. (c)
The predicted CRMs are significantly over-represented in the
promoter and upstream intergenic regions. (d) This is the list of
level 3 gene ontology (GO) categories statistically over-
represented in the target genes of the predicted CRMs. They
show enrichment in development and regulatory functions
(Bonferroni corrected P-values of the GO associations are
shown alongside). 139
Figure VI-12. The 619 known REDfly CRMs, the 813 CRM windows
predicted by Modulexplorer and a set of 813 randomly
distributed segments were analyzed for their clustering around
genes. A 50 kb long sliding window was scanned over the
genome. The number of windows which contained one or more
CRMs or random segments is shown below. The histogram
shows the number of CRMs or random segments in the window
on x-axis and the number of such windows on y-axis. The
known and predicted CRMs come across in clusters of 3 to 4
CRMs in a window, whereas the randomly distributed segments
are not usually clustered 142
Figure VI-13. The GC content of the predicted CRMs is similar to that of the
known CRMs and higher in general compared to intron and
intergenic sequences. 142
Figure VI-14. Cluster of CRMs controlling target gene expression in the
embryonic mesoderm, and their regulatory code. 146
Figure VI-15. BDGP in-situ expression images for the target genes of novel
CRMs in the mesoderm cluster. 147
Figure VI-16. Matches of the mesoderm regulatory code motifs within the dpp
813 bp enhancer are shown by underlines. For comparison the
known TFBS in this enhancer, available only for the first 600
bp, are shown in red color text. Out of 32 matches of the
xviii
regulatory code motifs in first 600 bp, 26 overlapped known
TFBS. 148
Figure VI-17. Cluster of CRMs controlling target gene expression in the
embryonic ventral nerve cord, and their regulatory code. 151
Figure VI-18. BDGP in-situ expression images for the target genes of novel
CRMs in the ventral nerve cord cluster. 152
Figure VI-19. Cluster of CRMs controlling target gene expression in the
embryonic eye-antennal disc, and their regulatory code. 154
Figure VI-20. BDGP in-situ expression images for the target genes of novel
CRMs in the eye-antennal disc cluster. 155
Figure VI-21. List of novel CRMs separated from the AT-rich clusters which
control target gene expression in the blastoderm embryo. 157
Figure VI-22. BDGP in-situ expression images for the target genes of novel
CRMs in the blastoderm cluster. 158
Figure VI-23. Binding sites for 10 blastoderm TFs were searched in the region
-5000 to +5000 around the 98 predicted blastoderm CRMs. The
CRMs are in the location 0 to 1000. In the CRM region the
binding sites were over-represented by a factor of around 2. The
y-axis shows the total number of binding sites found in the
window in all 98 CRMs. 159
xix
LIST OF SYMBOLS
A
Anchor point / Alignment score
b
A nucleotide base (
, , ,b A C G T
)
B
Background model
c
Binding site concentration within a position interval
n
C
k
Number of combinations =
! ! !n k n k
d
Number of allowed mismatches in a motif
D(.)
Kullback-Leibler distance
e
Number of expected occurrences / Estimated proportion
E[.]
Expectation operator
f(.)
Probability density function
f
Frequency
G
Number of components in a Gaussian mixture
H
A hypothesis
i, j, k
Indices
I
Position interval
K
An oligonucleotide of length l
l
Length of a motif
L
Length of a sequence
L(.)
Likelihood function
n
Number of instances, occurrences or counts
N
Number of sequences
M
A motif
p
Position or probability
xx
Pr(.)
Probability
q
Order of the Markov model
S
A nucleotide (DNA) sequence
s
Step size (refer Section IV-4.2), or an index over
X
A general random variable
w
Weights in a PWM
Z
Z-score
α
Mixing proportion of a component in Gaussian mixture
λ
Likelihood ratio test statistic
,
Promoter, Non-promoter
μ
Mean of a Gaussian density
σ
Variance of a Gaussian density
θ
Set of parameters of a probability model
Gaussian density (pdf)
IUPAC codes for degenerate nucleic acids
A - adenosine M - A C (amino)
C - cytidine S - G C (strong)
G - guanine W - A T (weak)
T - thymidine B - G T C
U - uridine D - G A T
R - G A (purine) H - A C T
Y - T C (pyrimidine) V - G C A
K - G T (keto) N - A G C T (any)
xxi
LIST OF ACRONYMS
AIC
Akaike Information Criterion
BLAST
Basic Local Alignment Search Tool
CC
Cross-correlation Coefficient
cDNA
Complementary DNA
CPT
Conditional Probability Table
CRM
Cis-Regulatory Module
DAG
Directed Acyclic Graph
DCRD
Drosophila Cis-Regulatory Database
DNA
Deoxyribonucleic acid
EM
Expectation Maximization algorithm
EPD
Eukaryotic Promoter Database
FN
False Negative
FP
False Positive
GO
Gene Ontology
HMM
Hidden Markov Model
IUPAC
International Union of Pure and Applied Chemistry
KL
Kullback-Leibler distance
MEME
Multiple EM for Motif Elicitation [Bailey et al. (1994)]
Npv
Negative Predictive Value
ORS
Over-representation Score
Probability density function
Ppv
Positive Predictive Value
PWM
Positional Weight Matrix
xxii
RES
Relative Entropy Score
ROC
Receiver Operating Characterisitics
RR
Rejection Region
SCS
Spatial Confinement Score
Se
Sensitivity
Sp
Specificity
TF
Transcription Factor
TFBS
Transcription Factor Binding Site
TN
True Negative
TP
True Positive
TSS
Transcription Start Site
xxiii
PUBLICATIONS
The following papers have been published / submitted from this research thesis:
1.
Narang, V., Sung, W.K., and Mittal, A. (2005). “Computational modeling of
oligonucleotide positional densities for human promoter prediction.” Artificial
Intelligence in Medicine, 35(1-2), 107-119.
2
Narang, V., Mittal, A., Sung, W.K. (2005). “Discovering weak motifs through
binding site distribution analysis.” 12th International Conference on Biomedical
Engineering (ICBME 2005), Singapore, December 7-10, 2005.
3.
Narang, V., Sung, W.K., and Mittal, A. (2006). “Bayesian network modeling of
transcription factor binding sites.” in: Bayesian Network Technologies: Applications
and Graphical Models, A. Mittal and A. Kassim, eds., Idea Group Publishing,
Pennsylvania, USA.
4.
Narang, V., Sung, W.K., and Mittal, A. “LocalMotif - an in silico tool for detecting
localized motifs in regulatory sequences.” 18th IEEE International Conference on
Tools with Artificial Intelligence (ICTAI 2006), Washington D.C.,USA, November
13-15, 2006, 791-799.
5.
Narang, V., Sung, W.K., and Mittal, A. (2006). “Computational annotation of
transcription factor binding sites in D. melanogaster developmental genes.” Genome
Informatics, 17(2), 14-24.
6.
Narang, V., Sung, W.K., and Mittal, A. (2007). “Localized motif discovery in
metazoan regulatory sequences.” Under submission.
7.
Narang, V., Mittal, A., and Sung, W.K. (2008). “Probabilistic Graphical Modeling
of Cis-Regulatory Codes Governing Drosophila Development,” Under submission.