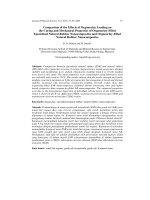
Processing and mechanical properties of pure mg and in situ aln reinforced mg 5al composite 4
Bạn đang xem bản rút gọn của tài liệu. Xem và tải ngay bản đầy đủ của tài liệu tại đây (2.68 MB, 39 trang )
Processing, physical and tensile properties
69
Chapter 4
Processing, physical and tensile properties
4.1 Introduction
Due to ease of fabrication at relatively low cost, conventional metal-matrix composites
reinforced with ceramic particulates are becoming the preferred choices of structural
materials. They exhibit high strength and elastic modulus, near-isotropic as well as
excellent high-temperature creep resistant properties. The failure mode, strength, and
ductility of composites vary with particulate size. Increase in particle size results in a
decrease in both tensile strength and ductility. During mechanical loading, large
ceramic particulates have high tendency to cracking that leads to premature failure and
low ductility of the composites. This can be avoided by using smaller ceramic
particulate size. Further enhancement in mechanical properties can be realized by
developing nanocomposites in which reinforcement particles and/or matrix grains are
in nanometer regime [1-7]. Severe plastic deformation and MA/MM processes can be
employed to refine the matrix grains [8,9].
MM is one of the most effective processes for dispersing ex-situ nanoparticles more
uniformly in metal matrix [5,6,10-14] and inducing in-situ nanoparticles in the
composites during milling. A better bonding between metal matrix and in-situ formed
nanoparticles which are clean, ultrafine and thermally stable renders the excellent
mechanical properties.
Inherent deficiencies such as low stiffness, high wear rate, and high chemical reactivity,
loss of mechanical strength at high temperature and creep resistance restrict the
Processing, physical and tensile properties
70
industrial applications of Mg and its alloys [15]. By adding micro and nanosized
ceramic particles in Mg matrix, these drawbacks can be overcome [3, 6]. In this study,
Mg nanocomposites with 1 wt% of in-situ AlN formed reinforcement were synthesized
for milling durations up to 40h and their physical and mechanical properties were
accessed. The contribution of texture developed during extrusion to tensile
deformation was examined by means of pole figure measurements. For comparative
study, pure Mg samples were also synthesized and tested using identical parameters
used for composite samples.
4.2 Experimental
Mg chips/turnings (Drehspaene) (Acros Organics) and Al powder (Alfa Aesar, -325
mesh) of 99.5% and 99% purity respectively were used as starting materials. AlN
composite powder was synthesized in-situ by MM of Al powder and pyrazine for 100h
as described in Chapter 3. The nominal composition of the composite is Mg-5wt%Al-
1wt%AlN (Mg-5Al-1AlN). 35g of composite mixture together with 0.5 to 3 wt% of
stearic acid, CH
3
(CH
2
)
16
COOH, and hardened carbon steel balls were loaded into 500
ml stainless steel vial in a 99.9% pure argon atmosphere in an AMBRUAN glove box.
The weight ratio of Mg chip to ball is 1:20. A Retsch PM400 Planetary Ball Mill was
employed for MM at 300 rpm. Each batch of powder was mechanically milled for
different durations of 0 (as-blended), 10, 20, 30 and 40 hours at room temperature. 0h-
MMed sample was obtained by blending the composite mixture at low rotational speed
of 100 rpm for 1h. Same milling conditions were applied to MM of pure Mg chips.
Mg-5Al-1AlN and pure Mg samples are designated hereafter as xxh-MMed composite
sample and xxh-MMed Mg sample respectively, where xx is milling hours while the
as-blended powder mixture or as-received Mg chips are indicated as 0h.
Processing, physical and tensile properties
71
After milling, a small quantity of powder was withdrawn for the examination of
structural changes by means of an X-ray diffractometer (XRD). The milled powders
were cold-compacted using 35mm diameter metal die at sixty tons of uniaxial
compaction pressure. The green compacts were sintered in a tubular furnace under
argon gas flow for 2 hours at 500ºC. The sintered billets were then hot-extruded at an
extrusion ratio of 25:1 to cylindrical rods of 7mm diameter.
The grain size of the as-received Mg chips and as-blended extruded specimens was
measured using optical microscope and the microstructure of as-milled specimens
were characterized using Jeol 2010F TEM. The extruded rods were machined into
cylindrical tensile specimens with a gauge diameter of 5mm and a gauge length of 25
mm according to ASTM E8M-96 standard. Uniaxial tensile test was conducted at
room temperature using an automated Instron 8501 servo hydraulic testing machine at
controlled strain rates of 3.33x10
-4
s
-1
. The deformation was monitored using a 25-mm
clip-on extensometer.
Resistivity measurement was carried out by Jandel Multi Height Four-Point Probe
Stand with Keithley K6200 DC current source and Keithley K2182 nanovoltmeter.
The bulk resistivity
was obtained from the equation:
I
V
s
2
(4.1)
where
s is the spacing of the probe in cm, I the test current in ampere and V the
measured voltage in volt.
Processing, physical and tensile properties
72
Setaram TMA 92-16.18 was employed to investigate the nature of thermal expansion
of the samples by means of coefficient of thermal expansion (CTE). Thermal behavior
of the bulk sample was further investigated by heating the samples in differential
scanning calorimeter DSC-2910 to 700°C at 10°C/min. To calculate the specific heat
capacity, thermal analysis was carried out using DSC from 323K to 453K at a constant
heating rate of 20 K/min in argon atmosphere. Specific heat capacity
C
p,sample
was
obtained from equation 4.2 [16].
sapphirep
referencesapphire
referencesample
sample
sapphire
samplep
C
y
y
m
m
C
,,
(4.2)
where
C
p,sample
and C
p,sapphire
, m
sample
and m
sapphire
are the specific heat capacities and
weights of measured sample and a sapphire standard sample. The effective
displacement of the sample
Δy
sample-reference
and the sapphire standard Δy
sapphire-reference
are the difference between the distances from the reference baseline in the thermal plot.
The standard specific heat capacity of sapphire was obtained from the thermodynamic
data [17] and is expressed as
)
4
635.474
(
)10742.0(6)10757.1(2)10087.12(2547.104
5.0
26263
,
T
TxTxTxC
sapphirep
(4.3)
4.3 Results and discussion
4.3.1 Mass structure investigation by XRD
X-ray diffractometer was employed to perform structural investigation on MMed
powders and extruded specimens in the transverse direction. XRD spectra of the
MMed composite powders and the extruded composite samples are shown in Figs.
4.1(a) and (b) respectively. In Fig. 4.1(a), all Al peaks from the as-blended specimen
Processing, physical and tensile properties
73
disappeared in the MMed powder due to solid solution of Al with Mg resulting in the
formation of Al
12
Mg
17
. A new phase of MgAl
2
O
4
was detected in the MMed powder
after 10 and 20h. During milling, MgO and Al
2
O
3
oxide layers on as-received Mg
chips and Al power surfaces fractured into very fine particles to favor solid state
reaction for the formation of MgAl
2
O
4
according to the following reaction [18].
3 Mg + 4 Al
2
O
3
3 MgAl
2
O
4
+ 2 Al
(4.4)
Very weak AlN peaks were observed in all MMed specimens suggesting the complete
immiscibility of AlN in Mg. With increasing milling duration, broadening of XRD
peaks and declining in peak intensity are observed due to the reduction in grain size
and introduction of microstrain during milling.
In Fig. 4.1(b), intensities of Mg (100) and (110) peaks for the extruded specimens
increase with milling duration, confirming the formation of deformation texture.
Texture occurs due to the deformation-induced crystallographic plane rotating
preferentially along the extrusion direction as a result of extrusion at high extrusion
ratio. Contamination from process control agent, stearic acid and powder handling
atmosphere can also be observed from the weak MgO (200) peak and MgH
2
(211)
peak, especially at milling durations of 20h and longer. Al
12
Mg
17
peaks disappeared in
all the as-milled specimens. It might be due to very fine in size and very minimal in
quantity to produce a visible diffraction peak. It is also highly possible that Al reacted
with the excess nitrogen molecules from AlN composite powder to form AlN. This
will be confirmed by thermal analysis of the composite samples by DSC in section
4.3.3. Weak MgAl
2
O
4
peaks emerged in all as-milled samples as a result of solid state
reaction during sintering between MgO and Al
2
O
3
, both of which are inherited from
the surfaces of the as-received Mg chips and Al powders.
Processing, physical and tensile properties
74
Intensity (a.u.)
30 8040 7050 60
2
(degree)
Mg
Al
12
Mg
17
AlN
MgAl
2
O
4
Al
0 h
10 h
20 h
30 h
(112)
(103)
(100)
(101)
(102)
(110)
(002)
40 h
(a)
Intensity (a.u.)
30 8040 7050 60
2
(degree)
MgO
Mg
Al
12
Mg
17
AlN
MgH
2
MgAl
2
O
4
0 h
10 h
20 h
30 h
(112)
(103)
(100)
(101)
(102)
(110)
(002)
40 h
(b)
Figure 4.1 X-ray diffraction patterns of Mg-5Al-1AlN composite samples at different
milling durations for (a) MMed powers and (b) MMed+extruded samples.
From X-ray diffraction patterns of pure Mg in Figs. 4.2 (a) and (b), no apparent
contamination from stearic acid or milling and handling atmosphere was observed in
as-milled powders and as-extruded samples. It might be due to negligible amount of
contamination or the particles of contamination by-products were too fine to produce
prominent diffraction peaks. The intensity of Mg (100) peak was exceptionally high in
the as-extruded specimens and that of basal plane (002) peak becomes lower with
milling duration. It implies that extrusion induced deformation textures exist in the
extruded samples.
Processing, physical and tensile properties
75
Intensity (a.u.)
30 8040 7050 60
2
(degree)
Mg
0 h
10 h
20 h
30 h
(112)
(103)
(100)
(101)
(102)
(110)
(002)
40 h
(a)
Intensity (a.u.)
30 8040 7050 60
2
(degree)
Mg
0 h
10 h
20 h
30 h
(112)
(103)
(100)
(101)
(102)
(110)
(002)
40 h
(b)
Figure 4.2 X-ray diffraction patterns of pure Mg samples at different milling durations
for (a) MMed powers and (b) MMed+extruded samples.
Fig. 4.3(a) shows the microstructure of the as-received Mg chips. In Fig. 4.3(b),
Al
12
Mg
17
decorated along the Mg matrix grain boundaries and AlN along the Mg chip
boundaries in the 0h-MMed extruded composite sample. Deformation due to cold
compaction and hot extrusion was not high enough to inject AlN particles into the
grain boundaries. From Fig. 4.3(c), no apparent grain elongation could be observed
along the extrusion direction. Fig. 4.3(d) shows the clean grain boundaries of pure Mg
samples.
Processing, physical and tensile properties
76
(a)
(b)
(c)
(d)
Figure 4.3 Optical micrograph of (a) as-received Mg chip, (b) 0h-MMed composite
sample in cross-sectional area, (c) 0h-MMed composite sample in longitudinal
direction and (d) 0h-MMed Mg sample in longitudinal direction.
At higher magnification, entangled dislocation pile-ups within the grain were observed
from TEM image as shown in Fig. 4.4 (a). During milling, mechanically cold-worked
powders resulted in generation of dislocations, multiplication and congealing that
produced nanosized grains [19]. The grains were highly strained and contained
numerous defects. When the grain is extremely small, the formation of new
nanocrystals via dislocation movement stops because of inability of individual grain to
support more than one dislocation [20]. As such, some limited dislocations (Figs. 4.4
(b) and (c)) can be observed in the 10h- and 20h-MMed composite samples which are
in larger grain size regime. However, for 30h- and 40h-MMed composite samples, no
30 m
15
m
100
m
15
m
Processing, physical and tensile properties
77
(a)
(b)
(c)
(d)
(e)
(f)
Figure 4.4 TEM images of (a) 0h-, (b) 10h-, (c) 20h-, (d) 30h-, (e) 40h-MMed
composite sample and (e) AlN reinforcement (marked with dotted line) in 30h-MMed
composite sample.
d
100
=2.75Å
Processing, physical and tensile properties
78
indication of the presence of dislocation can be observed in Figs. 4.4 (d) and (e).
Fig.4.4 (f) shows a HRTEM image of lattice pattern from 30h-MMed composite
sample. It reveals that the particle is AlN polycrystal with an inter-planer spacing of
2.75 Å corresponding to the (100) plane of AlN crystal. 40h-MMed composite showed
the smallest grain size of 33 nm compared to the coarse and ultrafine grain-sized
samples. In Fig. 4.5, HRTEM investigation reveals the estimated thickness of grain
boundary was about 1 nm and it appears to be free of contamination or particles with
disordered phases.
Figure 4.5 HRTEM observation of grain boundary marked with dotted line.
As shown in Table 4.1, after 10h of milling, grain size of the MMed powders was
significantly reduced from 24
m to 44 and 41 nm in the composite sample and pure
Mg sample respectively. However, longer milling did not produce further grain
refinement. The crystalline sizes are respectively 32, 26 and 22 nm after 20, 30 and
40h-MM in composite sample. In pure Mg samples, average crystalline sizes after 20,
30 and 40h-MM are 31, 28 and 25 nm respectively.
Grain
boundary
Processing, physical and tensile properties
79
Table 4.1 Grain sizes (in nm) of powders (P) and extruded samples (E) after different
milling durations
Composition 0h 10h 20h 30h 40h
Mg-5Al-1AlN (P) 24
*
44 32 26 22
Mg-5Al-1AlN (E) 17
*
116 86 42 33
Mg (P) 24
*
41 31 28 25
Mg (E) 25
*
183 158 127 144
*
m
Shear deformation during hot extrusion caused grain refinement in the as-blended or
0h-MMed extruded composite sample, reducing the initial grain size from 24
m to 17
m. However, insignificant grain growth is observed in 0h-MMed extruded pure Mg,
increasing the initial grain size from 24
m to 25 m as shown in Table 4.1. The
average grain sizes of the as-milled extruded pure Mg samples in Table 4.1 were
estimated using the Scherrer’s formula (equation 4.5) based on the theory of
broadening of XRD diffraction peaks.
cos
05.1
d
B
s
(4.5)
where B
s
is the broadening due to reduction in crystallite size,
the wavelength of X-
ray, d the crystallite size and
the diffraction angle.
Grain sizes of the extruded composite samples were estimated from 50 grains from
TEM images taken at different locations and different samples. The Scion Image
software was employed to calculate the grain size. Grain size distribution of the as-
milled composite samples is illustrated by the histograms in Fig. 4.6. Average grain
sizes were estimated to be 116, 86, 42 and 33 nm for the 10, 20, 30 and 40h-MMed
composite samples respectively. Narrower grain size distribution between 20 to 70 nm
was observed after 40h-MM.
Processing, physical and tensile properties
80
10h
Average = 116 nm
Grain size (nm)
Nunmer fraction
0.0
0.6
0.3
0.4
0.5
0.1
0.2
0 100 150 20050
(a)
Grain size (nm)
Nunmer fraction
0.0
0.6
0.3
0.4
0.5
0.1
0.2
0 100 150 20050
20h
Average = 86 nm
(b)
Grain size (nm)
Nunmer fraction
0.0
0.6
0.3
0.4
0.5
0.1
0.2
0 100 150 20050
30h
Average = 42 nm
(c)
Grain size (nm)
Nunmer fraction
0.0
0.6
0.3
0.4
0.5
0.1
0.2
0 100 150 20050
40h
Average = 33 nm
(d)
Figure 4.6 Grain size distributions of MMed composite samples after (a) 10h, (b) 20h,
(c) 30h and (d) 40h milling.
Crystallite sizes of the as-milled extruded composite and pure Mg samples were in the
range of 116-33 nm and 183-127 nm respectively. It is clear that retardation of grain
growth was effective in composite specimens by second phase particles such as AlN
and in-situ formed Al
12
Mg
17
, MgH
2
, MgAl
2
O
4
, and MgO during sintering and
extrusion. Such stable grain structure with no grain growth up to 550°C has been
reported in commercially pure Mg with mean particle diameter of 20
m reinforced
with 1 vol % of nanoscaled alumina particles (the mean diameter 12 nm) [21, 22].
4.3.2 Electrical resistivity
The electrical resistivity (
) of nc materials with increased volume fraction of atoms at
the grain boundary is expected to be higher than both coarse grained polycrystalline
Processing, physical and tensile properties
81
metals and amorphous alloys. At a constant temperature,
increases with decreasing
grain size. The magnitude of electrical resistivity in composite can be tailored by
changing the volume fraction of electrically conducting component. The total
resistivity of a crystalline metallic specimen is the sum of the resistivity due to thermal
agitation of the metal ions of the lattice and the resistivity due to the presence of
imperfections in the crystal. The resistivity of a metal results from the scattering of
conduction electrons. Lattice vibrations scatter electrons because the vibrations distort
the crystal. Imperfections such as impurity atoms, interstitials, dislocations and grain
boundaries scatter conduction electrons because the electrostatic potential in their
immediate vicinity differs from that of the perfect crystal.
Table 4.2 Electrical resistivity of composite (
c
) and pure Mg samples (
Mg
) milled
for different milling durations
Mi1lling duration 0h 10h 20h 30h 40h
c
(-cm)
78.3 102.9 108.4 83.7 67.8
Mg
(-cm)
27.8 28.8 37.3 44.6 52.0
From Table 4.2 and Fig. 4.7, both composite and pure Mg samples exhibited much
higher resistivity compared to theoretical resistivity of 4.108
-cm for pure Mg [23,
24]. High electrical resistivity could be produced from strong electronic scattering on
vacancies, solutes, dislocations and interfaces [27, 28].
of pure Mg increased almost
linearly with milling time (decreasing grain size accompanied with increasing grain
boundary volume). On the other hand, the composite samples exhibited higher
resistivity due the additional second phase particles with very high electrical resistivity
(AlN: 10
13
-cm [25], MgO: 1.5x10
2
-cm, MgAl
2
O
4
: 1.7x10
2
-cm at 1500°C [26])
besides processing flaw and structural imperfection.
of composite samples increased
up to 20h-MM followed by a decrease after 30 and 40h of MM. This might indicate
Processing, physical and tensile properties
82
the lesser processing flaws such as porosity, internal cracks, etc. and the diminishing
dislocation activities in 30 and 40h-MMed samples with higher degree of grain
refinement as evident in Fig 4.4 (d) and (e). It is noteworthy that the difference in
electrical resistivity between composite and pure Mg becomes lesser with increasing
milling time exhibiting 182, 257, 191, 88 and 25% higher in composite samples after 0,
10, 20, 30 and 40h-MM respectively.
´
(
-cm)
MgMg-5Al-1AlN
Milling duration (h)
04010 3020
4.0x10
-5
1.0x10
-4
6.0x10
-5
0
8.0x10
-5
2.0x10
-5
1.2x10
-4
Figure 4.7 Electrical resistivity of Mg-5Al-1AlN composite sample and pure Mg
samples.
4.3.3 Thermal properties
From Table 4.3 and Fig. 4.8, the same trend of α
c
and α
Mg
is observed for both
composite and pure Mg samples. Milling increases the α value with grain refinement
accompanying the increasing grain boundary volume after 10h-MM. As the CTE of
grain boundary is larger than that of crystalline state (2.5 – 5 times larger) [29], more
grain (or phase) boundaries in the samples with higher milling durations would
increase the thermal expansion. The greatly enhanced thermal expansion coefficient,
on the other hand, reveals the ultrafine structures in the sample.
Processing, physical and tensile properties
83
Table 4.3 Coefficient of thermal expansion (CTE) of composite (α
c
) and pure Mg
samples (α
Mg
) milled for different milling durations
Mi1lling duration 0h 10h 20h 30h 40h
α
c
(µm/°C) 28.92 30.08 29.75 30.32 28.42
α
Mg
(µm/°C) 30.42 30.90 29.80 31.23 28.23
m /
o
C
MgMg-5Al-1AlN
Milling duration (h)
04010 3020
28
34
30
24
32
26
Figure 4.8 Coefficient of thermal expansion (CTE) of composite (α
c
) and pure Mg
samples (α
Mg
) milled for different milling durations.
It is interesting to note that except for the 20h-MMed sample, α increased up to 30h
MM followed by a drop in 40h-MMed samples in both material systems. The
homogeneous distribution of reinforcement particles and in-situ formed second phase
particles hinder the lattice expansion and grain growth, and consequently reduce the
thermal expansion of the composite samples compared to those of pure Mg samples.
Thermal behavior of the bulk sample was further investigated by heating the samples
in DSC to 700°C at 10°C/min. DSC traces of the composite and pure Mg samples
MMed for different milling durations are as shown in Fig. 4.9. A sharp endothermic
peak appears corresponding to melting which is taken as the onset temperature of the
peak. It is clear that the longer the milling hours, the higher is the melting temperature
Processing, physical and tensile properties
84
(T
m
) of the composite samples. The positions of the endothermic peaks are respectively
shifted from 586°C for as-blended sample to 622, 625, 645 and 647°C for the 10, 20,
30 and 40h-MMed samples as shown in Fig. 4.9 (a). This could be due to the variation
of solid solution of Al in Mg matrix with milling duration. From Mg-Al phase diagram,
the amount of solid solution of Al in Mg during milling is calculated using the melting
temperature at various milling durations. It is estimated that 2, 1.8, 0.2 and 0 wt% of
Al formed solid solution with Mg after 10, 20, 30 and 40h of milling respectively. It
can be observed that Al formed lesser solid solution with milling time leading to the
melting temperature to shift higher and ultimately close to the melting temperature of
pure Mg for 40h-MMed composite sample.
Temperature
(°C)
0
500
100
400
200
300
700
600
Heat flow (Endo down)
0h
10h
20h
30h
40h
647°C
645°C
625°C
622°C
586°C
Temperature
(°C)
0
500
100
400
200
300
700
600
Heat flow (Endo down)
0h
10h
20h
30h
40h
646°C
645°C
645°C
646°C
646°C
(a) (b)
Figure 4.9 DSC traces of (a) composite samples and (b) pure Mg samples at different
milling durations.
Although weak Mg
17
Al
12
peaks are detected in XRD patterns of 0h-MMEd sample, it
is noted that the melting of Mg
17
Al
12
is not detected from the thermal traces. It might
be due to too little Mg
17
Al
12
present to produce an endothermic peak in the DSC traces.
It is also highly possible that the reaction between Al and excess nitrogen atoms from
AlN composite powder forms AlN instead of producing Mg
17
Al
12
. The heat released
from the endothermic reaction of AlN formation might enhance the matrix melting and
Processing, physical and tensile properties
85
thus lowering the overall melting temperature by few degrees. The melting
temperatures of MMed samples increase near to T
m
of Mg matrix (650°C) after 40h of
milling indicating no apparent influence of second phases and reinforcement on
melting with longer milling duration. It is interesting to note that milling has no
influence on the melting of pure Mg samples exhibiting similar melting temperature of
645-646°C in all samples as shown in Fig. 4.9 (b).
C
p
(J/K.g)
T (K)
340
460
360 440400 420
380
0.60
0.50
0.40
0.30
0.20
0h
40h30h
10h 20h
C
p
(J/g.K)
T (K)
340
460
360 440400 420
380
0.60
0.50
0.40
0.30
0.20
0h
40h30h
10h 20h
(a) (b)
Figure 4.10 C
p
values of (a) composite and (b) pure Mg samples for different milling
durations.
It can be seen from Fig. 4.10 that the increase in C
p
of nanocrystalline samples with
temperature is approximately linear as reported by Lu et al. [16]. In absolute value of
C
p
, composite samples show highest value in the 40h-MMed sample followed by 0, 30,
10 and 20h-MMed samples as shown in Fig. 4.10(b). It can be observed from Fig.
4.10(b) that pure Mg samples show insignificant change in C
p
values although the 20h-
MMed sample exhibits slightly higher C
p
. Generally, C
p
values of composite samples
are higher than those of pure Mg samples.
Specific heat of a material is closely related to its vibrational and configurational
entropy, which is affected significantly by the nearest neighbor configurations, e.g.
interatomic potentials. The enhancement of C
p
in nanocrystalline materials might be
Processing, physical and tensile properties
86
attributed to the complicated structures of grain and/or phase boundaries. The nature of
the property difference needs further theoretical and experimental studies. Based on
statistical mechanics and quantum theory [30], C
p
can be expressed as:
3
4
5
12
D
Ap
h
kT
kNC
(4.6)
where N
A
is Avogadro number, k Boltzmann’s constant, T the absolute temperature, h
Planck’s constant and
D
Debye frequency (maximum allowable phonon frequency).
The specific heat capacity is mainly dependent on the maximum phonon frequency
D
as shown in equation 4.6. After initial milling of 10 and 20h, grain refinement with
larger volume fraction of disordered grain boundaries resulted in high vibrational
densities and higher Debye phonon frequency
D
, which consequently leads to the
decreasing trend of C
p
for these milling durations. However, a reversed trend is
observed for longer milling durations. It can be associated with an increase in the
configurational and vibrational entropy with longer milling time due to higher
interfacial disorder and lattice defects such as dislocations, grain boundaries, vacancies
and impurities. Lu et al. [16] verified experimentally that grain boundaries and lattice
defects are mainly responsible for the increase in specific heat.
The activation enthalpy ΔH and activation entropy ΔS can be estimated from the C
p
data using the following relationship,
2
1
T
T
p
dTCH ,
2
1
T
T
p
dT
T
C
S
(4.7)
Processing, physical and tensile properties
87
H (J/g)
MgMg-5Al-1AlN
Milling duration (h)
04010 3020
25
50
40
30
20
45
35
S (J/g.K)
Milling duration (h)
04010 3020
0.05
0.10
0.09
0.08
0.07
0.06
0.13
0.12
0.11
MgMg-5Al-1AlN
(a) (b)
Figure 4.11 (a) ΔH and (b) ΔS of composite samples and pure Mg samples estimated
from the data of specific heat capacity.
It can be seen from Fig. 4.11 that both
ΔH and ΔS of composite samples are higher
than those of pure Mg samples. The AlN reinforcement particles and second phase
particles might hinder the lattice vibration and this causes the higher
ΔH and ΔS for the
composite samples. For composite samples both
ΔH and ΔS values decrease with
milling duration up to 20h and significantly increase after 30 and 40h-MM. Different
trend is observed for the pure Mg samples. As milling increases, both
ΔH and ΔS
increases until 10h-MM. However, further milling decreases those values until 30h-
MM and slight increases in 40h-MMed samples. It is noted that except for the 10h-
MMed samples, other MMed samples show lower values of
ΔH and ΔS compared to
those of as-blended specimens.
Decrease in
ΔH with prolonged milling duration implies that the value of activation
energy barrier
Q in the grain boundary diffusivity in 30 and 40h-MMed samples is
lower compared to rest of the samples. Due to low activation energy barrier, there will
be higher possibility for an applied stress to overcome the barrier to trigger the grain
boundary diffusion at room temperature.
Processing, physical and tensile properties
88
In the composite sample, the additional reinforcement particles may restrict the motion
of grain boundary dislocation and thus increases the activation enthalpy
ΔH and
activation entropy
ΔS compared to unreinforced pure Mg samples.
This effect is more
pronounced in 30h and 40h-MMed samples where the particle distribution is more
homogeneous with longer milling durations. This indicates higher value of
Q in the
grain boundary diffusivity in 30h and 40h-MMed composite samples.
4.3.4 Mechanical properties
True strain
True stress (MPa)
0
200
100
500
400
300
700
600
00.30.1 0.2 0.4 0.5
Strain rate: 3.33x10
-4
s
-1
0h
20h
30h
10h
40h
(a)
True strain
True stress (MPa)
0
200
100
500
400
300
700
600
00.30.1 0.2 0.4 0.5
Strain rate: 3.33x10
-4
s
-1
0h
10h
20h
30h
40h
(b)
Figure 4.12 True stress-true strain curves of (a) Mg-5Al-1AlN composite and (b) pure
Mg samples at 3.33x10
-4
s
-1
strain rate.
Mechanical response in terms of true stress-true stain curve is shown in Fig. 4.12 and
detailed tensile results are tabulated in Table 4.4. From Fig. 4.12 (a), pronounced work
hardening behavior until fracture can be observed in the 0h-MMed composite samples
implying the increased resistance to dislocation motion. Very different stress-strain
behaviors can be seen in the as-milled specimens compared to the as-blended
specimens. After initial milling of 10h and 20h, a sharp increase in yield strength (YS)
was observed from 219 MPa at 0h-MM to 465 MPa and 505 MPa which translates into
112% and 131% increase respectively. However, ductility drops from 12% to 5% and
Processing, physical and tensile properties
89
9% after 10h and 20h-MM. Further milling to 30h and 40h interestingly shows lower
YS of 334 MPa and 205 MPa with enhanced ductility of 28% and 34% respectively.
Table 4.4 Yield strength and % elongation of
Mg-5Al-1AlN and Mg samples for
different milling durations at 3.33x10
-4
s
-1
strain rate
Mg-5Al-1AlN
Pure Mg
Milling
duration (h)
YS
(MPa)
Elongation
(%)
YS
(MPa)
Elongation
(%)
0 219 12 122 10
10 465 5 311 8
20 505 9 256 10
30 334 28 216 18
40 205 34 210 33
Strain hardening behavior can still be observed in 10h-MMed specimens showing the
dislocation activities were still going on during deformation. However, it is noted that
longer milling (20h and above) diminishes the work hardening and promotes slight
softening behavior. A clear transition from hardening behavior to softening behavior
with decreasing grain sizes (only softening in some cases) appears to be related to an
increase in GBS with decreasing grain size as evidenced by stress-strain [31] and creep
[32] measurements, although direct metallographic observation of GBS is still lacking
in these materials.
Similar mechanical response is observed in pure Mg samples compared to the
composite samples with the exception of overall decrease in YS for each milling
duration. However, YS of pure Mg sample is slightly higher than that of composite
sample after 40h-MM. Compared to YS of 122 MPa for 0h-MMed sample, initial
milling of 10 and 20 MM produced 311 MPa and 156 MPa respectively showing
significant increase of 155% and 110% in YS with no apparent reduction in ductility.
Different from the composite sample, the pure 10h-MMed pure Mg sample shows
Processing, physical and tensile properties
90
neither hardening nor softening behavior. Further milling leads to slight decrease in
YS but enhanced ductility up to 33% with strain softening in the 40h-MMed sample.
In both material systems, the highest ductility is achieved after the longest milling
duration of 40h. The YS of the 40h-MMed composite sample is slightly lower than
that of the 0h-MMed sample whereas 40h-MMed pure Mg sample is still 72% higher
compared to the as-blended sample. It is observed that strengthening from grain
refinement after 10h-MM is more pronounced for pure Mg indicating grain refinement
strengthening mechanism dominates in the initial milling of 10h and 20h in the
composite samples.
The presence of AlN particles induces an inhomogeneous deformation pattern and a
high dislocation density in the composite matrix, thus leading to higher YS in the
composite matrix compared to the unreinforced pure Mg samples. During tensile test, a
lot of geometrically necessary dislocations (GND) must be stored near the surfaces of
particles to accommodate the deformation. The GND density for elastic modulus (EM)
mismatch
EM
G
and coefficient of thermal expansion (CTE) mismatch
CTE
G
are given
as [33],
p
p
EM
G
bd
f6
(4.8)
and
p
p
CTE
G
bd
TCf
.12
(4.9)
where f
p
is the volume fraction of particles, b the Burgers vector, d
p
the diameter of the
particle,
the uniform deformation of the matrix material subjected to a uniform
compression loading, C the CTE difference between the matrix and the particle, and
Processing, physical and tensile properties
91
T the temperature change. It can be seen from equations 4.8 and 4.9 that the GND
density to accommodate EM mismatch and CTE mismatch for small particle is higher
than that for larger particle. Therefore, after initial milling of 10 and 20 hours, grain
refinement induced higher GND density generated in the Mg matrix around the
reinforcements due to the difference in coefficients of thermal expansion between the
Mg matrix and AlN. This contributes to increase in YS after 10h and 20h milling. The
GND density due to EM mismatch [34] can also be expressed as:
b
m
EM
G
4
(4.10)
where γ
m
is the shear strain in the matrix, and λ the local length scale of the
deformation field, which can be interpreted as the distance whereby dislocations
generated at the reinforcements are restrained from movement. λ is affected by fine
matrix grain size as well as reinforcement spacing [35].
According to Dai et al. [33], the yield stress of a reinforced matrix is given by the
following equation:
momy
(4.11)
where σ
my
and σ
m0
are the yield stresses of the reinforced and the unreinforced matrix
respectively. The total increment in yield stress of the reinforced matrix represented by
σ can be estimated by [36]
22
)()(
CTEEM
(4.12)
where σ
EM
and σ
CTE
are respectively the stress increment due to elastic modulus and
the coefficient of thermal expansion mismatch between the matrix and the AlN
Processing, physical and tensile properties
92
reinforcement. Based on Taylor dislocation strengthening mechanism, σ
EM
and σ
CTE
can be determined as:
EM
GmEM
b
3
(4.13)
and
CTE
GmCTE
b
3
(4.14)
where α
and β are the strengthening coefficients, μ
m
is the shear modulus of the matrix
and b the Burgers vector.
4.3.5 Effects of texture on mechanical properties
The main deformation mode in magnesium and magnesium alloys is basal slip, i.e. slip
on the (0001) plane with a
0211 Burgers vector. Prismatic slip }0110{ 0211 and
pyramidal slip
}1110{ 0211 have also been observed, but their critical resolved
shear stress at room temperature is very much higher than that for basal slip [37]. The
deformation texture in hcp metals and their alloys will develop in accordance with the
relative contributions from the above deformation paths as well as twinning slip
}2110{ 0110 .
Mukai et al. [38] has reported that two AZ31 extruded samples with almost the same
grain size (~15µm) showed different tensile properties owing to the difference in
texture. The sample with larger fraction of basal planes along the extrusion direction
(tensile axis) produced higher YS and lower ductility. The (0002) pole figures of
composite and pure Mg extruded samples with their reflecting surface normal to the
extrusion direction shown in Figs. 4.13 and 4.14 displayed the typical basal fiber
Processing, physical and tensile properties
93
(a)
(b)
(c)
(d)
(e)
Figure 4.13 (0002) texture of as-extruded (a) 0h-, (b) 10h-, (c) 20h-, (d) 30h- and (e)
40h-MMed Mg-5Al-1AlN composite samples.