Mechanisms of polymer ca2+ interaction and their effects on the characteristics of alginate microspheres and films 1
Bạn đang xem bản rút gọn của tài liệu. Xem và tải ngay bản đầy đủ của tài liệu tại đây (280.49 KB, 20 trang )
78
IV. Results and Discussion
Part I. Influence of viscosity and uronic acid composition on the properties of
alginate films and microspheres produced by emulsification.
A. Film study
Calcium alginate films were produced by a solvent evaporation technique
using 5 different grades of sodium alginate (Table 6). The films were used to assess
the influence of alginate composition on the tensile properties of alginate microsphere
matrix. At least 0.15 M CaCl
2
was required to produce smooth films of sufficient
strength which could be handled without any breakage. Lower CaCl
2
concentrations
gave rise to small protuberances in LH and FL films. In addition, there was little
change in film weight (<10%) before and after cross-linking, indicating negligible
alginate loss by dissolution (Table 8). Preliminary studies using higher G (LH) and
lower G (MP) alginates produced only slight difference in the tensile strength of MP
and LH films despite using different concentrations of CaCl
2
solutions (0.15, 0.3 and
0.5 M) for cross-linking. The extent of cross-linking between polymer chains
determined the level of mechanical strength of the matrix. Clearly, there was a
stoichiometric maximal number of cross-links that can be formed in the films and
once reached, any further increase in cross-linker concentration did not produce any
significant change to the films’ tensile strength. Therefore, 0.15M of CaCl
2
solution
was deemed as adequate for cross-linking the sodium alginate films. In addition, ionic
interaction was rapid, thus immersion of sodium alginate films in the CaCl
2
solutions
for an hour was sufficient to produce well cross-linked films (Al-Musa et al., 1999).
79
Table 8. Viscosity of alginate solutions, calcium ion content of cross-linked alginate film and change in film weight before and after
cross-linking.
Alginate
code
Viscosity of
2 % w/w alginate
solution (mPa.s)
Calcium ion content
of cross-linked films
(mg)
Film weight (g)
Before
cross-linking
After
cross-linking
% Change
LH
56.4 ± 0.83
89.00 ± 0.52 0.47 ± 0.062 0.49 ± 0.070 4.69
MP
86.7 ± 0.48
93.28 ± 0.58 0.51 ± 0.007 0.56 ± 0.007 8.62
NI
308.5 ± 0.40
83.82 ± 1.27 0.47 ± 0.002 0.49 ± 0.013 3.57
FL
310.5 ± 1.75
90.64 ± 0.07 0.45 ± 0.002 0.48 ± 0.002 6.91
MA
389.8 ± 1.71
84.27 ± 0.40
0.47 ± 0.005 0.49 ± 0.002 5.06
79
80
Other studies had compared the tensile properties of calcium alginate
produced from different types of sodium alginate (Smidsrød, 1974; Martinsen et al.,
1989). However, most of the conclusions drawn from these studies did not take into
account the tensile properties of the different sodium alginate matrices and
comparison was based only on the values obtained from the tensile tests of the
different calcium alginate matrices. The % change in tensile properties before and
after cross-linking would give a more accurate picture of the influence of cross-
linking for each type of sodium alginate used. In this study, the tensile strength and
the elastic modulus of the alginate matrix increased after cross-linking, indicating that
cross-linking increased the mechanical strength and stiffness of the matrix (Table 9).
Ca
2+
was reported to have a greater affinity for G blocks than M and MG blocks,
forming “egg-box” junctions with the G blocks, thereby pulling the polymer chains
closer together (Kohn et al., 1968; Smidsrød, 1974; Kawarada et al., 1990). Higher G
alginates were also found to have polymer chains which were less flexible than higher
M alginates (Whittington, 1971). Similar trends were observed in this study where
sodium alginate films with a higher proportion of M and MG blocks were able to be
stretched to a greater extent before breakage (Tables 6 and 9). Cross-linked films of
higher G content, such as LH and FL films, also generally contained more Ca
2+
.
However, these films exhibited a low % change in tensile strength and elastic
modulus (Table 9 and Figure 7). Combining these observations, it could be inferred
that the G blocks were arranged in a more rigid manner that restricted the movement
of the polymer chains. On the contrary, the polymer chains composed of a higher
proportion of M and MG blocks were more flexible and exhibited a higher degree of
mobility during cross-linking. This permitted the alignment of the chains to form a
stronger cross-linked matrix, as indicated by the
81
Table 9. Tensile properties of alginate films.
Alginate
code
Tensile strength (N/mm
2
) Elastic Modulus (N/mm
2
) Elongation at break (%)
Before
cross-
linking
After
cross-
linking
% Change Before
cross-
linking
After
cross-
linking
% Change Before
cross-linking
After
cross-
linking
%
difference
LH 81.73
± 2.58
92.43
± 1.89
+13.09 2337.26
± 72.52
3236.16
± 113.36
+38.46 18.64
± 1.10
10.15
± 1.16
-8.49
MP 87.91
± 2.48
102.08
± 2.50
+16.12 2302.57
± 74.10
3346.87
± 98.26
+45.35 25.18
± 1.48
8.44
± 0.36
-16.74
NI 57.50
± 1.91
100.69
± 2.69
+75.11 1955.71
± 56.47
3409.17
± 86.02
+74.32 19.68
± 1.53
11.68
± 0.77
-8.00
FL 55.27
± 1.90
90.91
± 0.85
+64.48 2175.76
± 43.68
2952.56
± 71.65
+35.70 14.92
± 0.93
10.88
±0.74
-4.04
MA 64.76
± 1.57
96.57
± 2.76
+49.12 2132.03
± 57.75
3217.04
± 132.27
+50.89 17.81
± 0.56
11.80
± 0.81
-6.01
81
82
0
10
20
30
40
50
60
70
80
90
82 84 86 88 90 92 94 96
Ca
2+
content of alginate films (mg)
% change in tensile properties after cross-linking
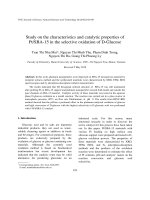
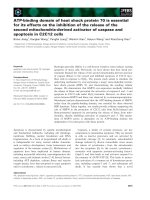
Figure 7. Influence of Ca
2+
content of cross-linked alginate films on tensile strength
and elastic modulus.
Tensile strength
Elastic modulus
83
greater % change in tensile properties. The tensile properties of the matrix were
affected by the extent of cross-linking, as well as the flexibility and mobility of the
polymer chains. The latter played a greater role as higher G alginates showed a
smaller % change in the tensile properties despite greater cross-linkage with Ca
2+
.
Cross-linking decreased the % elongation at break but increased the tensile strength of
the matrix to a greater extent than the elastic modulus (Figure 7).
The relationship between intrinisic viscosity [η] and molecular weight was
given by the Mark-Houwink equation. The equation was expressed as:
[η] = KM
V
a
(7)
where K and a are constants for a particular polymer-solvent pair at a particular
emperature and M
V
is the viscosity-average molecular weight of the polymer.Thus,
from Equation 7, it can seen that the viscosity has a direct relationship with molecular
weight.
In this part of the study, the influence of molecular size of the polymer was
also studied. The relative solution viscosity of the different types of sodium alginate
was used to indicate their relative molecular size (Lemoine et al., 1998). LH and FL
have similar M/G ratios but significantly different molecular weights. This was also
observed between MP and NI. Comparing the tensile strength of LH and FL films as
well as between MP and NI films, the molecular weight of the alginate polymer was
found to have an influence on the tensile properties of the alginate matrix (Tables 6
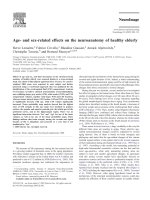
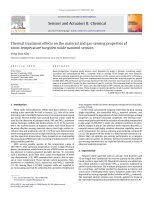
and 9). The molecular weight of sodium alginate appeared to have a greater effect on
the tensile strength than the elastic modulus of the resultant cross-linked matrix
(Figure 8). The higher the molecular weight, the greater was the % increase in tensile
strength after cross-linking.
84
Figure 8. Percentage change in tensile properties of films after cross-linking with
viscosity of sodium alginate solution used.
0
10
20
30
40
50
60
70
80
0 100 200 300 400 500
Viscosity of sodium alginate solution (mPa.s)
% change in tensile properties after cross-linking
Tensile strength Elastic modulus
85
Generally, cross-linking of a larger molecule also significantly increased the
stiffness of the matrix as indicated by the greater % change in elastic modulus
between MP and NI after cross-linking (Tables 8 and 9). Although the effect of
molecular weight on elastic modulus was less obvious between LH and FL, the
smaller % difference in elongation at break before and after cross-linking in lower
molecular weight alginates revealed the formation of a more flexible alginate matrix
with alginates having a lower molecular weight (Tables 8 and 9). The tensile
properties of the alginate microsphere matrix could be inferred from the results
obtained from these film studies. Hence microspheres produced from sodium alginate
of higher molecular weights would form a stronger and stiffer matrix.
B. Microsphere study
Microspheres were produced from the 5 different types of sodium alginate by
an emulsification technique (Refer to Introduction, Section B). The microspheres
obtained showed a wide size distribution which is typical of an emulsification method
(Figure 9). The mean size of discrete microspheres was found to increase with
increasing alginate viscosity only up to 300 mPas with LH microspheres having a
smaller mean size than MP microspheres (Tables 8 and 10). The alginate solution was
dispersed as small globules in the continuous phase. As the viscosity of alginate
solution increased, the efficiency of dispersion decreased, resulting in greater
aggregation of the globules and resultant microspheres. It should be recalled that the
microspheres produced were sieved to remove the very large aggregates. Hence,
lower yields of microspheres from alginates of higher viscosity demonstrated that
aggregation of microspheres was more pronounced for higher viscosity alginates.
There was little agglomeration (<10 %) observed in LH and MP microspheres
86
0
10
20
30
40
50
60
70
80
< 32 µm 32-52 µm 53-75 µm 76-100 µm 101-125 µm > 125 µm
Size range of alginate microspheres
% microspheres
LH MP NI FL MA
Figure 9. Size distribution of microspheres produced by emulsification.
87
Table 10. Properties of alginate microspheres.
Alginate
code
Properties of alginate microspheres
Yield of
blank
microspheres
(g)
Ca
2+
content of
blank
microspheres
(mg)
Mean size of
drug-containing
microspheres
(µm)
Degree of
agglomeration
(%)
Drug
content
(%)
Drug content
of S
microspheres*
(%)
LH
1.37 ± 0.04 66.46 ± 1.07 37.67 ± 0.54
7.60 24.17
± 0.21
25.22 ± 0.14
MP
1.27 ± 0.05 77.61 ± 0.48 41.03 ± 0.83
9.62 23.79
± 0.04
23.29 ± 0.05
NI
0.70 ± 0.07 88.83 ± 3.76 28.54 ± 0.70
9.00 27.94
± 0.10
29.28 ± 0.14
FL
0.63 ± 0.01 88.35 ± 1.04 30.38 ± 0.70
13.35 27.49
± 0.09
27.12 ± 0.10
MA
0.69 ± 0.02 89.36 ± 0.46 32.24 ± 0.81
11.91 28.93
± 0.20
29.46 ± 0.14
*Sieved microspheres in the size range of 54-75 µm.
87
88
although MP microspheres showed a higher degree of agglomeration as compared to
LH microspheres (Table 10). The mean sizes of the aggregates for LH and MP
microspheres were 49.1 µm and 54.1 µm respectively indicating that alginates of
higher viscosities tended to produce larger agglomerates. Beyond viscosities of 300
mPas (NI, FL, MA), the mean sizes of discrete microspheres were smaller than those
produced from alginates of lower viscosity. The mean size of these discrete
microspheres also showed a trend of increased size with increasing alginate viscosity.
The yields of these high viscosity alginate grades were also lower, indicating
significant aggregation of microspheres. As the mean size was obtained from discrete
microspheres, a smaller mean size also indicated that a larger proportion of the large
microspheres had agglommerated. In fact, it was also observed that microspheres
produced from alginates of higher viscosities aggregated to a greater extent (Tables 8
and 10). The mean agglomerate size for MA was found to be 78.17 µm and
significantly larger than agglomerates produced from other types of alginate (p<0.05).
The results for the low, as well as high viscosity grades of alginates indicated that
viscosity had its effect on the mean size of microspheres produced by the
emulsification process.
In comparison with films, the microspheres showed a different trend in cross-
linking. Despite having lower M/G ratios, LH and FL microspheres were cross-linked
to a lower extent as indicated by their relatively low Ca
2+
content (Tables 6 and 8). On
the other hand, a fairly linear relationship (r
2
=0.86) was observed between the
viscosity of sodium alginate and the Ca
2+
content, indicating a strong influence of the
polymer viscosity on the extent of cross-linking in the microspheres. In film
formation, the sodium alginate was in direct contact with the cross-linking solution
while in microsphere formation, the interaction between dispersed globules of sodium
89
alginate and cross-linking agent was dependent on the random collision between the
globules (Heng et al., 2003). Alginates with higher viscosities formed larger, heavier
and more sluggish globules when dispersed in an immiscible medium, presenting a
greater opportunity for collision and cross-linking with the small globules of the
calcium chloride solution. From the results obtained, it can be seen that the properties
of the alginate matrix are affected by the method of production to a certain extent.
However, the film matrix could still be used as a guide to illustrate certain trends in
the properties of the alginate matrix.
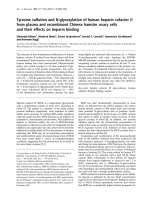
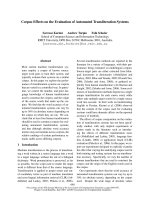
Microscopic examination showed that the microspheres were filled with drug
particles (Figure 10). The drug content of the microspheres increased in the following
order: MA>NI, FL>LH, MP (Table 10). There was no significant difference (p>0.05)
in drug content between LH and MP microspheres despite their difference in mean
size and extent of cross-linking. The same trend was observed between NI and FL
microspheres with respect to mean size. MA, FL and NI had viscosities in the range
of 308-390 mPa.s and produced comparable extent of microsphere aggregation. The
difference in the degree of agglomeration of the yield among between NI, FL and MA
microspheres is less than 5 % (Table 10). Among these, MA microspheres had
markedly larger mean size (6-13 %) but only slightly higher drug content (4-5 %).
Overall, it was clearly seen that the drug content was not predominantly affected by
microsphere size and extent of cross-linking. The viscosity of sodium alginate played
a more important role as indicated by their linear relationship with drug content (r
2
=0.977). The viscous nature of sodium alginate acted as a barrier to the diffusion of
drug out of the alginate globules during emulsification with less drug lost to the
continuous phase during the process than if alginate was not present.
90
Figure 10. (a) Blank alginate microspheres. (b) Alginate microspheres containing
sulphaguanidine (indicated by bright drug crystals present in the microspheres).
(a)
(b)
100
µ
m
91
Microspheres produced from the different types of sodium alginate showed
relatively rapid rate of release with more than 50 % of sulphaguanidine released at the
end of 60 min (or 3600s). Drug release from LH microspheres was the fastest,
followed by MP, NI, MA and FL microspheres (Table 11). As sodium alginate was
cross-linked to form insoluble calcium alginate microspheres, the influence of
viscosity was expected to be manifested primarily through its effect on microsphere
morphology. LH and MP microspheres produced from alginates of lower viscosity
were largely discrete. The smaller LH microspheres exhibited a faster drug release
than the larger MP microspheres. For alginates of higher viscosities (NI, FL and MA),
extents of aggregation and cross-linking played much more important roles (Figure
11). Drug release trends in distilled water and in 0.1 N HCl (pH ≈ 1.2) were similar
but release rates were much higher in the acidic medium (Table 11). The latter was
attributed to the greater solubility of sulphaguanidine in acidic medium and
conversion of calcium alginate to alginic acid, which is more permeable to drug
diffusion. Similar findings in beads were observed by other researchers (Østberg et
al., 1994).
Further investigations were carried out to examine the relative influence of the
afore-mentioned factors. Alginate microsphere batches were separated into different
size fractions and the effect of microsphere size on the encapsulation properties and
drug release characteristics was studied. This would provide more conclusive
evidence on the effects of alginate composition and the extent of calcium cross-
linking on the drug encapsulation efficiency and release properties of the
microspheres with defined size range of microspheres. Microsphere batches of 54-75
µm were obtained for each type of alginate microspheres by sieving. Sieved
microspheres in the size range of 54-75 µm were denoted as S microspheres to
92
Table 11. Release parameters of alginate microspheres in different media.
Release in deionised water
Release in 0.1 N HCl
S microspheres* Calcium alginate microspheres
Calcium alginate microspheres
t
25%
(s) t
50%
(s) t
25%
(s) t
50%
(s) t
25%
(s) t
50%
(s)
Alginate
code
LH 408.75 ± 12.74
2220.63 ± 139.69 41.50 ± 4.66 104.50 ± 10.24 47.60 ± 5.70 69.00 ± 6.04
MP 127.75 ± 6.36
626.25 ± 72.78 67.75 ± 7.69 201.50 ± 9.56 41.75 ± 2.50 69.50 ± 6.76
NI 173.67 ± 11.23
946.67 ± 90.08 155.00 ± 16.96 1421.00 ± 207.98 64.83 ± 4.94 267.50 ± 48.90
FL 357.50 ± 28.47 1628.75 ± 139.69 593.33 ± 47.38 3441.67 ± 174.02
96.25 ± 5.33 758.13 ± 101.85
MA 230.00 ± 19.69
1468.75 ± 82.37 255.00 ± 19.24 2364.00 ± 186.67 79.00 ± 6.54 455.00 ± 31.83
*Sieved microspheres in the size range of 54-75 µm.
92
93
0
100
200
300
400
500
600
700
800
50 55 60 65 70 75 80 85 90 95
Ca
2+
content of microspheres (mg)
t
25%
(s)
0
500
1000
1500
2000
2500
3000
3500
4000
4500
t
50%
(s)
Figure 11. Changes in t
25%
and t
50%
with increased Ca
2+
content of alginate
microspheres
t
25%
t
50%
94
differentiate from the unsieved products.
Highly discrete MP microspheres were separated into different size fractions.
The larger size fractions showed comparable drug contents, which were significantly
lower than that of the smallest fraction (p<0.05) (Table 12). This is in contrast to
observations reported in other studies in which a higher drug content was observed in
larger size microspheres due to the significantly larger drug particles used (Wong et
al., 2002a). Regression analysis between the mean size value of each size fraction and
t
25%
or t
50%
revealed a strong dependence of drug release rates on the size of the
microspheres (r
2
>0.94). Increase in drug release rate with decrease in microsphere
size was attributed to the larger surface area to volume ratio of smaller microspheres
which promoted faster drug release (Table 12). Significant differences between the
t
25%
and the t
50%
values of each size fraction of microspheres further emphasized the
pronounced effect of the microsphere size on drug release from alginate microspheres.
For microspheres within the size range of 54-75 µm, MA microspheres had the
highest drug content followed by NI, FL, LH and MP (Table 10). A general increase
in drug content was observed with higher alginate viscosity and greater extent of
cross-linking (Tables 8 and 10). The results suggested that the viscosity of the alginate
and the amount of Ca
2+
cross-linked with alginate played more dominant roles than
microsphere size in controlling encapsulation efficiency of the microspheres.
Regression analysis between viscosity and drug content of S microspheres (r
2
>0.8, p
value= 0.031) as well as between Ca
2+
contents and drug content of the S
microspheres (r
2
< 0.6, p value= 0.130) revealed that the viscosity of alginates might
have a greater influence on the encapsulation efficiency of the microspheres. The high
viscosity grade alginate could impede drug loss by diffusion during the formation of
the microspheres. In addition, the higher drug contents observed in S
95
Table 12. Drug content and drug release parameters of MP microspheres of different
size fractions.
Size range of
microspheres
(µm)
Drug content (%) t
25%
(s) t
50%
(s)
32-53
27.77 ± 0.038
76.83 ± 4.39 184.17 ± 14.225
54-75
23.83 ± 0.200
127.50 ± 5.95 626.25 ± 72.783
76-100
23.86 ± 0.109
305.00 ± 26.61 2217.50 ± 39.449
101-125
22.78 ± 0.106
459.00 ± 18.33 2720.00 ± 171.464
96
microspheres produced from alginates of high viscosity grades (NI, FL and MA)
unequivocally reflected the stronger influence of viscosity over the amount of cross-
linking calcium on the drug content of these S microspheres (Tables 8 and 10).
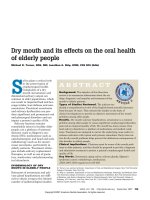
For S microspheres, it was generally observed that MP exhibited the fastest
rate of drug release followed by NI, MA, FL and LH microspheres (Table 11). Figure
12 suggests that the alginate matrix must be sufficiently cross-linked with at least a
minimum amount of Ca
2+
to be effective as a barrier to drug diffusion. It was also
noted that the decrease in the rate of drug release with increased Ca
2+
content was
only observed in microspheres produced with alginates of higher viscosity (Tables 8
and 10 and Figure 12). Among these alginates, MA and NI had low G while FL had
high G contents. Thus, this further supported the earlier suggestion that the viscosity
of the alginate would influence the interaction between calcium and alginate to a
greater extent than the monomeric composition of the alginate as a consequence of
cross-linking by emulsification. In fact, the S microspheres that were produced from
alginates with lower viscosities (LH and MP) also had lower calcium contents (Tables
8 and 10). These microspheres were less well cross-linked and swelled to a great
extent during dissolution studies, forming a gelatinous barrier which slowed down the
rate of drug release.
97
60 65 70 75 80 85 90 95
100
200
300
400
500
t
25%
t
50%
0
250
500
750
1000
1250
Ca
2+
content of alginate microspheres (mg)
t
25%
(s)
t
50%
(s)
Figure 12. Influence of Ca
2+
content on the rate of drug release of S microspheres.